CINF - 12 Dividend Aristocrats That Should Leave You Swimming In Cash
2023-04-22 08:00:00 ET
Summary
- Dividend aristocrats are famous for low volatility, good returns, and unbeatable income dependability in all economic conditions.
- Here are 12 dividend aristocrats with perfect DK safety scores that have potentially life-changing fundamentals.
- They create a high-yield portfolio with 40% smaller crashes than the S&P but with 300% better long-term returns, and 15% annual income growth over the last 25 years.
- All this is a pure stock portfolio with 10% less volatility and a 50% higher yield than a 60/40 retirement portfolio.
- These life-changing aristocrats are 20% undervalued and offer more than double the return potential of the market over the next three years. And in part 3 of this series, I'll show you one additional tweak that creates the Aristocrats + portfolio, boosting income by a further 33% and cutting already low volatility in half.
This article was published on Dividend Kings on Tuesday, April 18th.
---------------------------------------------------------------------------------------
Dividend safety in a recession is important for most investors. But for retirees counting on dividends to pay the bills can be the only thing that matters.
In part one of this series, I explained why dividend cuts tend to be rare for U.S. blue chips.
But for those seeking the bluest of blue-chips, aristocrats, companies with 25+ year dividend growth streaks help take dividend dependability to another level.
The dividend champions are indeed a wonderful group of companies with the following:
- 91% average safety
- 1.63% average severe recession dividend cut risk
- 2.6% very safe yield
- 8.13% long-term growth consensus
- 10.73% long-term total return consensus
- 41.8 year dividend growth streak
- 4.27% 30-year bankruptcy risk
- BBB+ stable credit rating.
Part 1 of this series ranked all the dividend aristocrats by safety, and in part 2 I'll show you how to construct the ultimate high-yield sleep well at night retirement portfolio.
One that's not just 100% aristocrats, but aristocrats with 100% safety scores, meaning 1% risk of a dividend cut in a severe recession and 0.5% risk in an average recession.
Let me show you how this can be done quickly, easily, and it could very well change your life.
Finding The Best Dividend Aristocrats For This Recession
Let me show you how to screen the Dividend Kings Zen Research Terminal, which runs off the DK 500 Master List, to find the ultimate safe dividend aristocrats for this recession.
The Dividend Kings 500 Master List includes some of the world's best companies, including:
- Every dividend champion (25+ year dividend growth streaks, including foreign aristocrats)
- Every dividend aristocrat
- Every dividend king (50+ year dividend growth streaks)
- Every Ultra SWAN (as close to perfect quality companies as exist)
- The 20% highest quality REITs, according to iREIT
- 40 of the world's best growth blue-chips.
| Step |
| Screening Criteria |
| Companies Remaining |
| % Of Master List |
| 1 |
| Dividend Champions List |
| 133 |
| 26.60% |
| 2 |
| Reasonable Buy or better (nothing overvalued) |
| 73 |
| 14.60% |
| 3 |
| 100% safety score |
| 49 |
| 9.80% |
| 4 |
| 10+% long-term return potential |
| 28 |
| 5.60% |
| 5 |
| BBB- credit rating or better (investment grade) |
| 12 |
| 2.40% |
| Total Time |
| 1 Minute |
In just 60 seconds, we can find 12 investment-grade aristocrats with perfect safety scores, market-level returns or better, and good valuations.
They also happen to yield 3%, the same as Vanguard's high-yield ETF (VYM).
So let me show you how impressive these 12 aristocrats really are and how they can help you sleep well at night while delivering some of the world's most dependable income in this and future recessions.
12 Dividend Aristocrats For The Ultimate High-Yield Retirement Portfolio
(Source: Dividend Kings Zen Research Terminal)
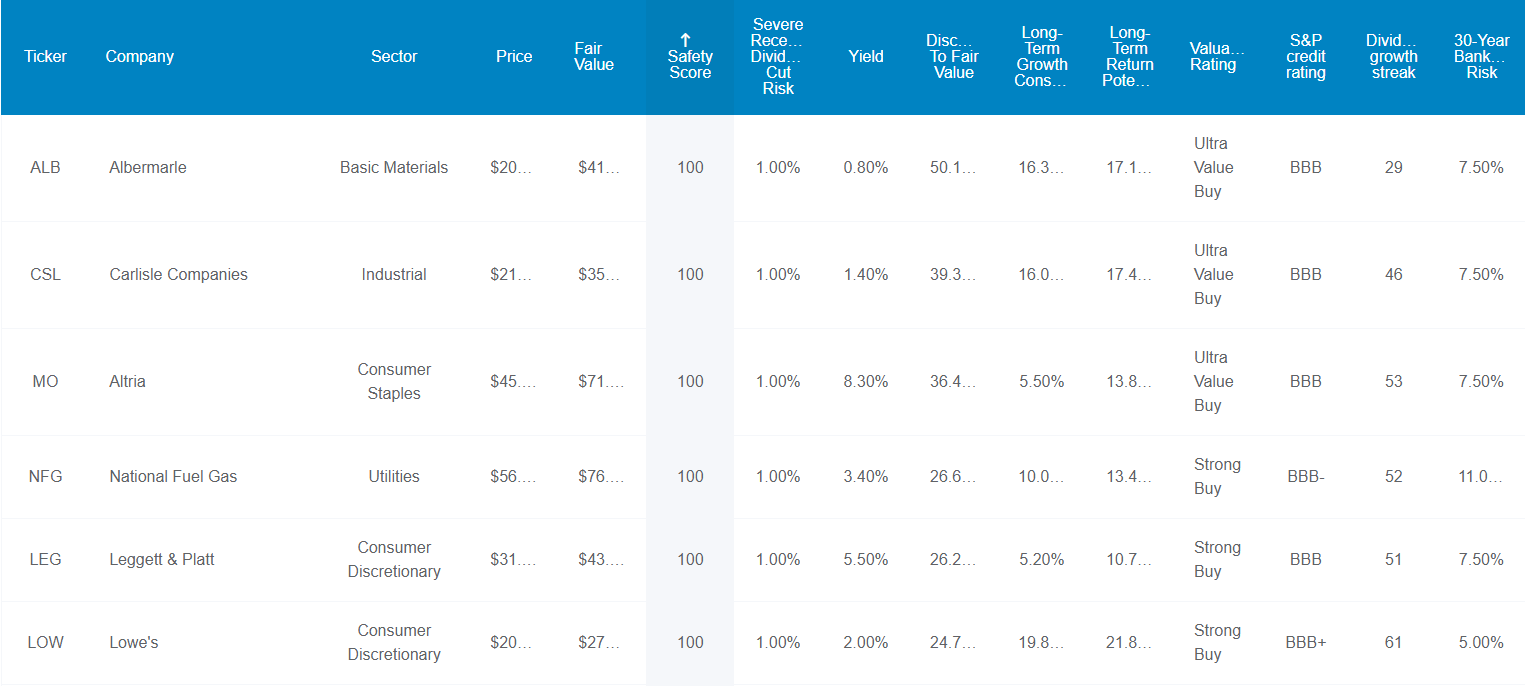
(Source: Dividend Kings Zen Research Terminal)
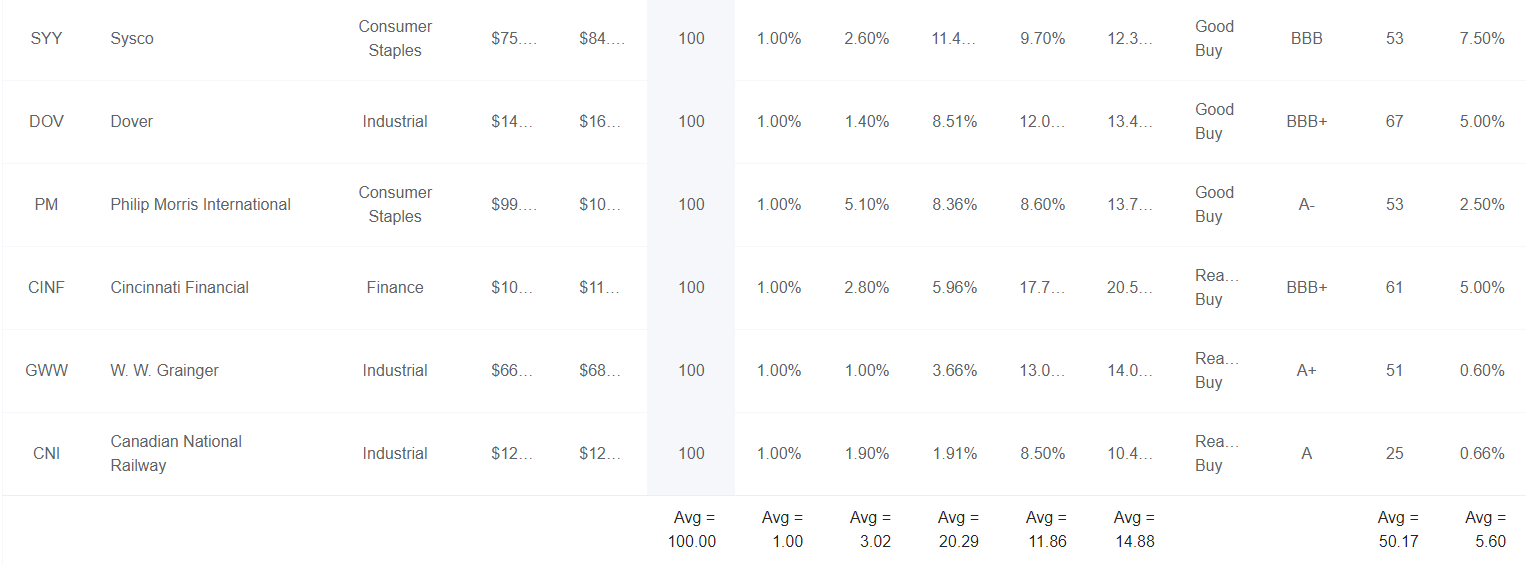
Tax implications:
- CNI is Canadian
- 15% dividend withholding for taxable accounts
- not in retirement accounts
- tax credit available for taxable accounts
- own in a retirement account to avoid paperwork.
I've linked to articles about each company for further reading and research.
- Albemarle ( ALB )
- Carlisle ( CSL )
- Altria ( MO )
- National Fuel Gas ( NFG )
- Leggett & Platt ( LEG )
- Lowe's ( LOW )
- Sysco ( SYY )
- Dover ( DOV )
- Philip Morris International ( PM )
- Cincinnati Financial ( CINF )
- W.W. Grainger ( GWW )
- Canadian National Railway ( CNI ).
Albemarle 2025 Consensus Total Return Potential
(Source: FAST Graphs, FactSet)
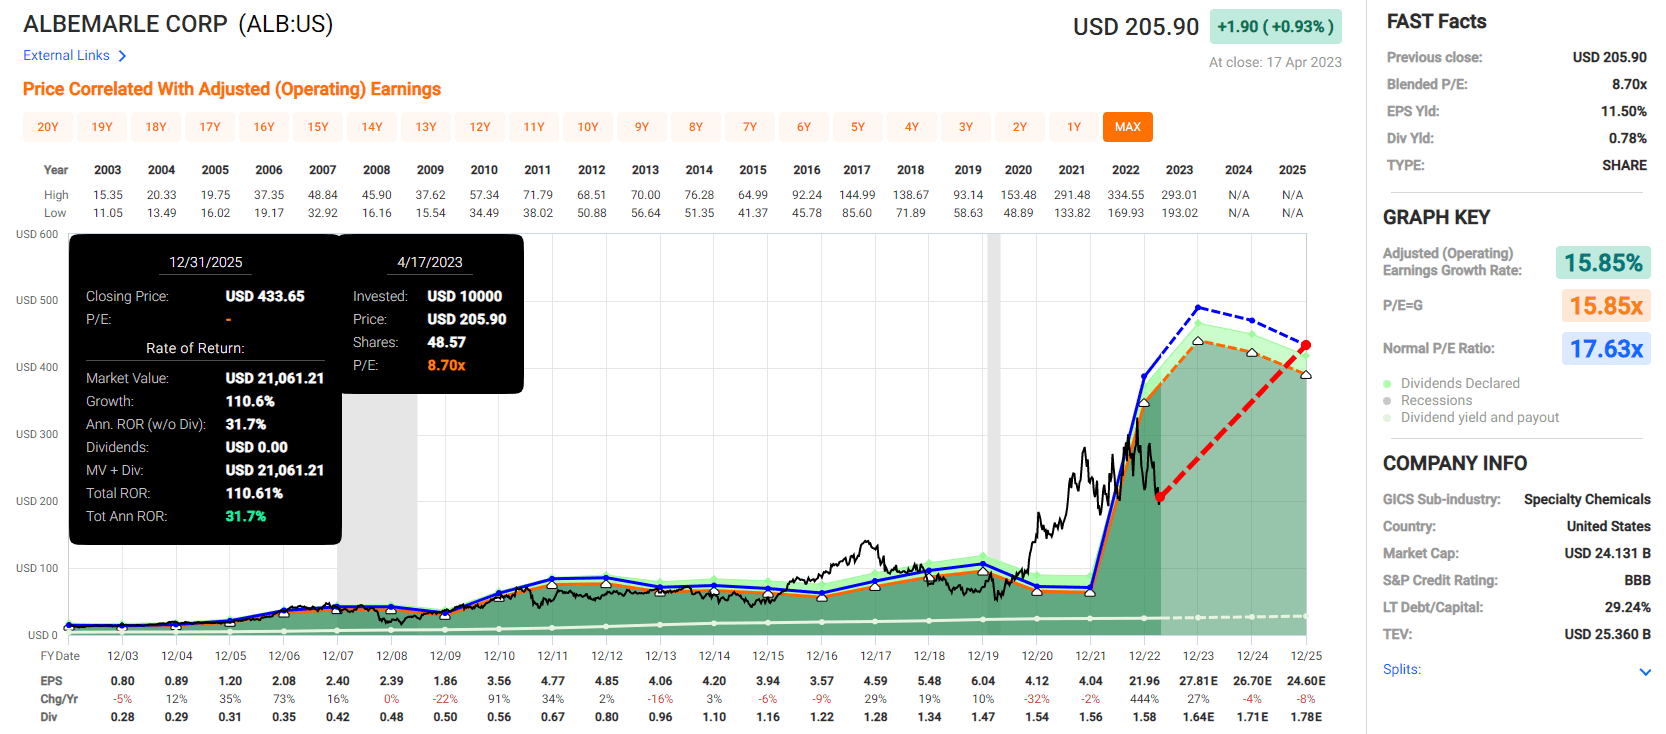
Carlisle Consensus 2025 Total Return Potential
(Source: FAST Graphs, FactSet)
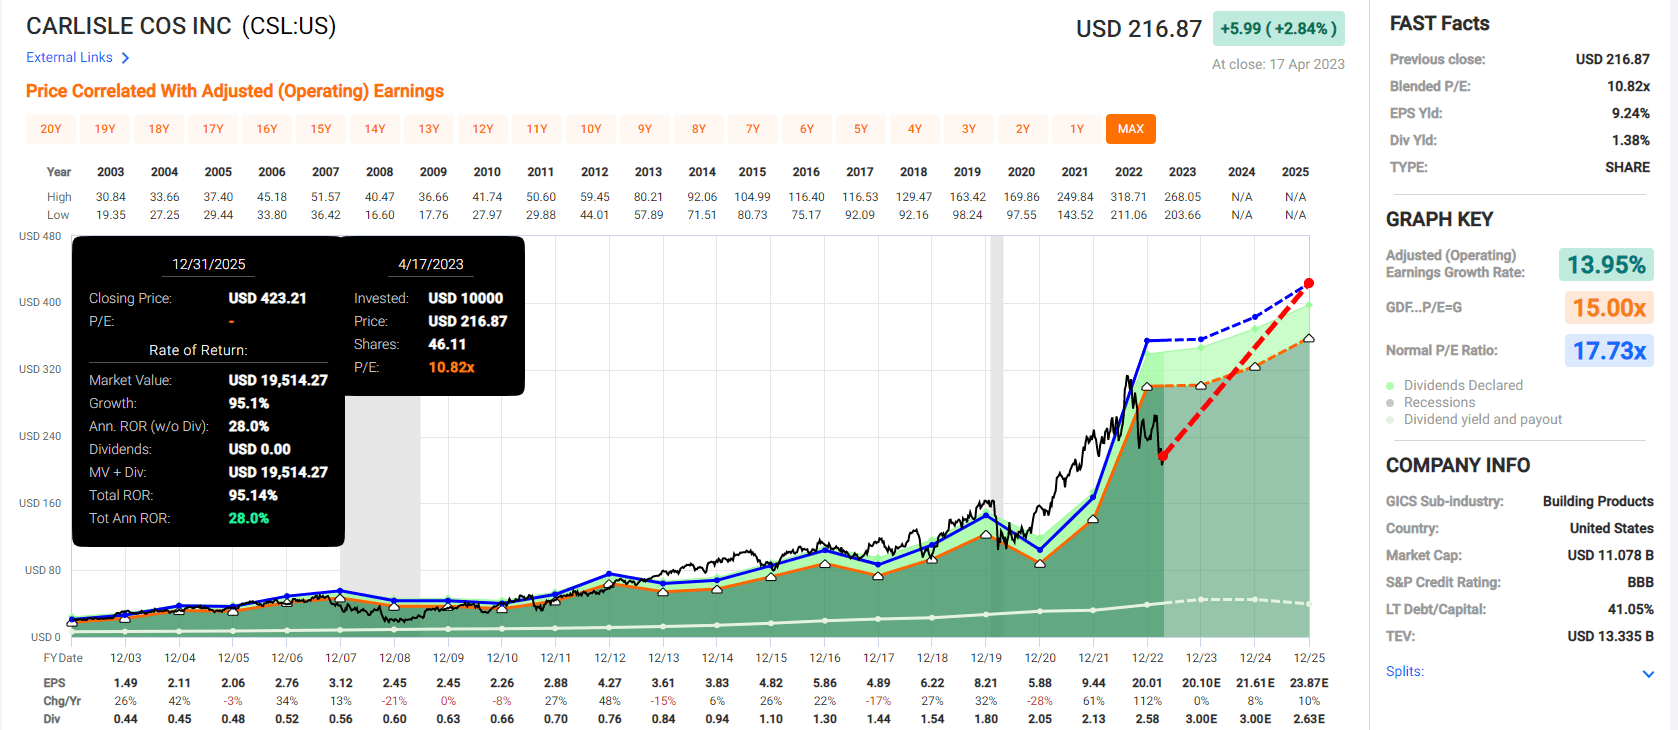
Altria Consensus 2025 Total Return Potential
(Source: FAST Graphs, FactSet)
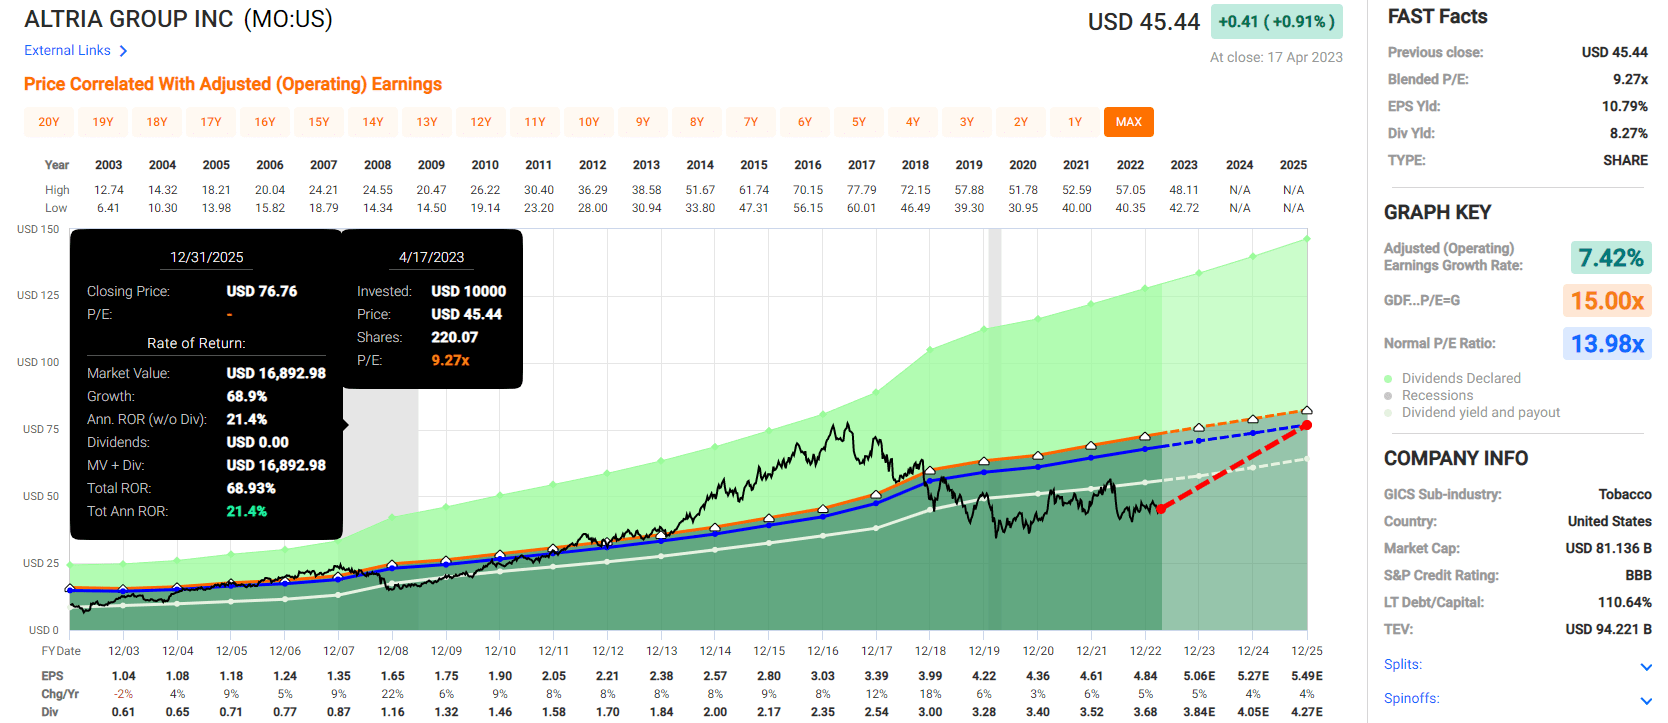
National Fuel Gas 2025 Consensus Total Return Potential
(Source: FAST Graphs, FactSet)
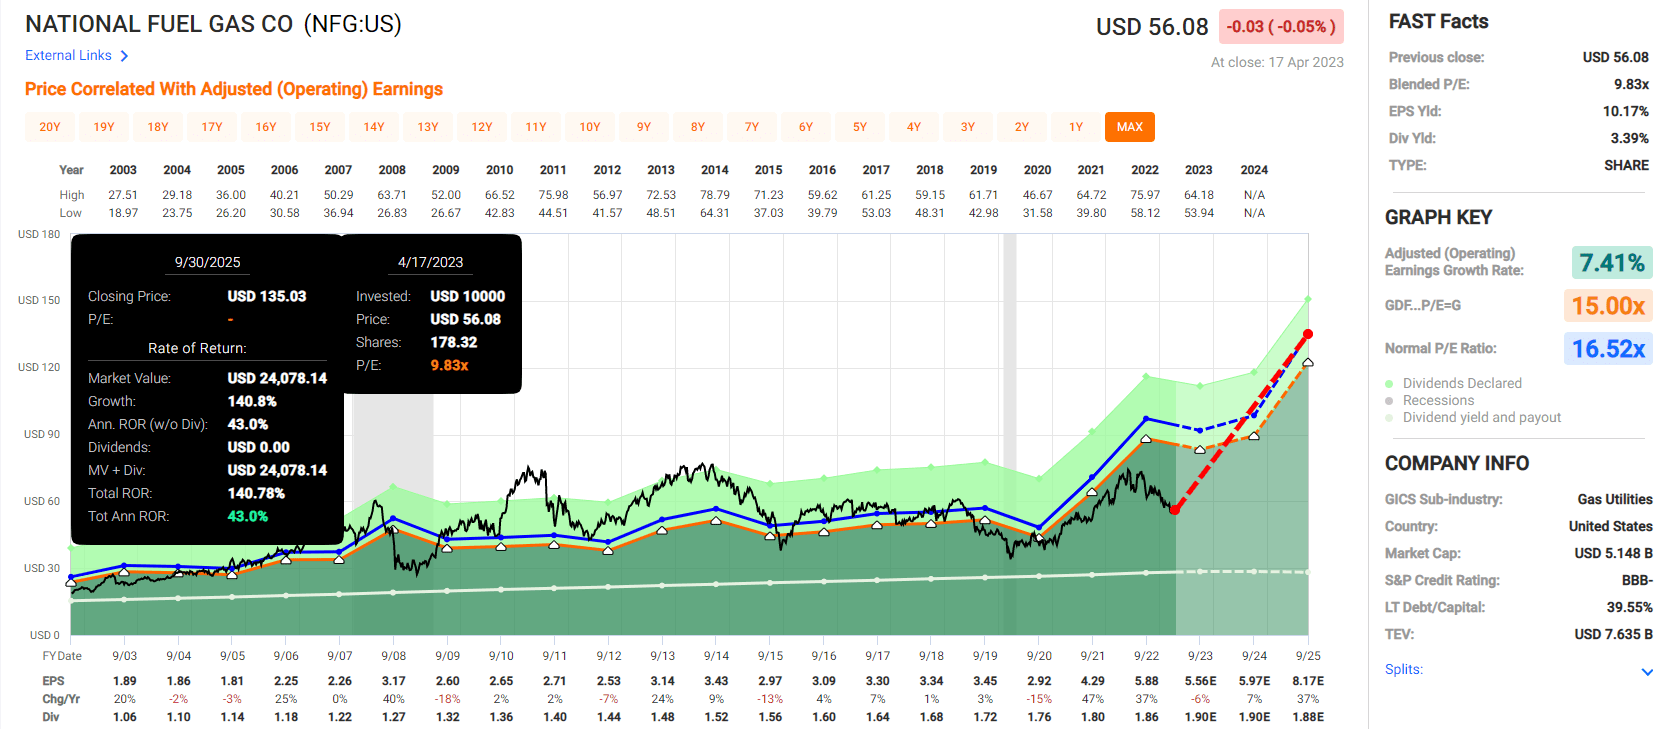
Leggett & Platt 2025 Consensus Total Return Potential
(Source: FAST Graphs, FactSet)
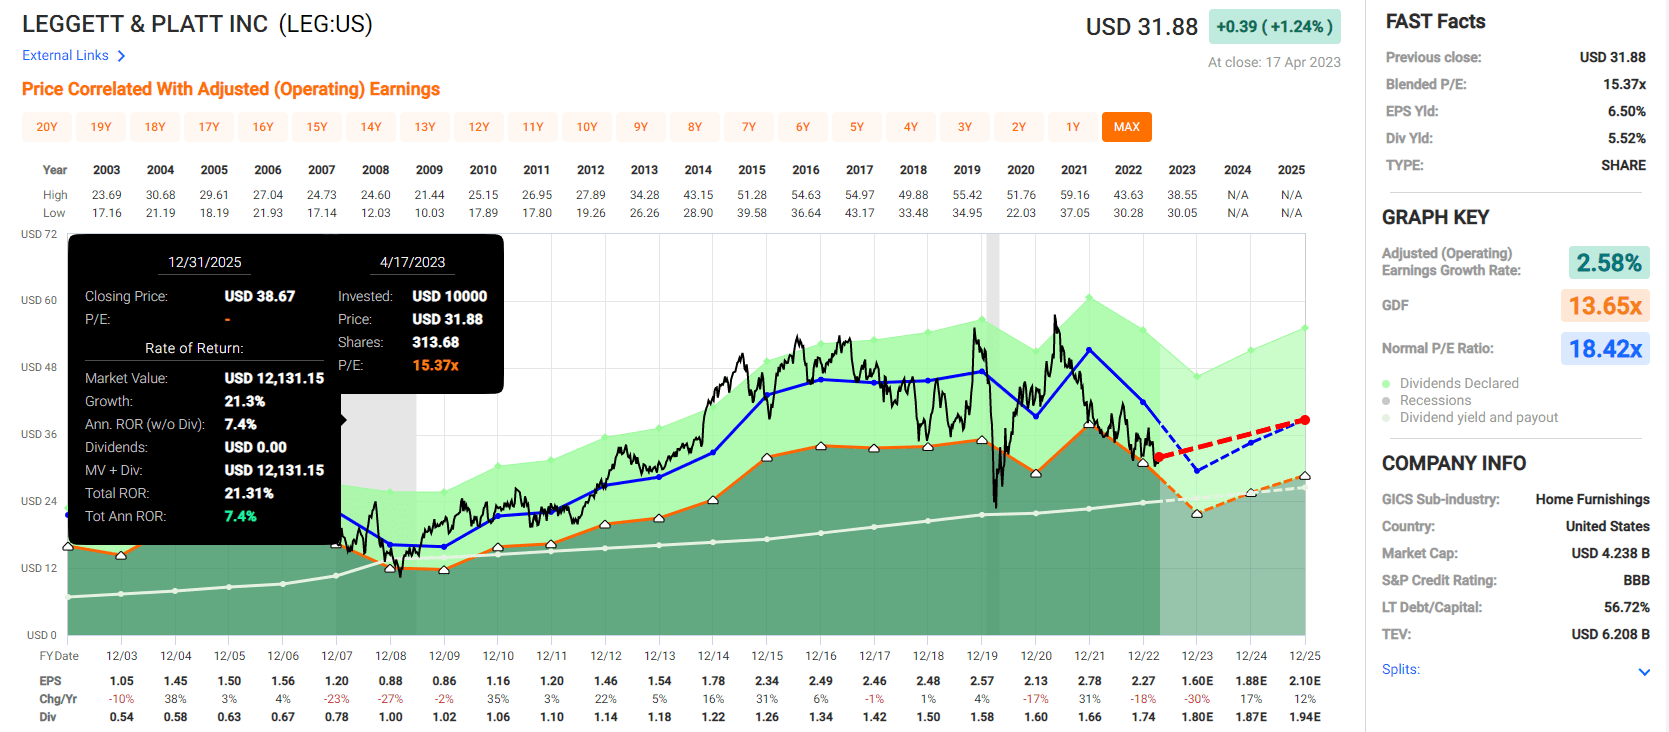
Lowe's Consensus 2025 Total Return Potential
(Source: FAST Graphs, FactSet)
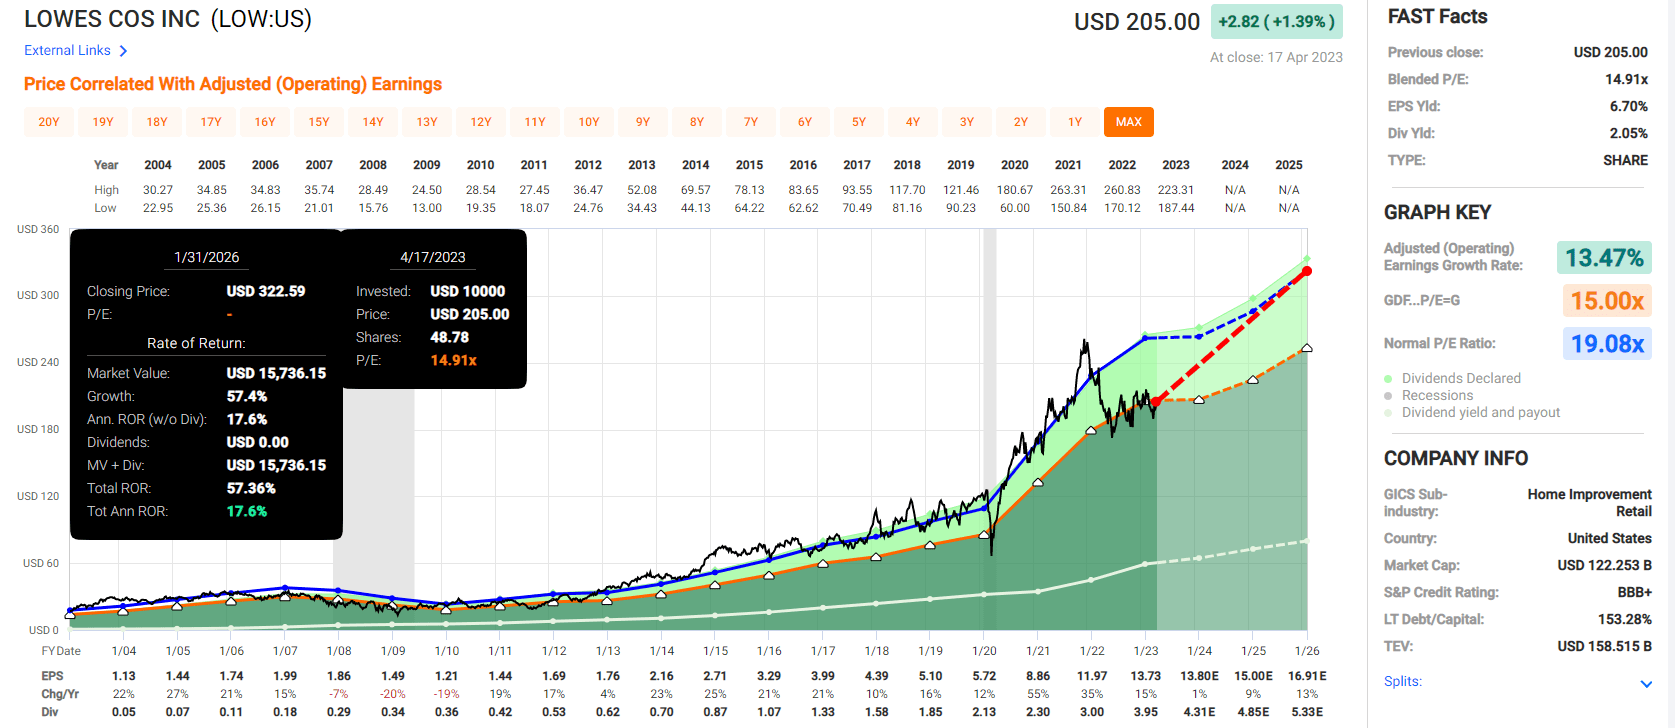
Sysco Consensus 2025 Total Return Potential
(Source: FAST Graphs, FactSet)
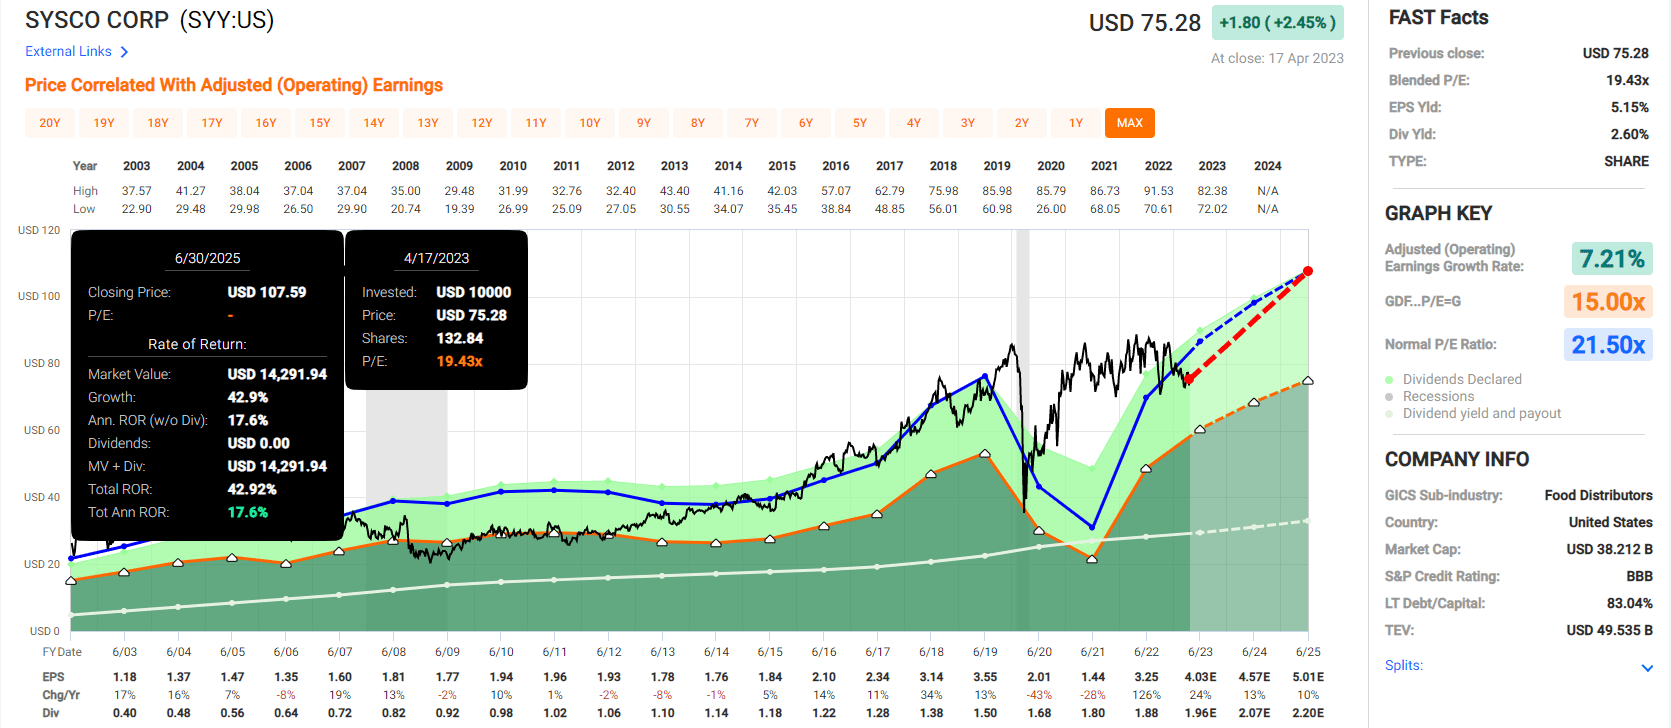
Dover Consensus 2025 Total Return Potential
(Source: FAST Graphs, FactSet)
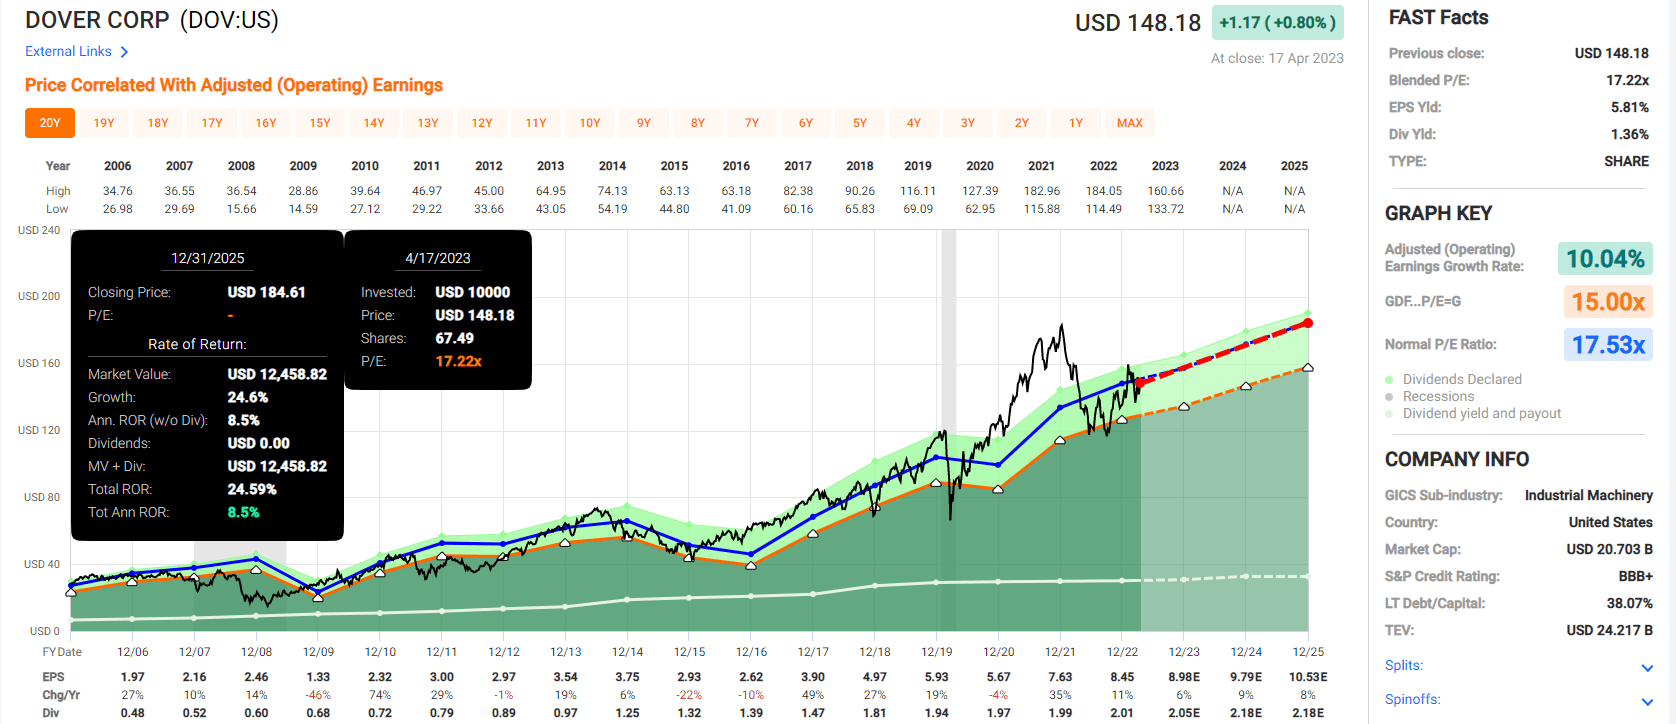
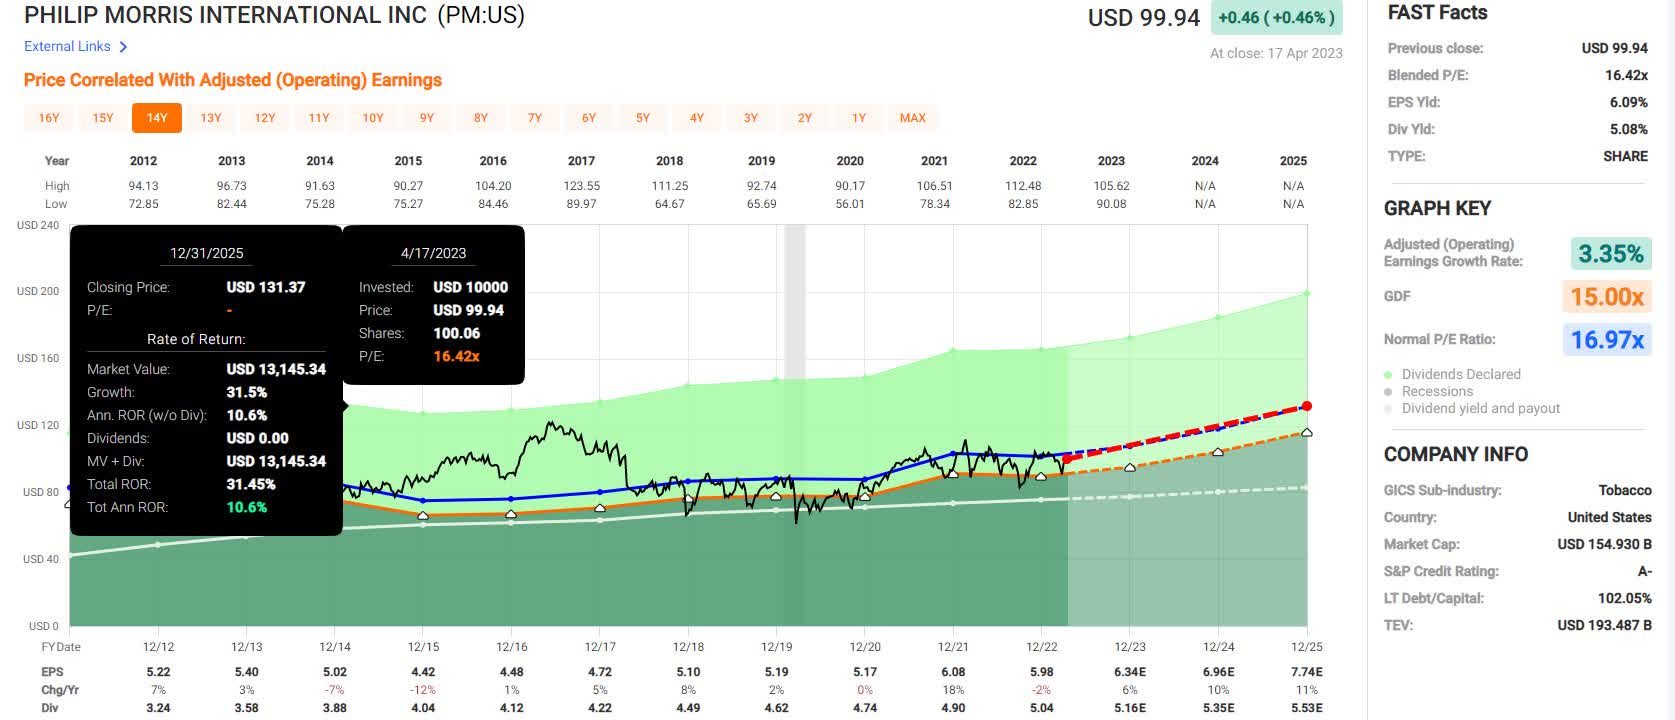
Philip Morris International 2025 Consensus Total Return Potential
Cincinnati Financial 2025 Consensus Total Return Potential
(Source: FAST Graphs, FactSet)
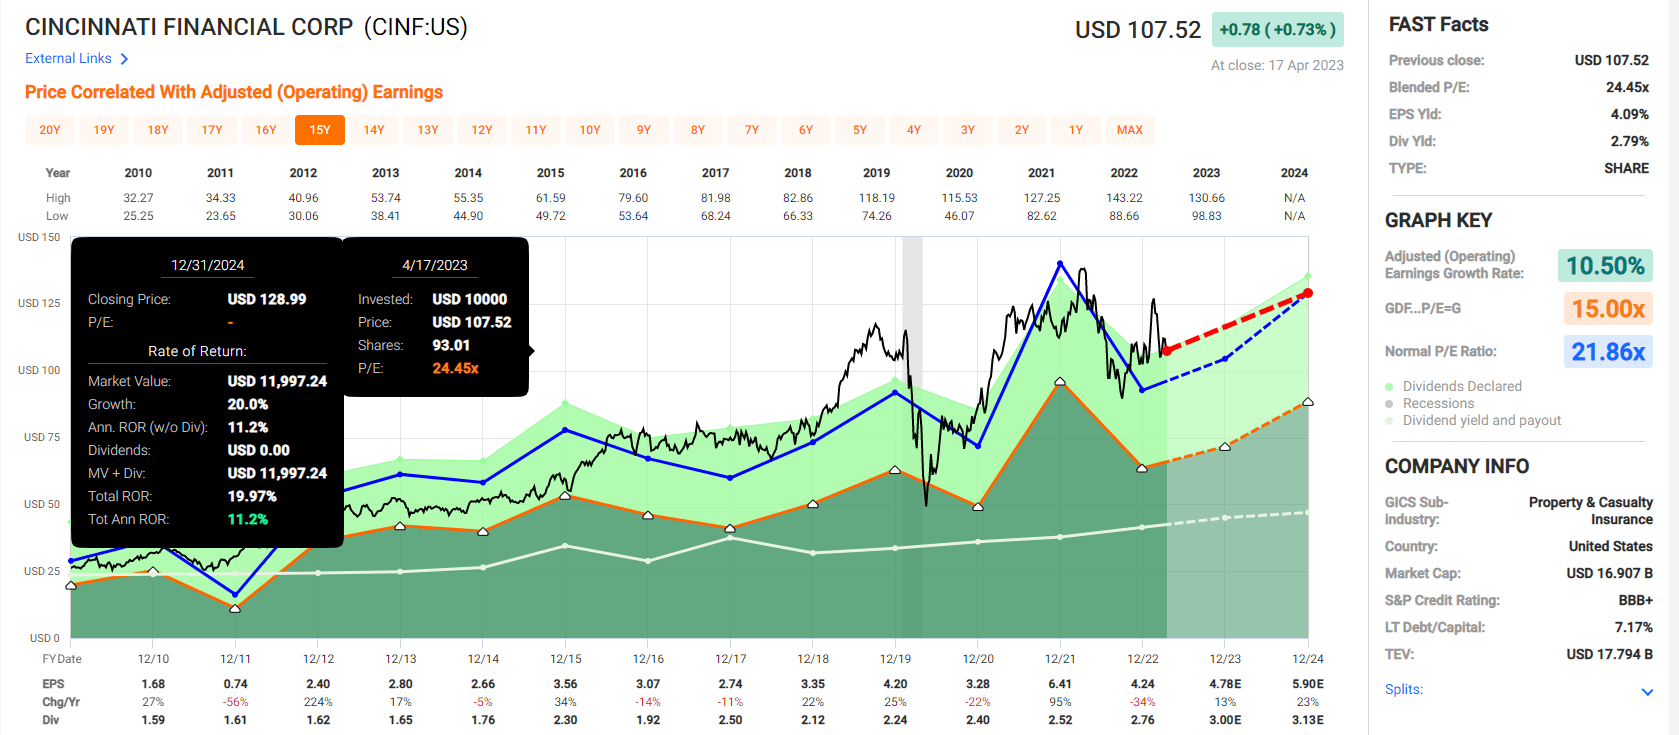
W.W. Grainger 2025 Consensus Total Return Potential
(Source: FAST Graphs, FactSet)
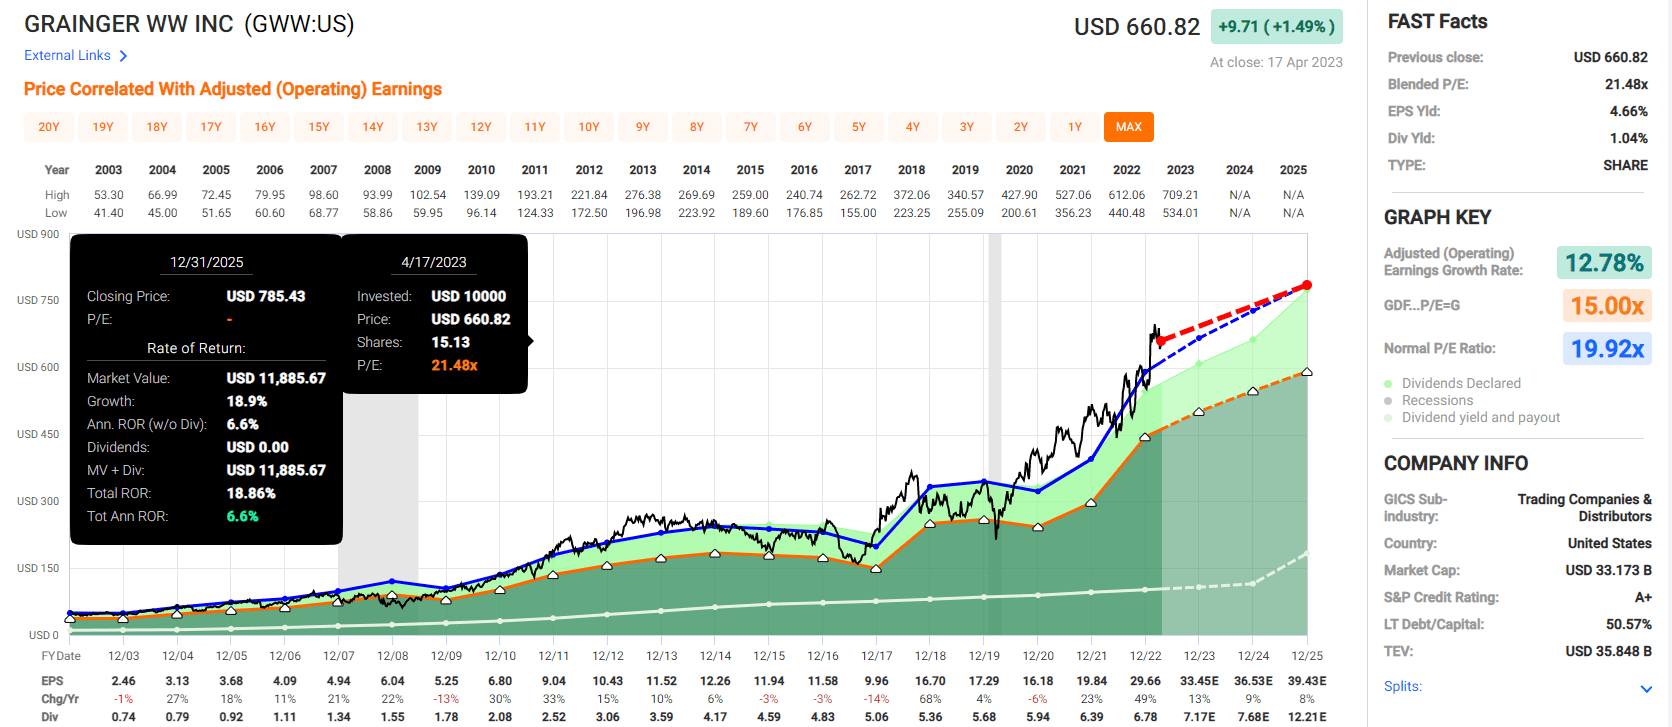
Canadian National Railway 2025 Consensus Total Return Potential
(Source: FAST Graphs, FactSet)
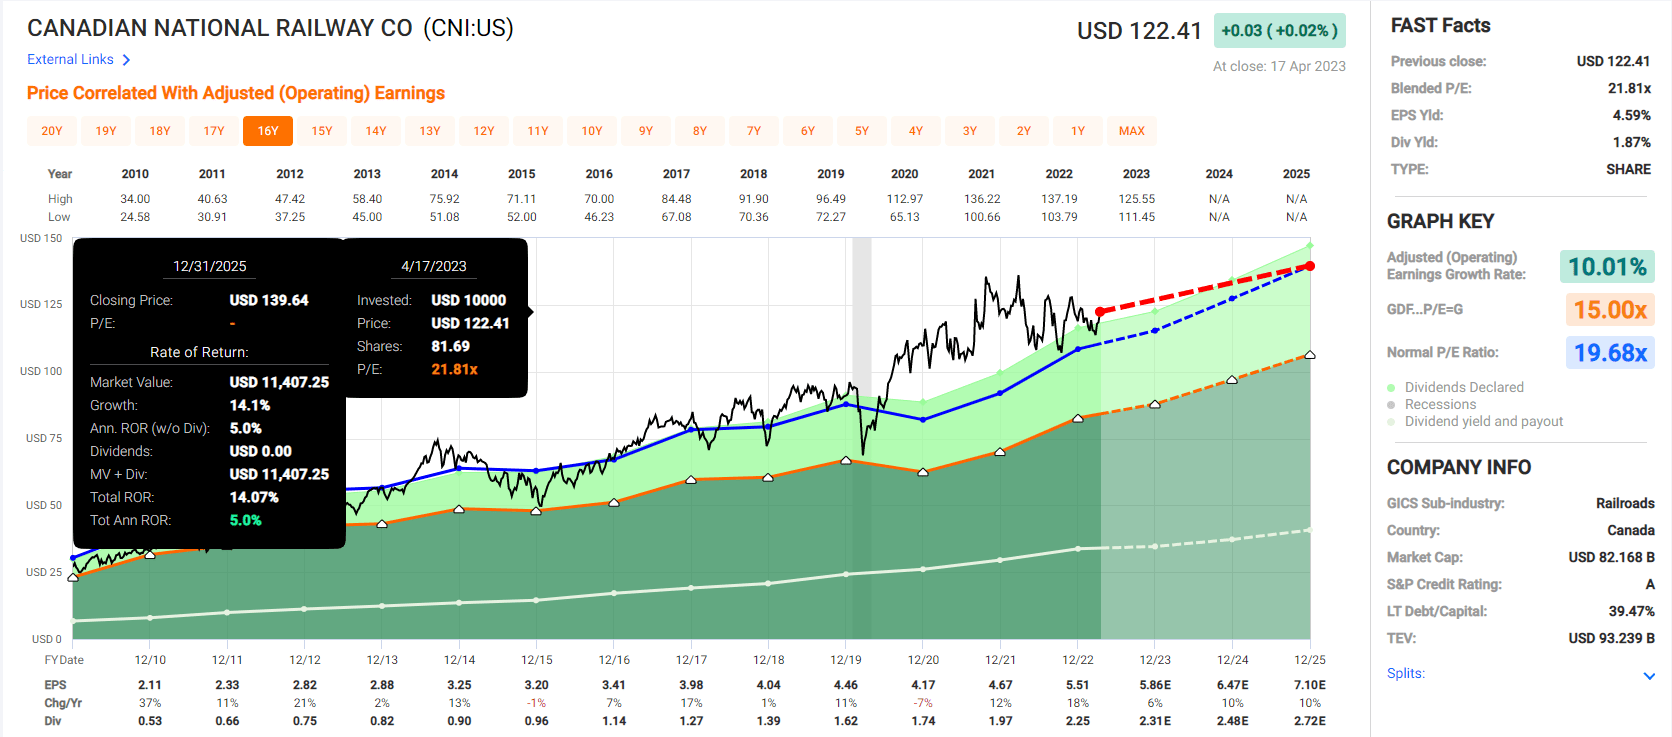
S&P Consensus 2025 Total Return Potential
(Source: FAST Graphs, FactSet)
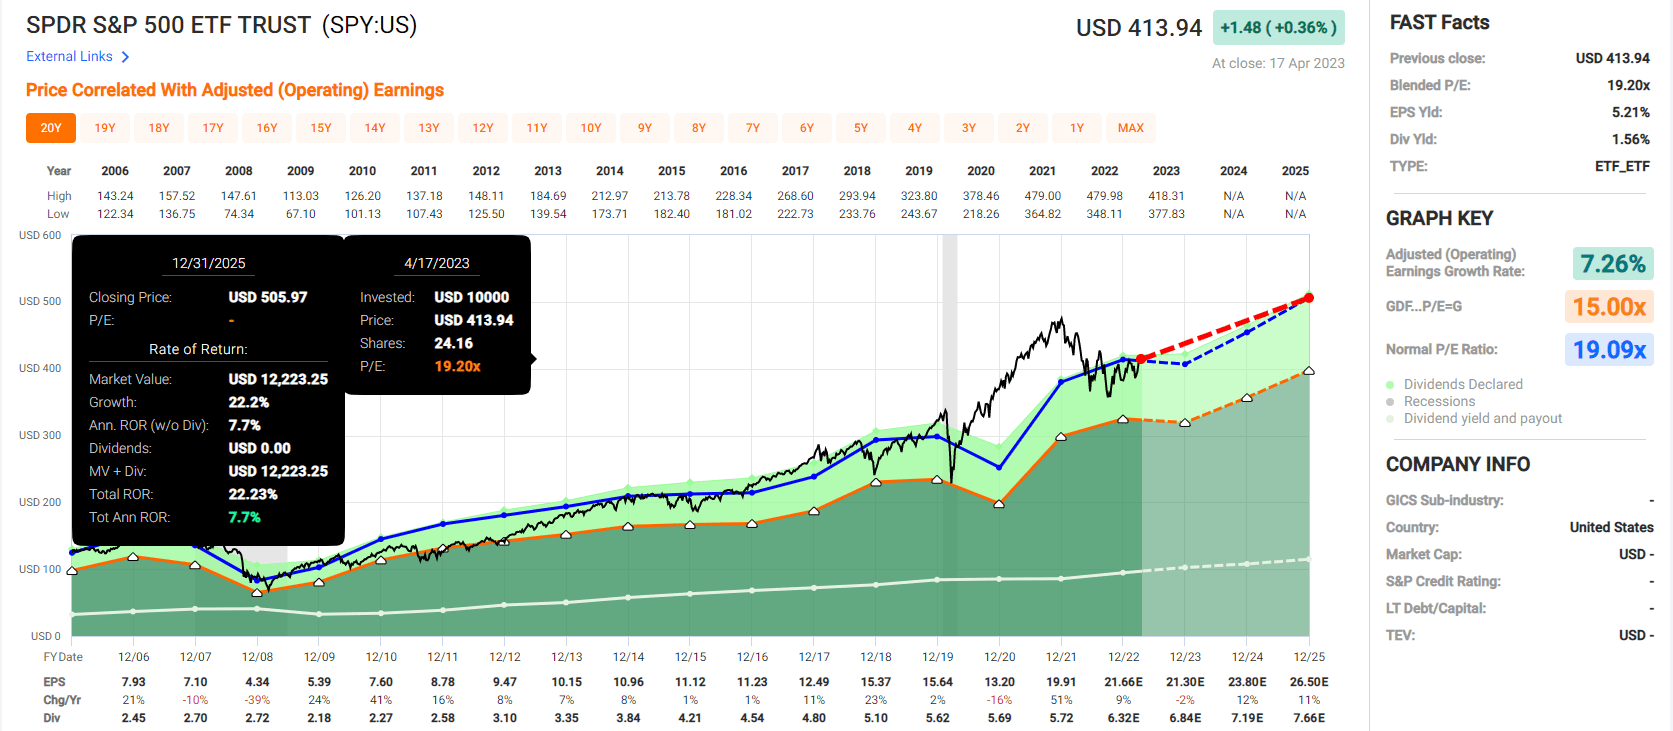
Average Aristocrat 2025 total return potential: 54% vs. 22% S&P.
Average Aristocrat 2025 annualized return: 17% vs. 8% S&P.
Fundamental Summary
- yield: 3.0% vs. 1.7% S&P
- safety: 100% (1% severe recession cut risk)
- dividend growth streak: 50 years (dividend king portfolio)
- credit rating: BBB+ stable (5.6% 30-year bankruptcy risk)
- discount to fair value: 20% vs. 8% overvalued S&P
- growth consensus: 11.9%
- total return consensus: 14.9% vs. 10.2% S&P 500 and 10.4% aristocrat.
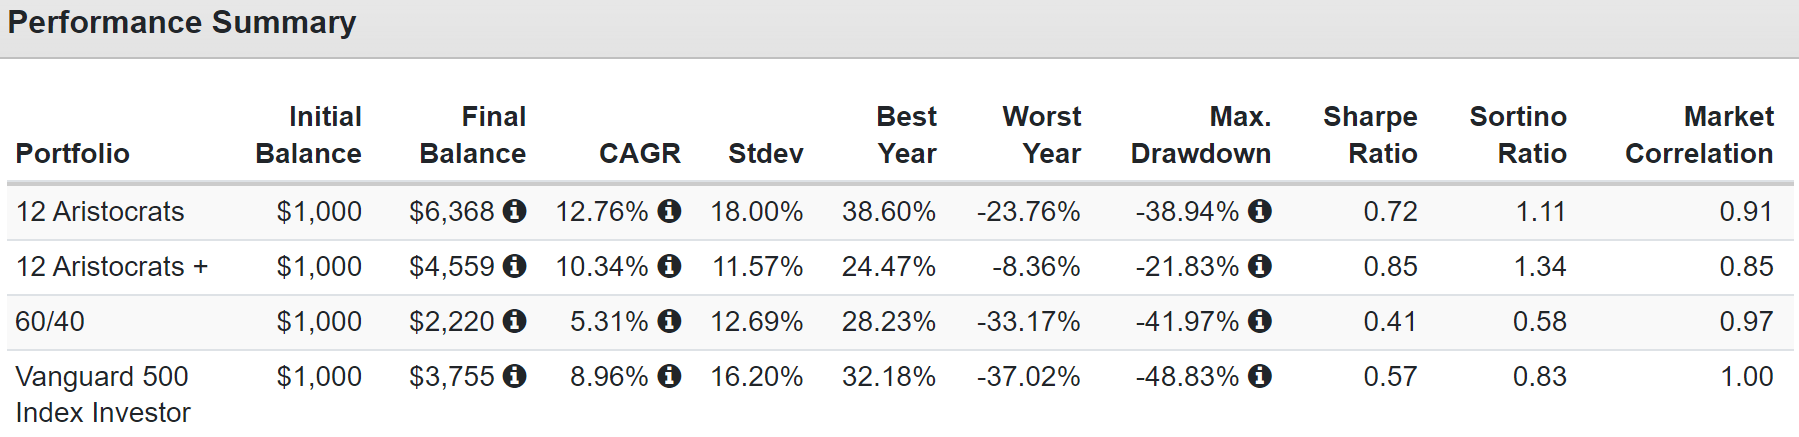
This is BBB+ rated dividend king portfolio that matches VYM for yield and has better long-term return potential than almost any popular ETF.
| Investment Strategy |
| Yield |
| LT Consensus Growth |
| LT Consensus Total Return Potential |
| Long-Term Risk-Adjusted Expected Return |
| 12 Aristocrats |
| 3.0% |
| 11.9% |
| 14.9% |
| 10.4% |
| ZEUS Income Growth (My family hedge fund) |
| 4.2% |
| 10.5% |
| 14.7% |
| 10.3% |
| Vanguard Dividend Appreciation ETF |
| 2.0% |
| 11.3% |
| 13.2% |
| 9.3% |
| Nasdaq |
| 0.8% |
| 11.2% |
| 12.0% |
| 8.4% |
| Schwab US Dividend Equity ETF |
| 3.6% |
| 7.6% |
| 11.2% |
| 7.8% |
| REITs |
| 3.9% |
| 7.0% |
| 10.9% |
| 7.6% |
| Dividend Aristocrats |
| 1.9% |
| 8.5% |
| 10.4% |
| 7.3% |
| S&P 500 |
| 1.7% |
| 8.5% |
| 10.2% |
| 7.1% |
| 60/40 Retirement Portfolio |
| 2.1% |
| 5.1% |
| 7.2% |
| 5.0% |
(Source: DK Research Terminal, FactSet, Morningstar.)
Ok, so superior yield to the market, much better yield, and return potential that's superior to the Nasdaq and Vanguard Dividend Appreciation Index Fund ETF Shares (VIG), the gold-standard aristocrat ETF.
What evidence do we have that these 12 aristocrats can actually deliver on these consensus forecasts?
Historical Returns Since 1996
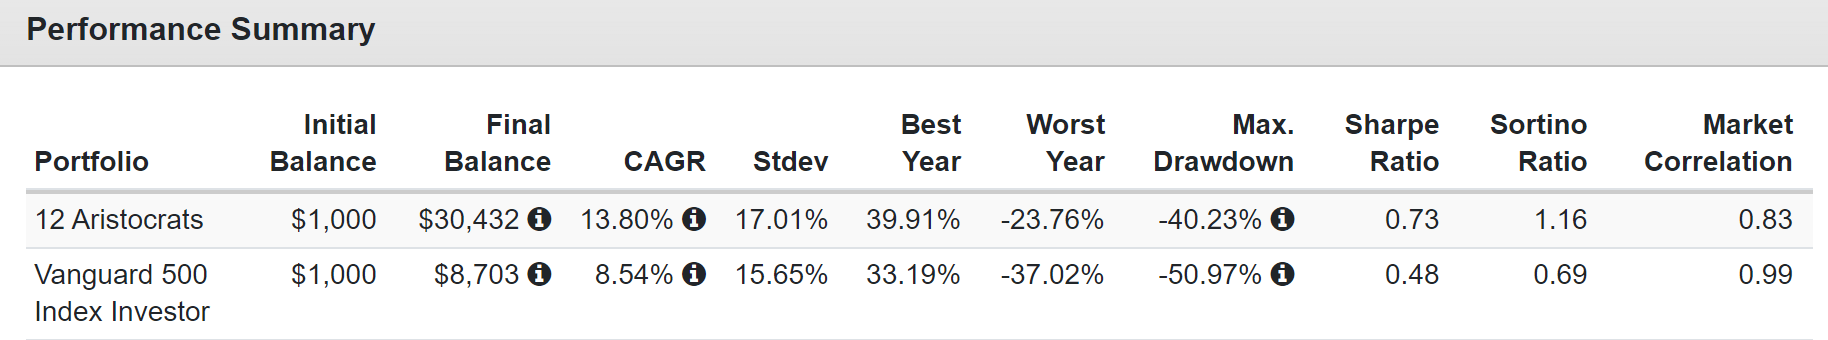
4X the returns of the S&P 500 (SP500) thanks to outperforming by 5.5% per year for a quarter century.
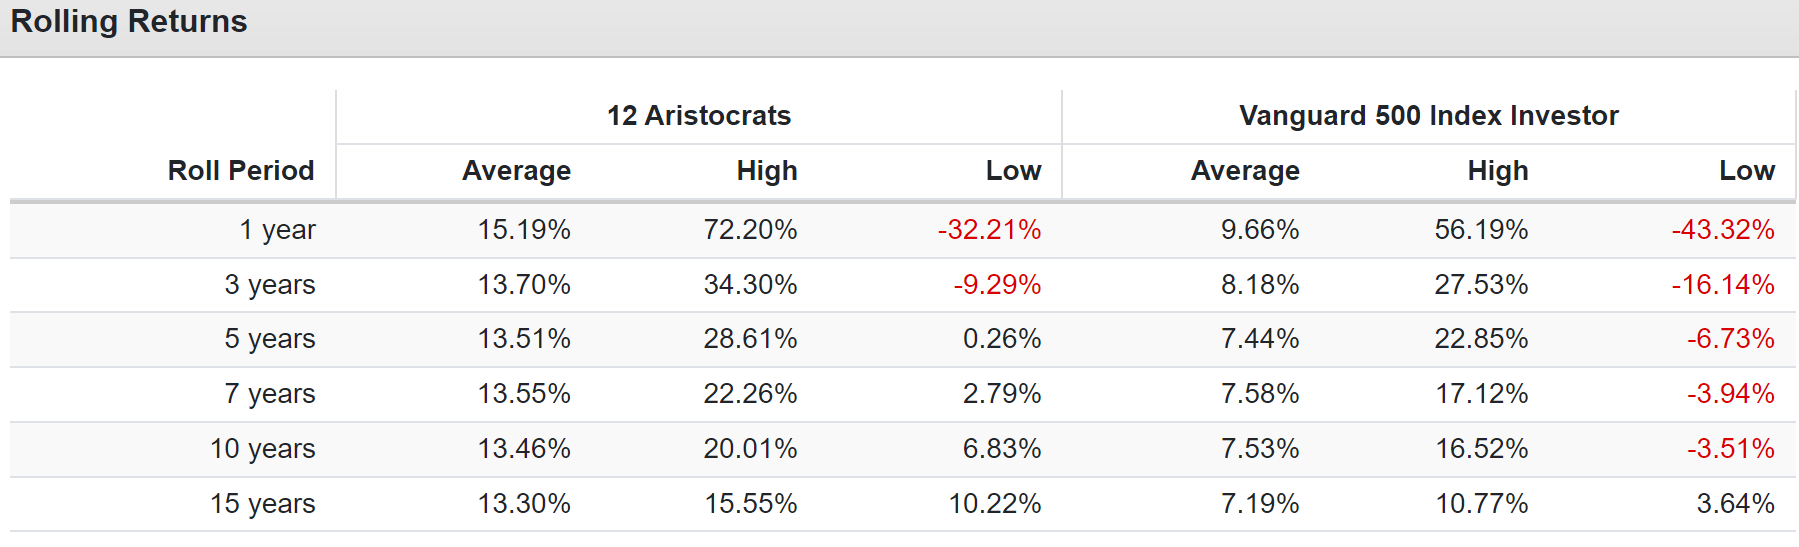
How reasonable is a 15% long-term return forecast for 12 mature blue-chips historically averaging 15.2% annular returns? Pretty reasonable.
How about a 10.4% risk-adjusted expected return that you should at least slightly beat the market over time, even if something goes wrong with these companies?
Given that they've run circles around the S&P for a quarter century in every time frame, I would say pretty reasonable.
What about dividend safety and income growth, the entire reason for buying these 100% safety score aristocrats?
15.2% Annual Income Growth Over 25 Years
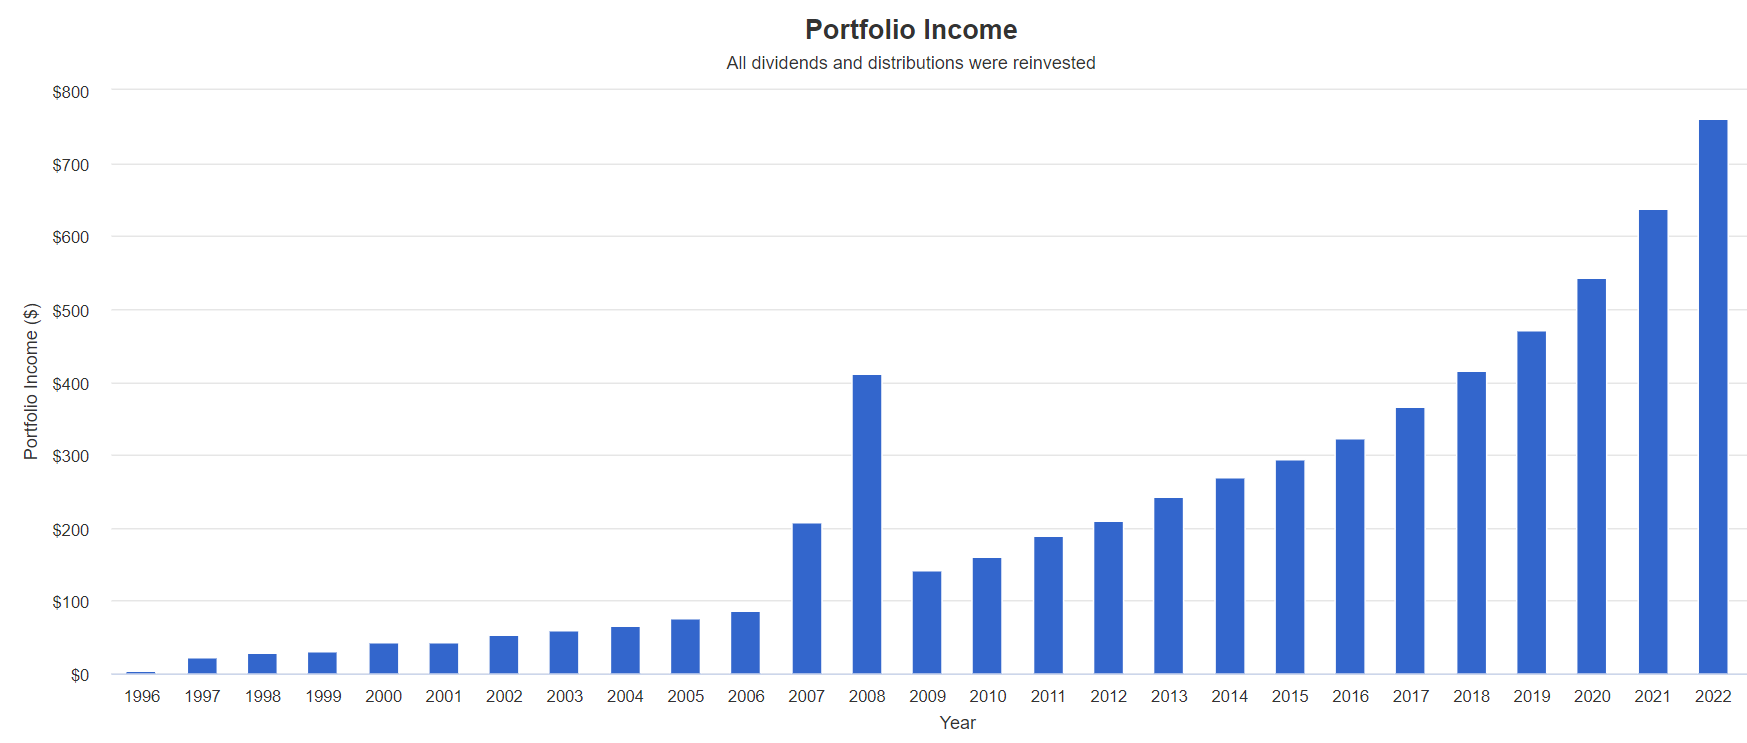
- 2.2% yield in 1997
- 76.2% yield on cost in 2022.
Income growth tracks total return over time and for these high-yield aristocrats it's matched the 12-month average rolling return exactly.
What does that mean in the future?
- consensus long-term income growth: 13% to 17% income growth
- 2X the dividends in 5 years = 6% yield on cost
- 4X in 10 years = 12% yield on cost
- 8X in 15 years = 24% yield on cost
- 16X in 20 years = 48% yield on cost
- 32X in 25 years = 96% yield on cost
- 64X in 30 years (retirement time frame) = 192% yield on cost.
Even adjusting for inflation, analysts expect about 38X income growth over the next 30 years.
- 114% inflation-adjusted yield on cost in 30 years.
Or, to put it another way, analysts currently think that if you invest $1000 in these 12 aristocrats, in 30 years, you could be getting $1,140 per year in inflation-adjusted income.
Even if you're already retired that kind of safe income growth is potentially life-changing.
And if you're not retired? If you have 40 or 50 years to let dividend compounding work its magic?
- 384% inflation-adjusted yield on cost in 40 years
- 1,293% inflation-adjusted yield on cost in 50 years
- 4,353% inflation-adjusted yield on cost in 60 years (investing lifetime).
Dividend aristocrats aren't just for retirees or boring old fogies like myself!
- I'm an old soul;)
For someone just starting out investing, $1 invested today could become $44 in inflation-adjusted income...per year in 60 years.
- $10,000 investment paying $440,000 per year in inflation-adjusted dividends
- $17.8 million portfolio value (historical fair value 2.5%) in today's dollars.
Life-changing generational wealth...from dividend aristocrats with perfect dividend safety scores.
Oh, and did I mention this?
Low Volatility To Help You Sleep Well At Night
Aristocrats are historically low volatility, about 20% less than the S&P 500.
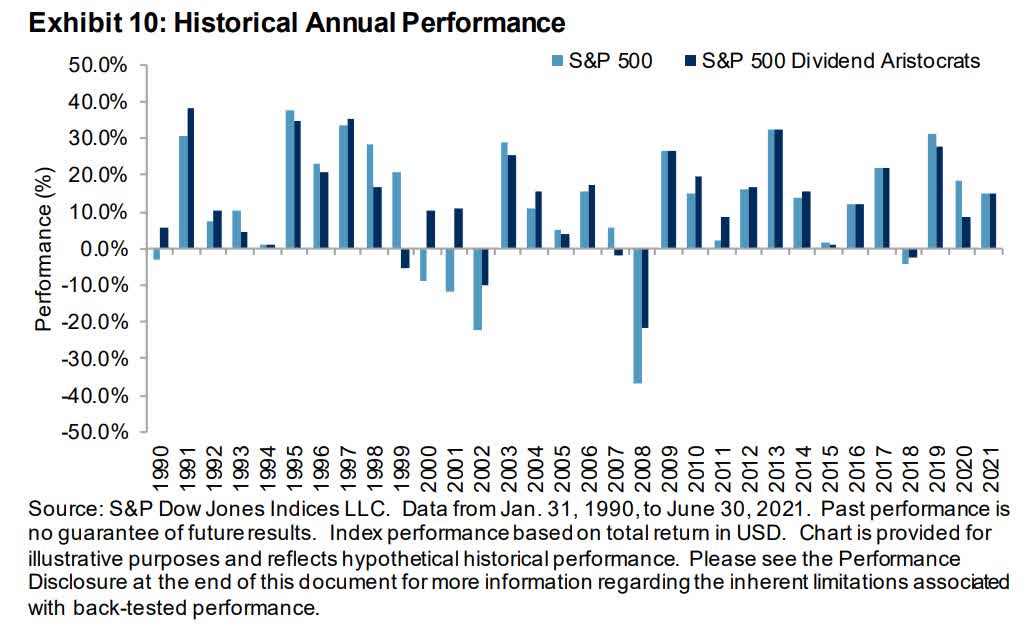
By falling less during bear markets and merely keeping up in good times, aristocrats have historically outperformed the S&P and with 40% better volatility-adjusted returns.
OK, but that's all aristocrats, dozens of companies. These are just 12, mainly cyclical industrials, financials, and materials.
Surely they can't offer that kind of benefit too, can they?
- 69% better negative-volatility-adjusted returns than S&P for 25 years.
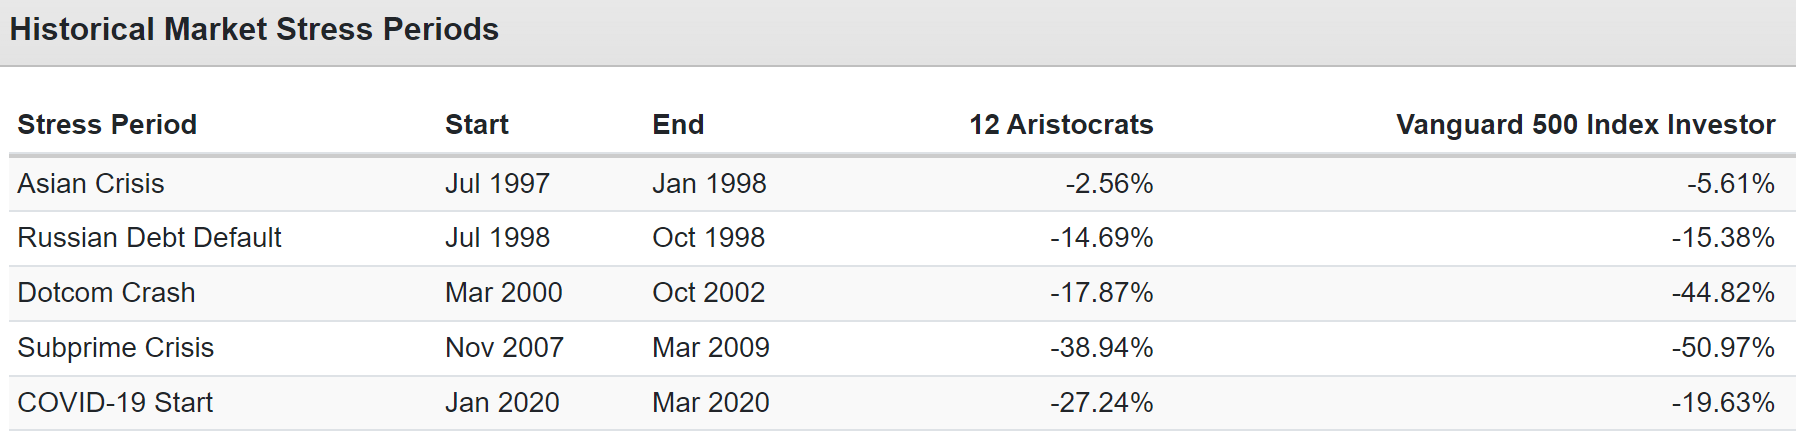
In every market downturn other than the Pandemic, they were less volatile than the market.
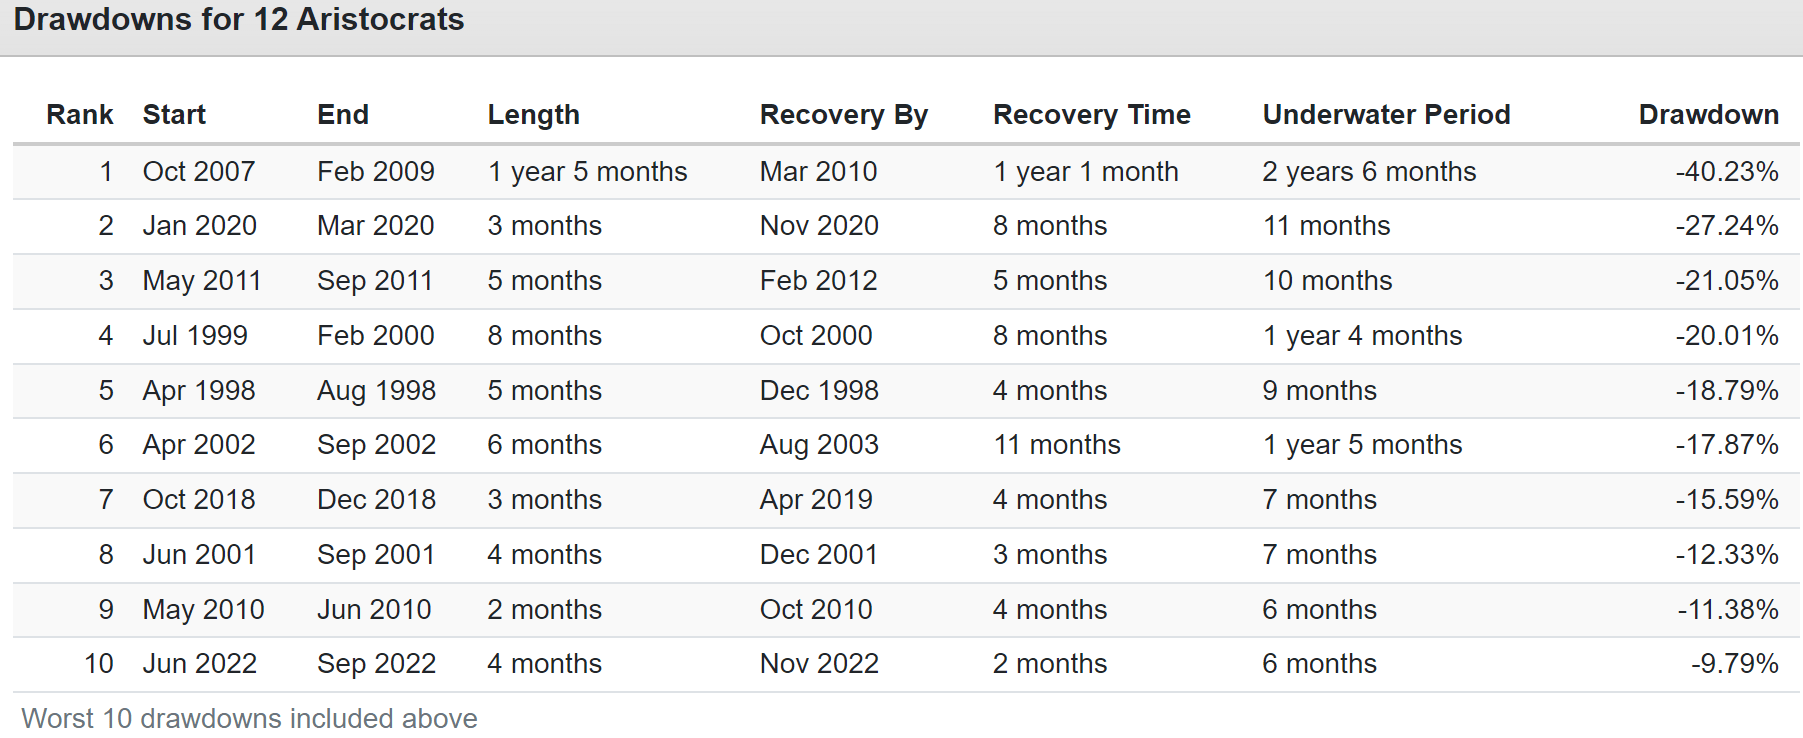
During the Great Recession, these aristocrats kept growing their dividends and fell 25% less than the S&P 500.
And then recovered record highs in half the time, 2.5 years vs. five years for the market.
12 Aristocrats Vs. S&P During Bear Markets
| Bear Market |
| 12 Aristocrats |
| 60/40 |
| S&P |
| 2022 Stagflation |
| -10% |
| -21% |
| -28% |
| Pandemic Crash |
| -27% |
| -13% |
| -34% |
| 2018 |
| -16% |
| -9% |
| -21% |
| 2011 |
| -21% |
| -16% |
| -22% |
| Great Recession |
| -40% |
| -44% |
| -58% |
| 2008 |
| -24% |
| -33% |
| -37% |
| 2002 |
| -1% |
| -22% |
| -33% |
| Average |
| -20% |
| -23% |
| -33% |
| Median Decline |
| -21% |
| -21% |
| -33% |
These aristocrats' average peak declines 40% less than the S&P 500. In fact, their average peak declines are on par with a 60/40 retirement portfolio.
- they historically capture 103% of the market's upside
- and just 79% of its downside.
Bottom Line: 12 Dividend Aristocrats For The Ultimate High-Yield Retirement Portfolio
Let me be clear: I'm NOT calling the bottom in EPD (I'm not a market-timer).
Even Ultra SWAN dividend kings can fall hard and fast in a bear market.
Fundamentals are all that determine safety and quality, and my recommendations.
- over 30+ years, 97% of stock returns are a function of pure fundamentals, not luck
- in the short term; luck is 25X as powerful as fundamentals
- in the long term, fundamentals are 33X as powerful as luck.
While I can't predict the market in the short term, here's what I can tell you about these 12 aristocrats.
- Albemarle ( ALB )
- Carlisle ( CSL )
- Altria ( MO )
- National Fuel Gas ( NFG )
- Leggett & Platt ( LEG )
- Lowe's ( LOW )
- Sysco ( SYY )
- Dover ( DOV )
- Philip Morris International ( PM )
- Cincinnati Financial ( CINF )
- W.W. Grainger ( GWW )
- Canadian National Railway ( CNI ).
These are 20% undervalued aristocrats with impeccable dividend safety and the potential to more than double the market's returns in the next three years.
Average Aristocrat 2025 total return potential: 54% vs. 22% S&P.
Average Aristocrat 2025 annualized return: 17% vs. 8% S&P.
Fundamental Summary
- yield: 3.0% vs. 1.7% S&P
- safety: 100% (1% severe recession cut risk)
- dividend growth streak: 50 years (dividend king portfolio)
- credit rating: BBB+ stable (5.6% 30-year bankruptcy risk)
- discount to fair value: 20% vs. 8% overvalued S&P
- growth consensus: 11.9%
- total return consensus: 14.9% vs. 10.2% S&P 500 and 10.4% aristocrat.
They have beaten the pants off the market for 25 years, delivering 4X more wealth and 15% annual income growth.
- 13% to 17% future income growth consensus.
They historically fall 40% less than the S&P while delivering market and Nasdaq-thumbing long-term returns.
These 12 aristocrats form a high-yield ultra SWAN dividend king portfolio that could change your life.
But wait, there's more!;)
In part 3, the conclusion of this series, I'll show you how to take this high-yield ultra SWAN aristocrat portfolio and make it even better in what I call the aristocrat + portfolio.
- 4.2% yield = 33% more income with zero extra fundamental risk
- volatility so low it's like rolling over market crashes in a Rolls Royce.
Total Returns Since December 2007 (Start Of The Great Recession)
Stay tuned for the exciting conclusion to this series about harnessing the awesome power of dividend aristocrats so you can retire safely and in splendor.
For further details see:
12 Dividend Aristocrats That Should Leave You Swimming In Cash