PMT - 12% Dividend Yield And 22% Upside
Summary
- You want huge yield with upside? Here it is.
- Rising short-term rates could push yields even higher.
- The market failure here is painfully obvious. Other investors are paying far more for a very similar share.
Get ready for charts, images, and tables because they are better than words. The ratings and outlooks we highlight here come after Scott Kennedy’s weekly updates in the REIT Forum. Your continued feedback is greatly appreciated, so please leave a comment with suggestions.
This time we’re doing a few quick shallow dives.
First topic is the NLY preferred shares.
NLY-F at $24.04 is not as attractive as NLY-I today at $20.30. Yeah, I know NLY-F has the bigger dividend yield. Maybe you think NLY is going to call NLY-F. It’s possible, but not a high probability in the near future. We need to be thinking about cash flows. After 6/30/2024, NLY-F and NLY-I will have extremely similar dividends. The difference is a rounding error. They also will have the same call value (obviously). For NLY-F to be the better deal it needs to pay out an extra $3.74 in dividends beyond what NLY-I pays out. There are only seven dividends left for that to happen. However, the upcoming dividend rate is already set. Expect it to be about $.55 for NLY-F. For NLY-I it will be about $.42. So that’s a difference of $.13.
After that, NLY-I still needs to outperform by $3.61 (that’s $3.74 minus $.13). NLY-I will have only six dividends to do it. Therefore, it needs to beat NL-I by $.60 per quarter. Since NLY-I is paying out $.42 per quarter, NLY-F needs to average $1.02 per quarter. That’s an annualized rate of $4.08. That would mean a 16.3% coupon rate. The spread is 4.993%. Therefore, 3-month LIBOR needs to average about 11.3%. If you actually believe 3-month LIBOR is going to average 11.3% from now to 6/30/2024, you would be buying put options on iShares 20+ Year Treasury Bond ETF ( TLT ) and just about every other index because 11.3% would utterly destroy the American economy.
You don’t have to change positions, but you should know the real math for comparing NLY-I to NLY-F. That’s the real math. Investors in NLY-F are paying materially more upfront per share to get a portion of the money they paid back in dividends. This is clear evidence of the market being sentimental as investors are looking at the “yield” and ignoring that they could save vastly more than the difference in dividends. Investors in NLY-F could swap to NLY-I and take a chunk of cash off the table. They would still have all the same upside and the cash they get today would be more than the total difference in dividends will be.
Before you say that “you can’t just do that,” you should know that the market is efficiently pricing AGNCM, AGNCO, and AGNCP relative to each other using this method.
It's pretty efficient in pricing CIM-B, CIM-C, and CIM-D against each other using this method. It's also doing well on TWO-A, TWO-B, and TWO-C relative to each other. This method is working very well in most cases, but we have a few cases where investors are blatantly ignoring the cash flows.
When the floating rate hits for NLY-I, the yield on today’s price should be nearly 12%. That’s a good choice for getting a double-digit dividend yield. However, there are plenty of bad choices. We don’t mean NLY-F either. Investors are NLY-F are getting a fair deal, but they are turning away from a dramatically better deal.
NLY-I can gain 22% just to reach call value. At that price it would still have a very respectable yield when the floating rate is active. Think lower rates would cause shares to crater? They traded above $25.00 while short-term rates were under 1%.
Bad Investment
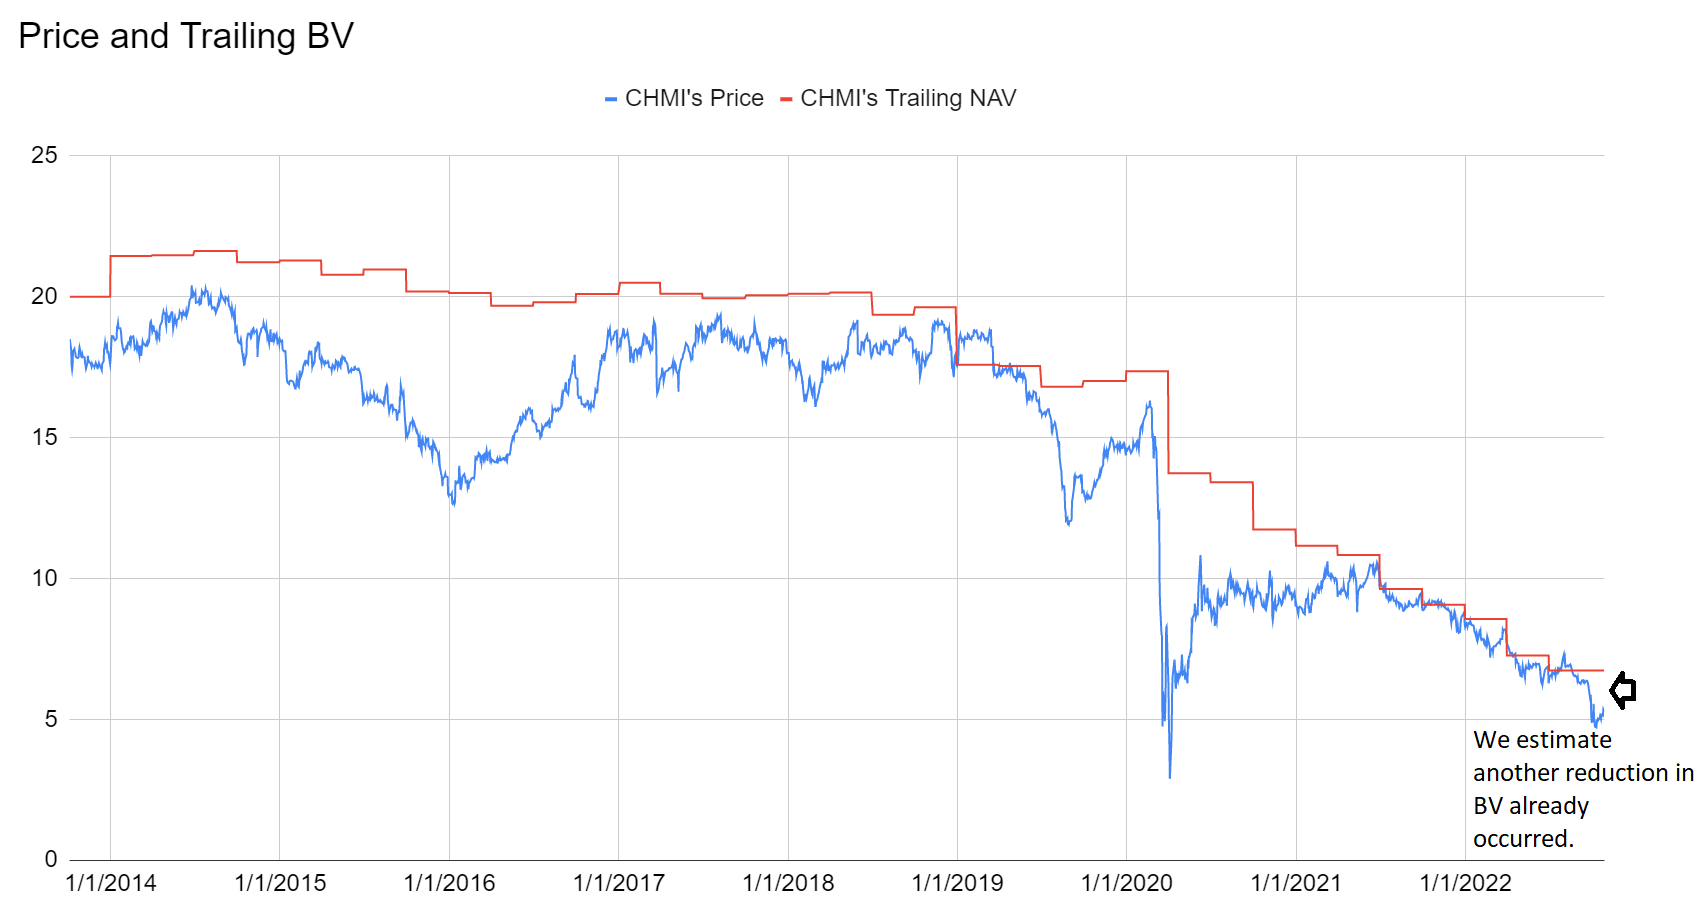
Next topic. Cherry Hill Mortgage Investment Corporation ( CHMI ) jumped 4% today. That’s probably because the market loved the report from PennyMac Mortgage Investment Trust ( PMT ). PMT saw a huge rally (up just over 10%). Rithm ( RITM ) is up 4.7%. Several of the mortgage REITs got in on this rally, even many that don’t own MSRs.
Sounds great, but CHMI is a regular loser. By our estimates, CHMI is trading around book value (using our projected BV from 10/21/2022). Why? Seriously, why are investors paying a premium for this REIT?
The REIT Forum
That chart does not deserve a premium valuation. No. If you want common shares, you can buy better mortgage REITs at significantly lower price-to-book ratios.
The last time CHMI saw an increase in BV per share was the end of 2019. When spreads widened in the pandemic, book value fell. When peers were bouncing back over the next few quarters, CHMI managed to continue losing money. It was NOT easy to lose book value during those quarters. Huge tailwinds were in place to drive gains for a few quarters.
In short, don’t overpay for CHMI. Time for a reverse split? Feels like a good time for a reverse split.
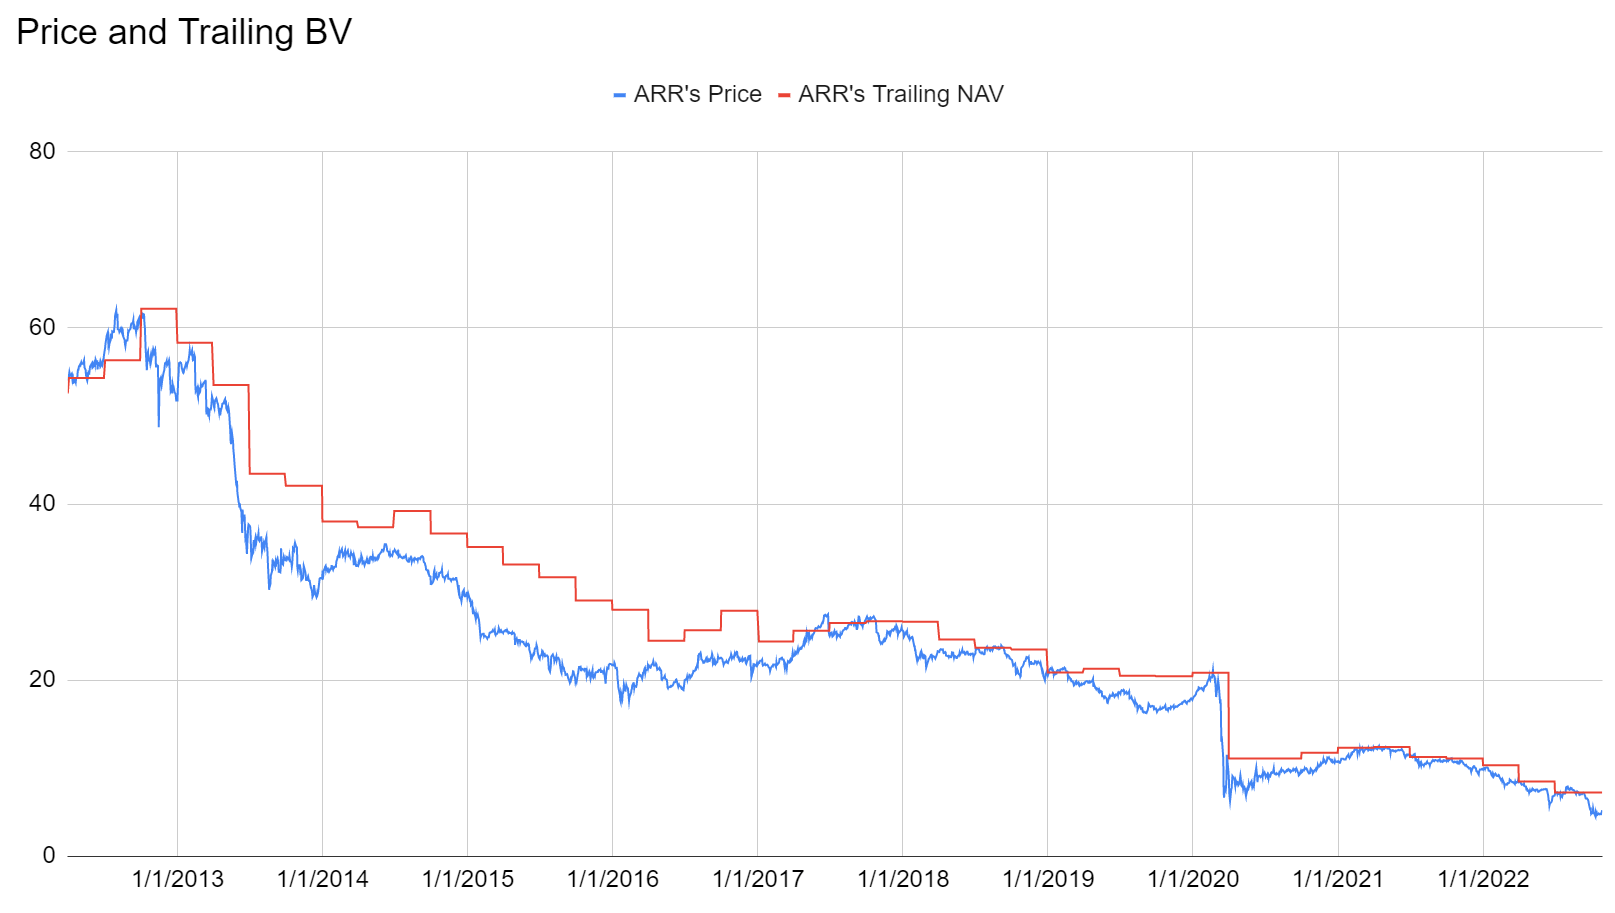
Hey, speaking of reverse splits, how about ARMOUR Residential REIT? Remember August 2015/ ARR had a 1 for 8 reverse split. Shares closed at $22.91 on August 3rd, 2015. How did they get back to $5.34 so fast?
The REIT Forum
That’s a really dreadful chart. Adjusted for the split, shares dropped from over $60 in 2012 to $5.34 today. Thinking that at least it has a solid discount to book? Nope. No Q3 2022 value in the chart. That’s a discount to Q2 2022. Toss in some book value destruction for Q3 2022 and shares are trading right around our estimated book value as of 10/21/2022.
Our estimates called for BV per share around $5.30 as of last Friday.
Today ARR reported their Q3 results and provided updated estimates of book value on the earnings call:
Seeking Alpha
How do we succeed while investing in mortgage REITs? That’s how.
For reference, book value per share was $7.25 at the end of Q2 2022.
It dropped 27% and yet Scott still pegged it. That’s outstanding.
Did ARR manage to do anything? Sure. ARR managed to issue some common stock during the quarter, so that’s something.
Who wants to gamble on those 20% dividend yields?
Outlooks
- Bullish view on NLY-I and expect it to dramatically outperform NLY-F.
- Bearish view on CHMI and ARR.
There’s still the potential for them to catch tailwinds when MBS to Treasury spreads shrink. However, there are vastly better choices available for investing in this sector. While I blew up CHMI and ARR for their poor performance, there have been success stories. For investors willing to trade between the shares to take advantage of pricing failures, there have been a ton of success stories.
The rest of the charts in this article may be self-explanatory to some investors. However, if you’d like to know more about them, you’re encouraged to see our notes for the series . The part below is reproduced in each article to provide investors with easy access to the updated charts. It is my gift to readers.
Stock Table
We will close out the rest of the article with the tables and charts we provide for readers to help them track the sector for both common shares and preferred shares.
We’re including a quick table for the common shares that will be shown in our tables:
| Type of REIT or BDC |
| Residential Agency |
| Residential Hybrid |
| Residential Originator and Servicer |
| Commercial |
| BDC |
Let the images begin!
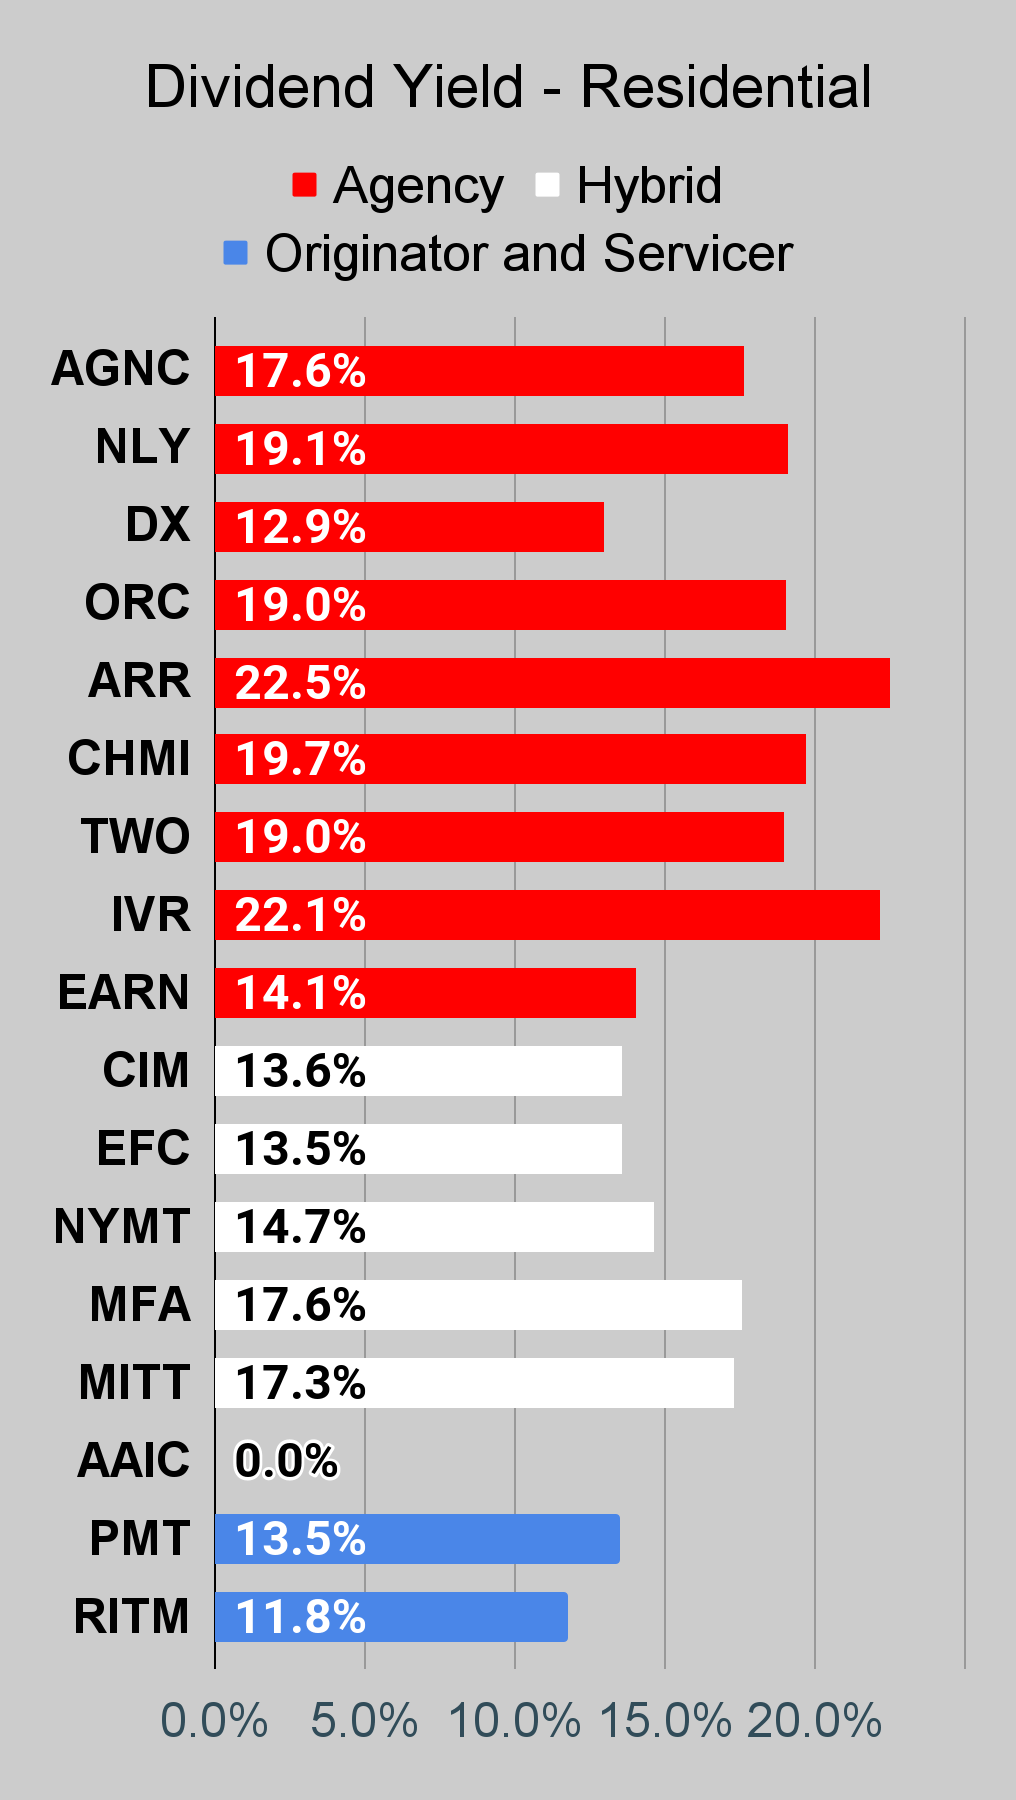
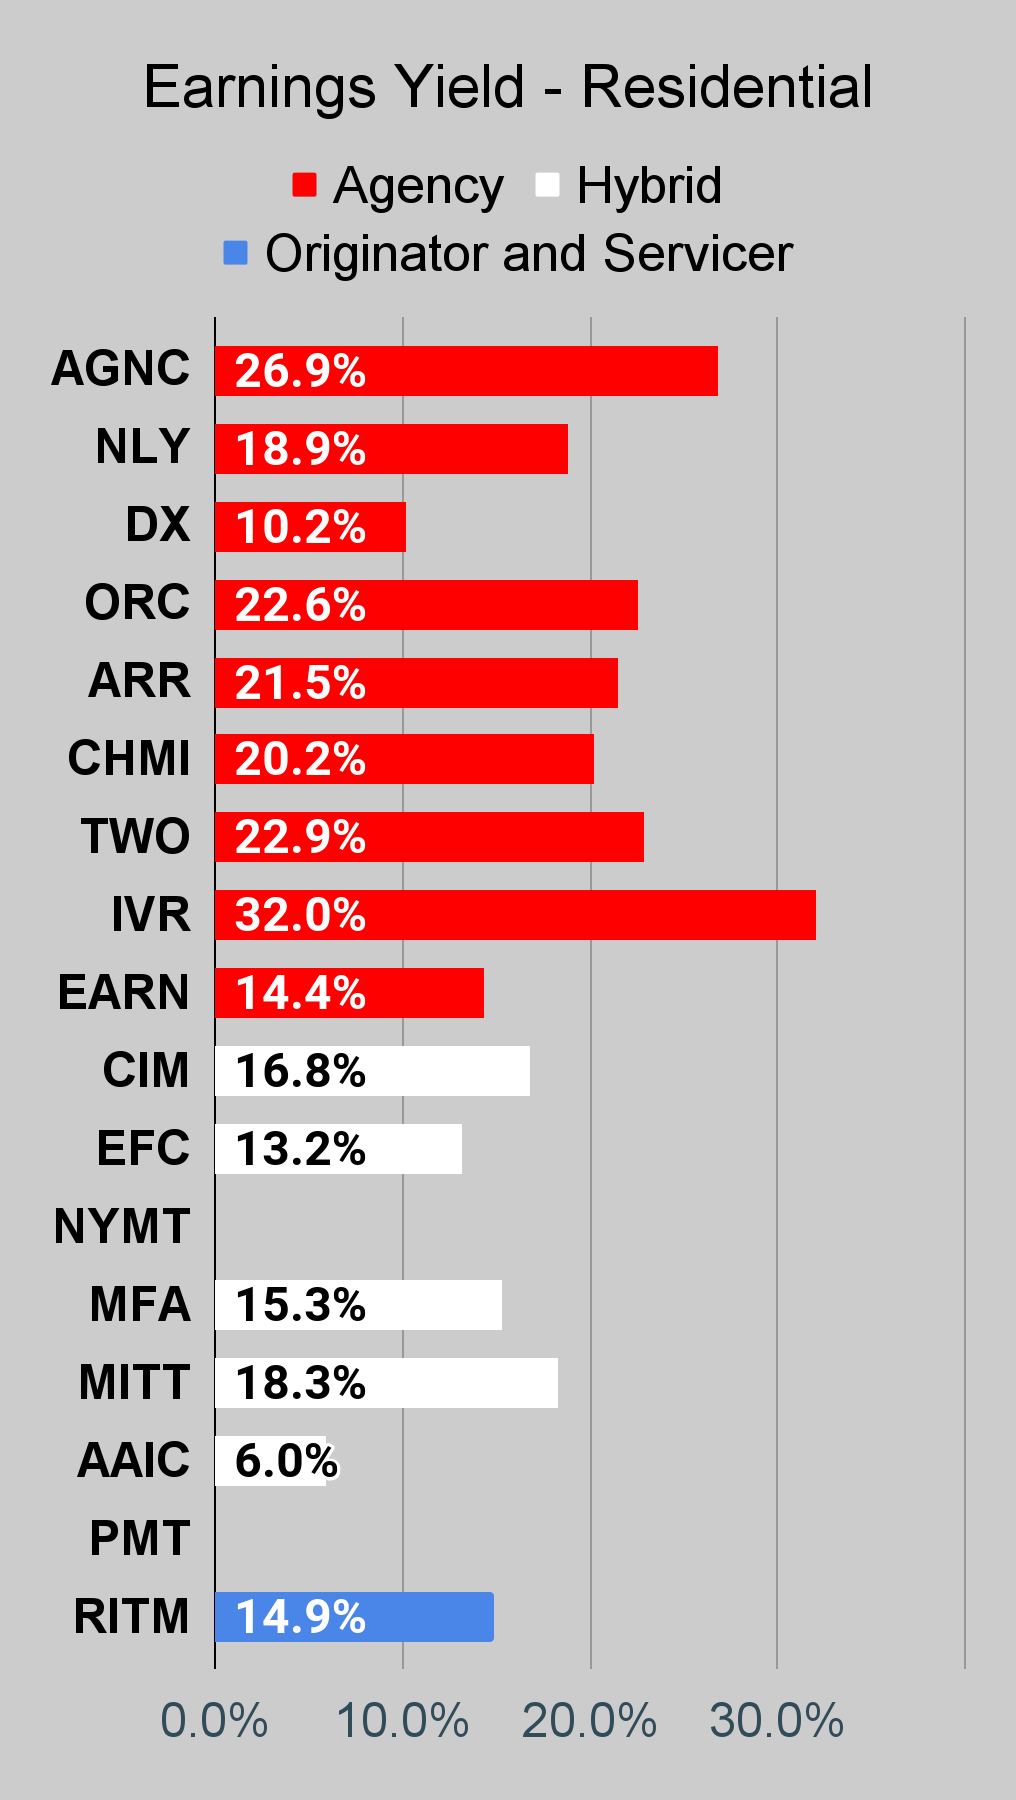
Residential Mortgage REIT Charts
Note: The chart for our public articles uses the book value per share from the latest earnings release. Current estimated book value per share is used in reaching our targets and trading decisions. It's available in our service, but those estimates are not included in the charts below. PMT and NYMT are not showing an earnings yield metric as neither REIT provides a quarterly “Core EPS” metric.
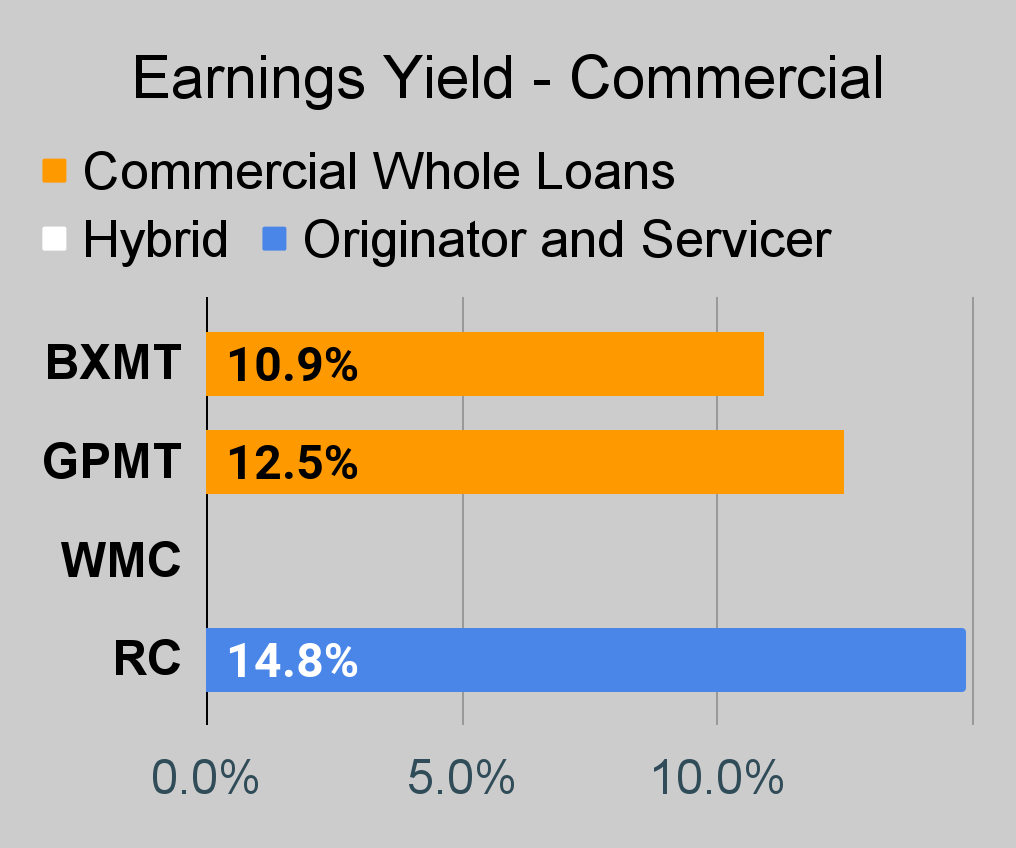
Commercial Mortgage REIT Charts
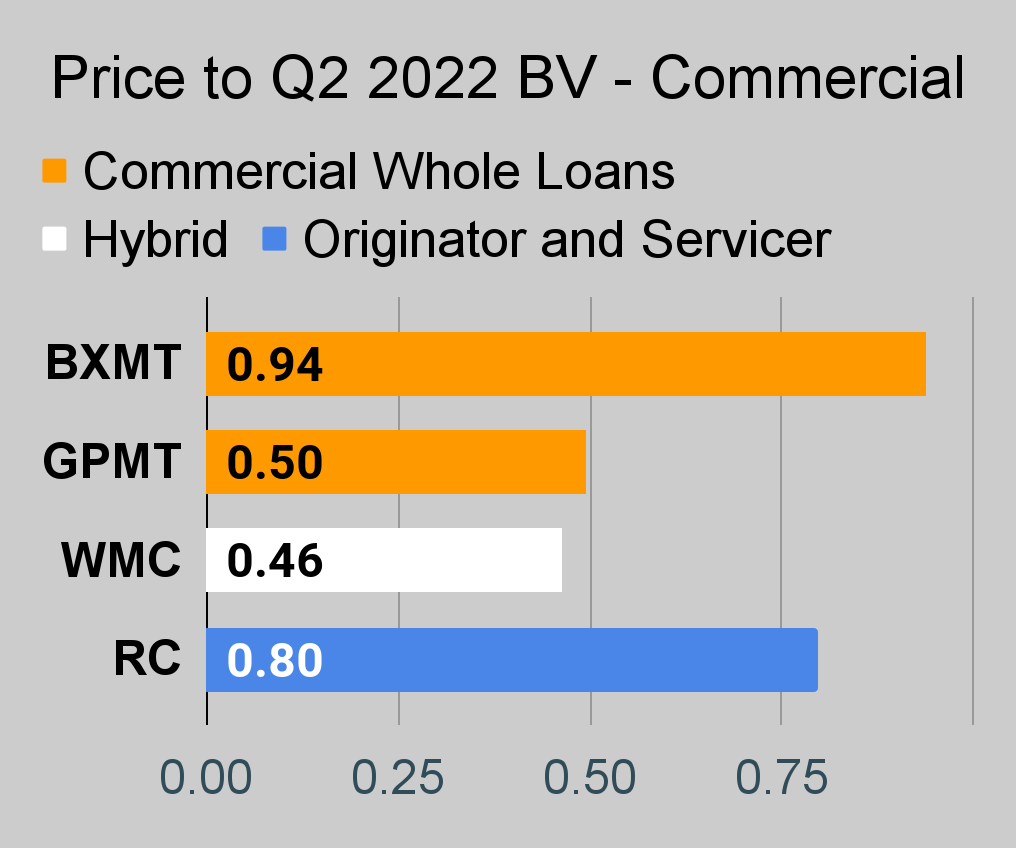
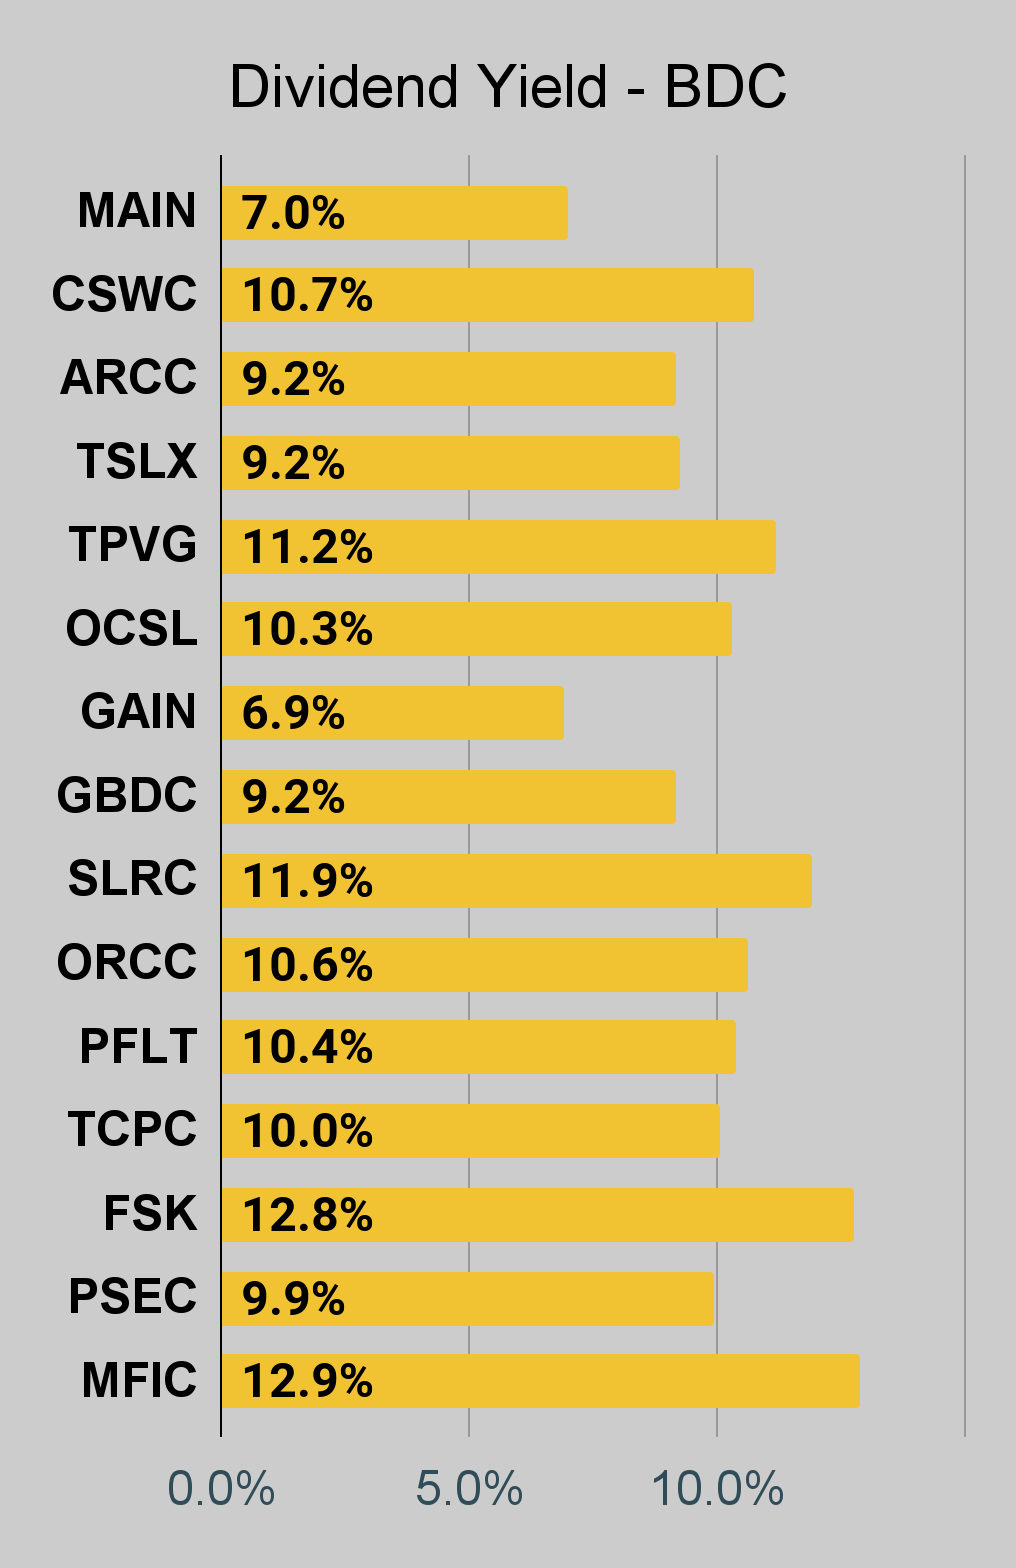
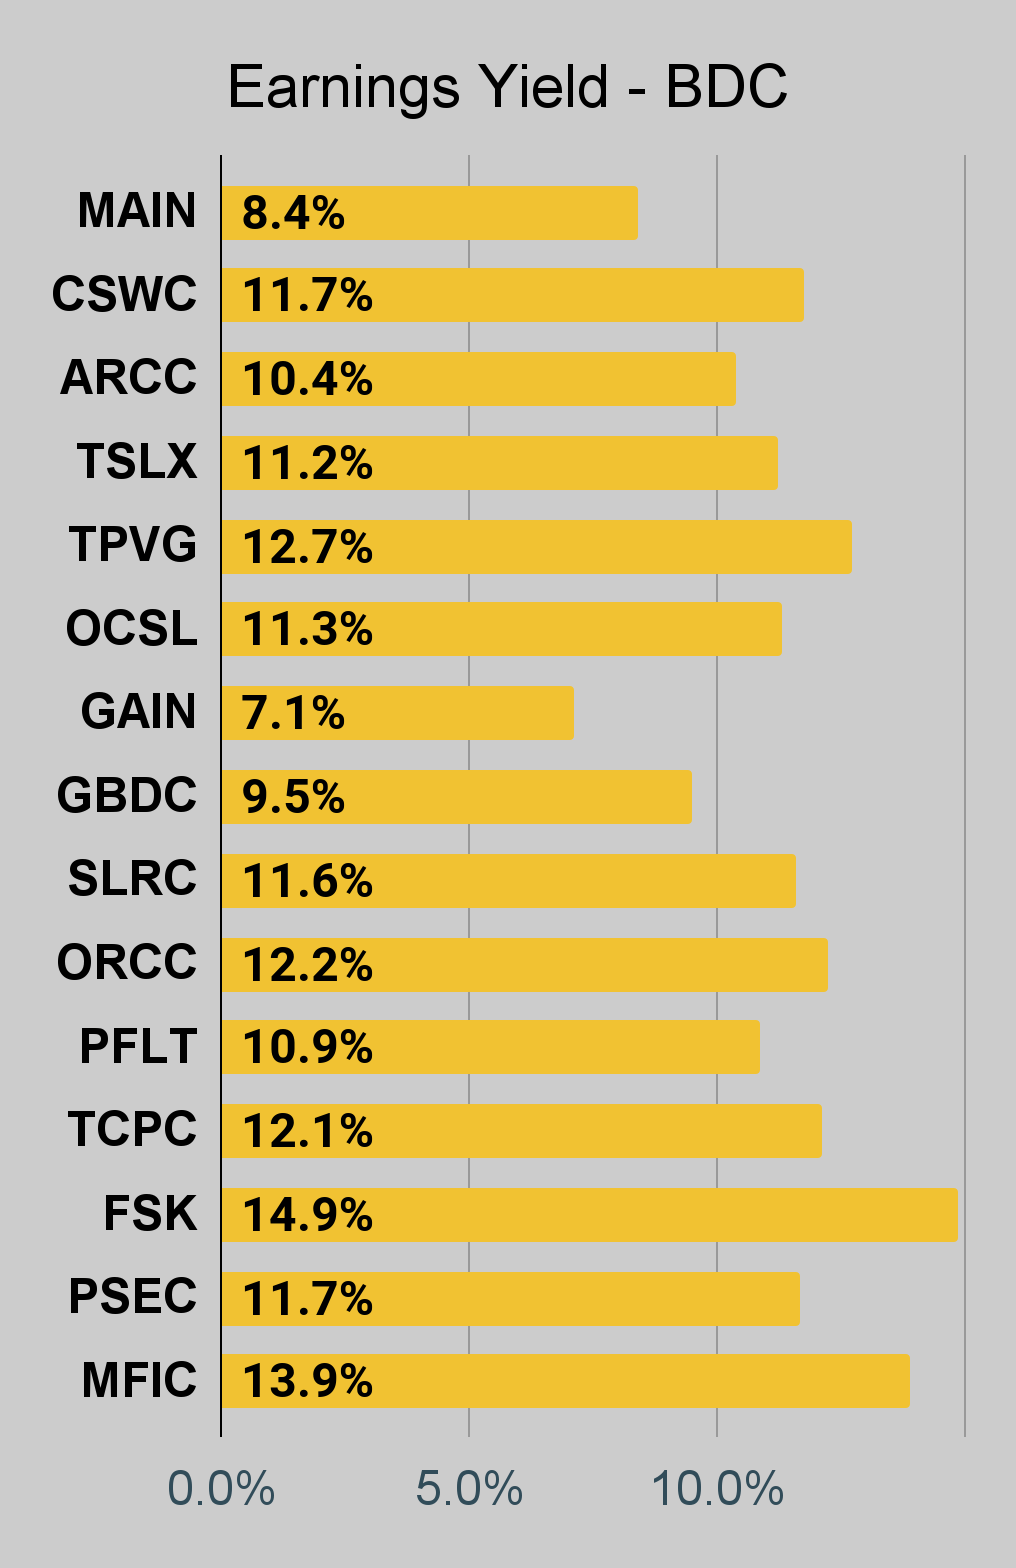
BDC Charts
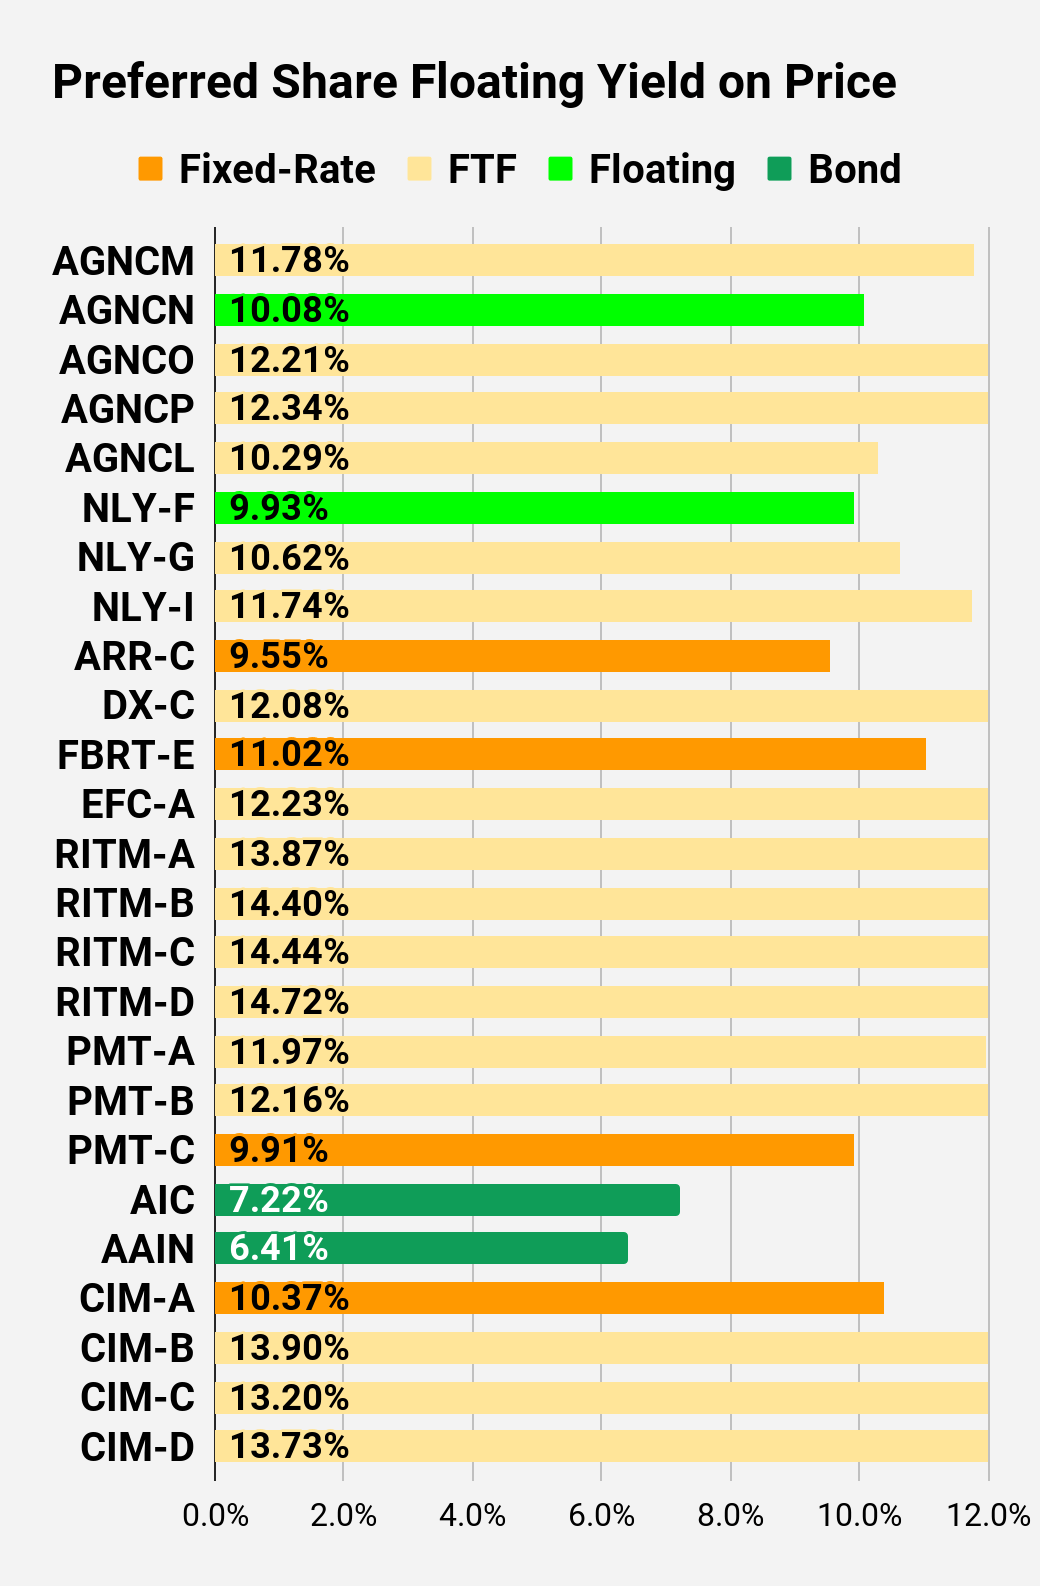
Preferred Share Charts
I changed the coloring a bit. We needed to adjust to include that the first fixed-to-floating shares have transitioned over to floating rates. When a share is already floating, the stripped yield may be different than the “Floating Yield on Price” due to changes in interest rates. For instance, NLY-F already has a floating rate. However, the rate is only reset once per three months. The stripped yield is calculated using the upcoming projected dividend payment and the “Floating Yield on Price” is based on where the dividend would be if the rate reset today. In my opinion, for these shares the “Floating Yield on Price” is clearly the more important metric.
Preferred Share Data
Beyond the charts, we’re also providing our readers with access to several other metrics for the preferred shares.
After testing out a series on preferred shares, we decided to try merging it into the series on common shares. After all, we are still talking about positions in mortgage REITs. We don’t have any desire to cover preferred shares without cumulative dividends, so any preferred shares you see in our column will have cumulative dividends. You can verify that by using Quantum Online. We’ve included the links in the table below.
To better organize the table, we needed to abbreviate column names as follows:
- Price = Recent Share Price - Shown in Charts
- BoF = Bond or FTF (Fixed-to-Floating)
- S-Yield = Stripped Yield - Shown in Charts
- Coupon = Initial Fixed-Rate Coupon
- FYoP = Floating Yield on Price - Shown in Charts
- NCD = Next Call Date (the soonest shares could be called)
- Note: For all FTF issues, the floating rate would start on NCD.
- WCC = Worst Cash to Call (lowest net cash return possible from a call)
- QO Link = Link to Quantum Online Page
| Ticker |
| Price |
| BoF |
| S-Yield |
| Coupon |
| FYoP |
| NCD |
| WCC |
| QO Link |
| P-Link |
| $18.70 |
| FTF |
| 9.26% |
| 6.88% |
| 11.78% |
| 4/15/2024 |
| $8.89 |
| $23.80 |
| Floating |
| 9.73% |
| 9.19% |
| 10.08% |
| 11/27/2022 |
| $1.48 |
| $19.40 |
| FTF |
| 8.43% |
| 6.50% |
| 12.21% |
| 10/15/2024 |
| $8.86 |
| $18.58 |
| FTF |
| 8.30% |
| 6.13% |
| 12.34% |
| 4/15/2025 |
| $10.26 |
| $21.15 |
| FTF |
| 9.30% |
| 7.75% |
| 10.29% |
| 10/15/2027 |
| $13.71 |
| $24.04 |
| Floating |
| 9.22% |
| 8.73% |
| 9.93% |
| 11/27/2022 |
| $1.31 |
| $20.47 |
| FTF |
| 8.04% |
| 6.50% |
| 10.62% |
| 3/31/2023 |
| $5.34 |
| $20.30 |
| FTF |
| 8.43% |
| 6.75% |
| 11.74% |
| 6/30/2024 |
| $7.66 |
| $18.40 |
| 9.55% |
| 7.00% |
| 9.55% |
| 1/28/2025 |
| $10.55 |
| $20.58 |
| FTF |
| 8.44% |
| 6.90% |
| 12.08% |
| 4/15/2025 |
| $8.73 |
| $17.16 |
| 11.02% |
| 7.50% |
| 11.02% |
| 11/27/2022 |
| $8.06 |
| $19.78 |
| FTF |
| 8.59% |
| 6.75% |
| 12.23% |
| 10/30/2024 |
| $8.67 |
| $18.49 |
| FTF |
| 10.18% |
| 7.50% |
| 13.87% |
| 8/15/2024 |
| $9.80 |
| $17.52 |
| FTF |
| 10.21% |
| 7.13% |
| 14.40% |
| 8/15/2024 |
| $10.61 |
| $16.31 |
| FTF |
| 9.81% |
| 6.38% |
| 14.44% |
| 2/15/2025 |
| $12.29 |
| $17.75 |
| FTF |
| 9.90% |
| 7.00% |
| 14.72% |
| 11/15/2026 |
| $14.26 |
| $21.73 |
| FTF |
| 9.49% |
| 8.13% |
| 11.97% |
| 3/15/2024 |
| $6.32 |
| $21.71 |
| FTF |
| 9.35% |
| 8.00% |
| 12.16% |
| 6/15/2024 |
| $6.79 |
| $17.30 |
| 9.91% |
| 6.75% |
| 9.91% |
| 8/24/2026 |
| $14.36 |
| $23.65 |
| Bond |
| 7.22% |
| 6.75% |
| 7.22% |
| 11/27/2022 |
| $1.68 |
| $23.45 |
| Bond |
| 6.41% |
| 6.00% |
| 6.41% |
| 8/1/2023 |
| $2.67 |
| $19.60 |
| 10.37% |
| 8.00% |
| 10.37% |
| 11/27/2022 |
| $5.80 |
| $18.68 |
| FTF |
| 10.89% |
| 8.00% |
| 13.90% |
| 3/30/2024 |
| $9.40 |
| $17.66 |
| FTF |
| 11.17% |
| 7.75% |
| 13.20% |
| 9/30/2025 |
| $13.24 |
| $18.16 |
| FTF |
| 11.21% |
| 8.00% |
| 13.73% |
| 03/30/2024 |
| $9.92 |
Second Batch:
| Ticker |
| Price |
| BoF |
| S-Yield |
| Coupon |
| FYoP |
| NCD |
| WCC |
| QO Link |
| P-Link |
| $18.50 |
| FTF |
| 11.04% |
| 8.13% |
| 13.69% |
| 04/27/2027 |
| $15.64 |
| $17.93 |
| FTF |
| 10.69% |
| 7.63% |
| 13.69% |
| 07/27/2027 |
| $16.12 |
| $18.04 |
| FTF |
| 10.10% |
| 7.25% |
| 13.12% |
| 1/27/2025 |
| $11.04 |
| $18.12 |
| 10.52% |
| 7.50% |
| 10.52% |
| 11/27/2022 |
| $7.18 |
| $17.79 |
| FTF |
| 9.27% |
| 6.50% |
| 13.91% |
| 3/31/2025 |
| $11.28 |
| $19.67 |
| FTF |
| 8.96% |
| 7.00% |
| 13.11% |
| 11/30/2026 |
| $12.54 |
| $18.85 |
| 10.97% |
| 8.20% |
| 10.97% |
| 11/27/2022 |
| $6.31 |
| $17.87 |
| FTF |
| 11.65% |
| 8.25% |
| 14.19% |
| 4/15/2024 |
| $10.15 |
| $19.18 |
| FTF |
| 10.27% |
| 7.75% |
| 12.71% |
| 12/27/2024 |
| $10.21 |
| $17.77 |
| FTF |
| 10.73% |
| 7.50% |
| 13.88% |
| 9/27/2027 |
| $16.63 |
| $18.18 |
| FTF |
| 10.92% |
| 7.88% |
| 15.04% |
| 1/15/2025 |
| $11.25 |
| $17.83 |
| FTF |
| 11.32% |
| 8.00% |
| 14.30% |
| 10/15/2027 |
| $17.17 |
| $17.18 |
| FTF |
| 10.09% |
| 6.88% |
| 15.47% |
| 10/15/2026 |
| $14.70 |
| $15.91 |
| 11.10% |
| 7.00% |
| 11.10% |
| 1/15/2027 |
| $16.53 |
| $16.35 |
| 10.84% |
| 7.00% |
| 10.84% |
| 11/27/2022 |
| $8.86 |
| $19.74 |
| FTF |
| 10.58% |
| 8.25% |
| 12.93% |
| 3/30/2024 |
| $8.27 |
| $17.08 |
| 12.32% |
| 8.25% |
| 12.32% |
| 11/27/2022 |
| $8.28 |
| $15.26 |
| 13.39% |
| 8.00% |
| 13.39% |
| 11/27/2022 |
| $10.09 |
| $15.56 |
| FTF |
| 13.13% |
| 8.00% |
| 17.87% |
| 9/17/2024 |
| $13.41 |
| $20.79 |
| FTF |
| 10.46% |
| 8.63% |
| 12.54% |
| 7/30/2024 |
| $7.98 |
| $18.99 |
| 10.45% |
| 7.88% |
| 10.45% |
| 5/21/2026 |
| $13.02 |
Strategy
Our goal is to maximize total returns . We achieve those most effectively by including “trading” strategies. We regularly trade positions in the mortgage REIT common shares and BDCs because:
- Prices are inefficient.
- Long term, share prices generally revolve around book value.
- Short term, price-to-book ratios can deviate materially.
- Book value isn’t the only step in analysis, but it is the cornerstone.
We also allocate to preferred shares and equity REITs. We encourage buy-and-hold investors to consider using more preferred shares and equity REITs.
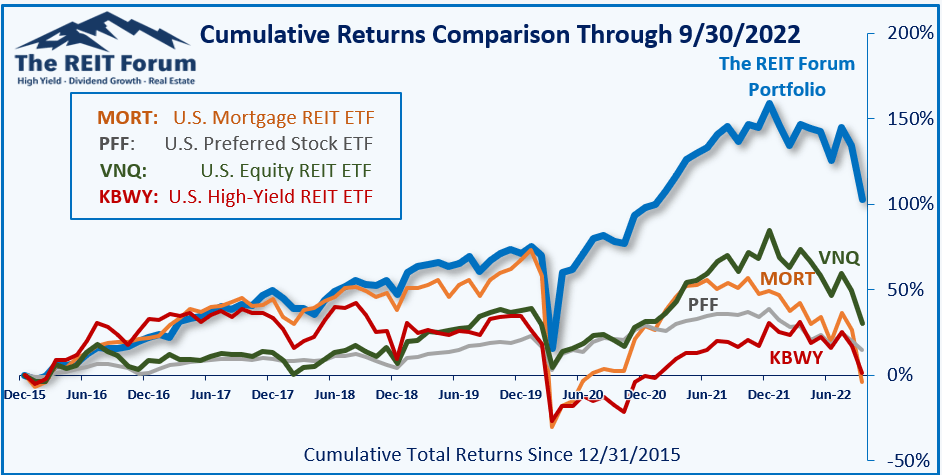
Performance
We compare our performance against 4 ETFs that investors might use for exposure to our sectors:
The REIT Forum
The 4 ETFs we use for comparison are:
| Ticker |
| Exposure |
| One of the largest mortgage REIT ETFs |
| One of the largest preferred share ETFs |
| Largest equity REIT ETF |
| The high-yield equity REIT ETF. Yes, it has been dreadful. |
When investors think it isn’t possible to earn solid returns in preferred shares or mortgage REITs, we politely disagree. The sector has plenty of opportunities, but investors still need to be wary of the risks. We can’t simply reach for yield and hope for the best. When it comes to common shares, we need to be even more vigilant to protect our principal by regularly watching prices and updating estimates for book value and price targets.
Ratings:
Bullish view on NLY-I and expect it to dramatically outperform NLY-F.
Bearish view on CHMI and ARR.
I don't own shares of NLY-I yet, but I may open a position depending on the prices available in the market and the value of other shares we could swap for NLY-I.
For further details see:
12% Dividend Yield And 22% Upside