FBRT - 2 Big 13% Dividend Yields On Sale
Summary
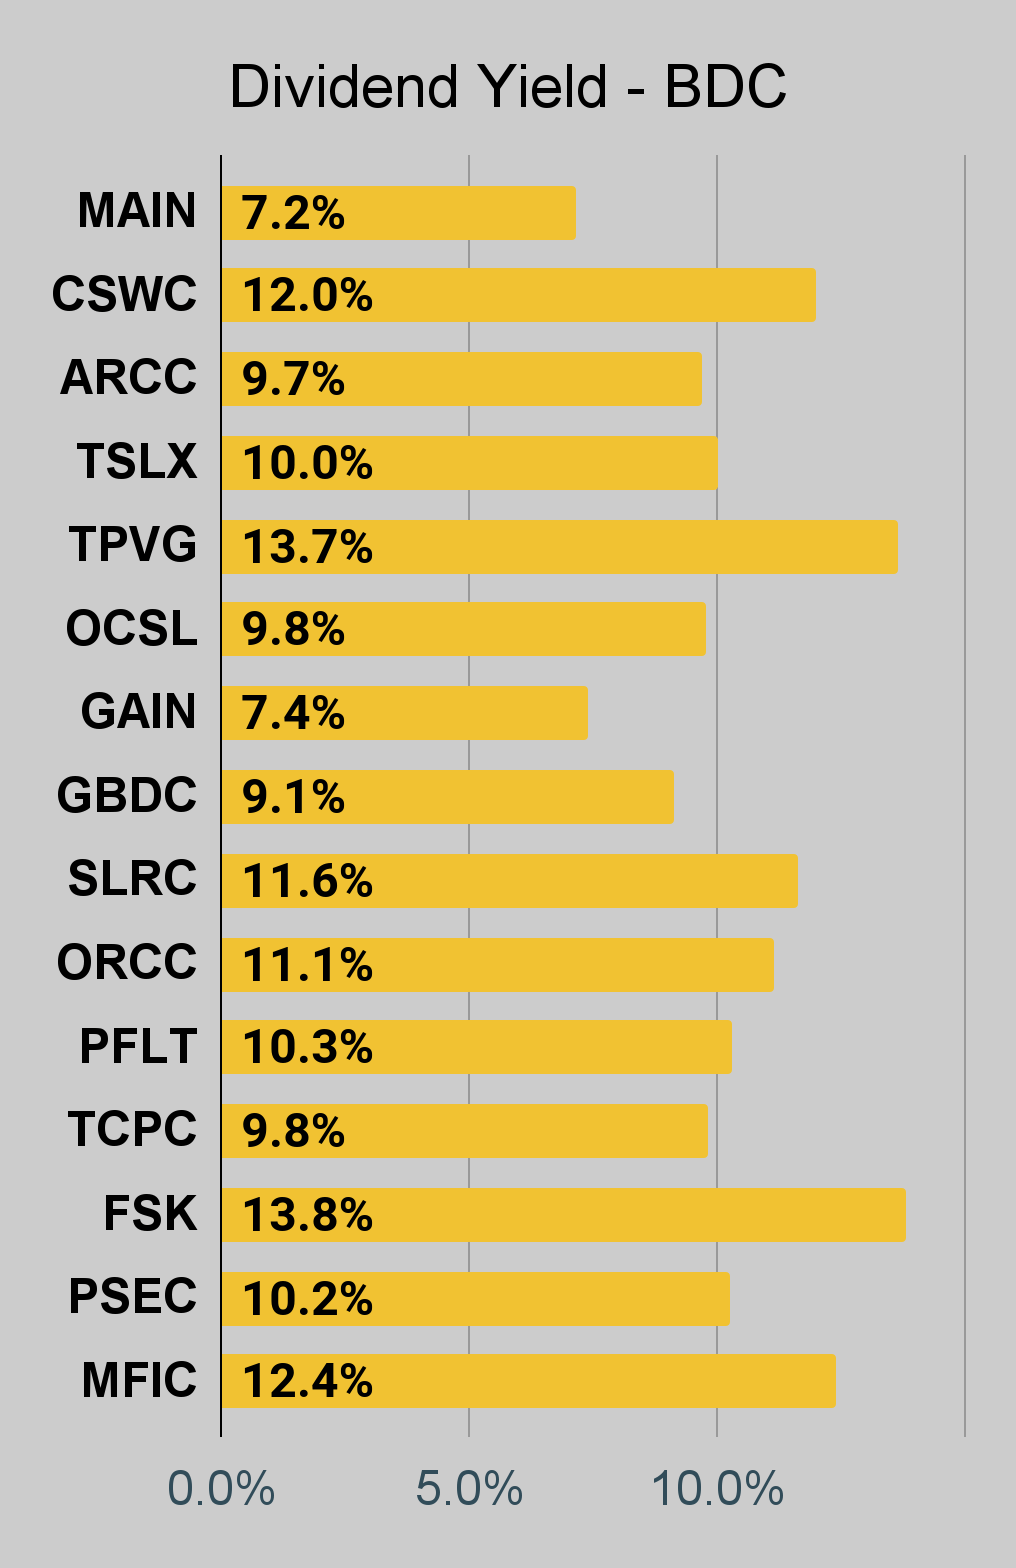
- We're highlighting two shares with yields over 13%.
- Each share trades at a discount to their net asset value and a discount to their usual price-to-NAV ratio.
- I already own one of these shares and Scott owns both.
Get ready for charts, images, and tables because they are better than words. The ratings and outlooks we highlight here come after Scott Kennedy’s weekly updates in the REIT Forum. Your continued feedback is greatly appreciated, so please leave a comment with suggestions.
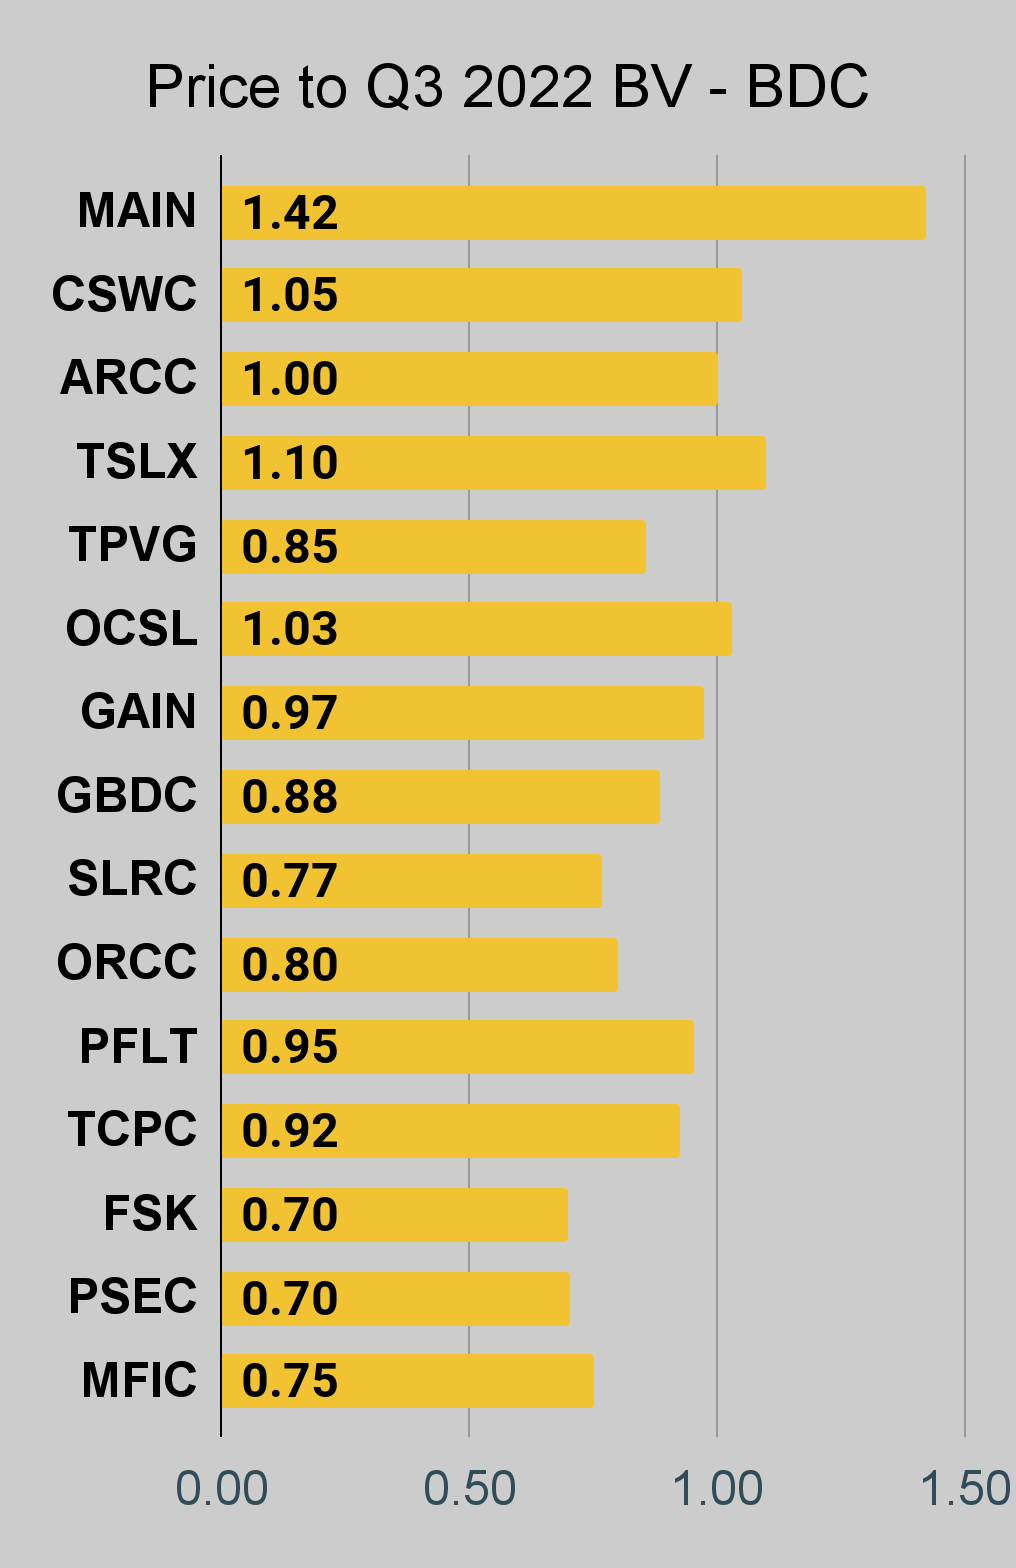
Often this series has more mortgage REITs and preferred shares than BDCs. There has been quite a bit of weakness in the BDC’s since late November, leading to more opportunities. We want to highlight some of those opportunities. There are several other BDCs that are also in our bullish range, but I’m picking two for the public article. We will be using BV (book value) and NAV (Net Asset Value) interchangeably since we’re not dealing with equity REITs. Typically, we use BV for mortgage REITs and NAV for BDCs, but we’re referring to the same value.
TriplePoint Venture Growth
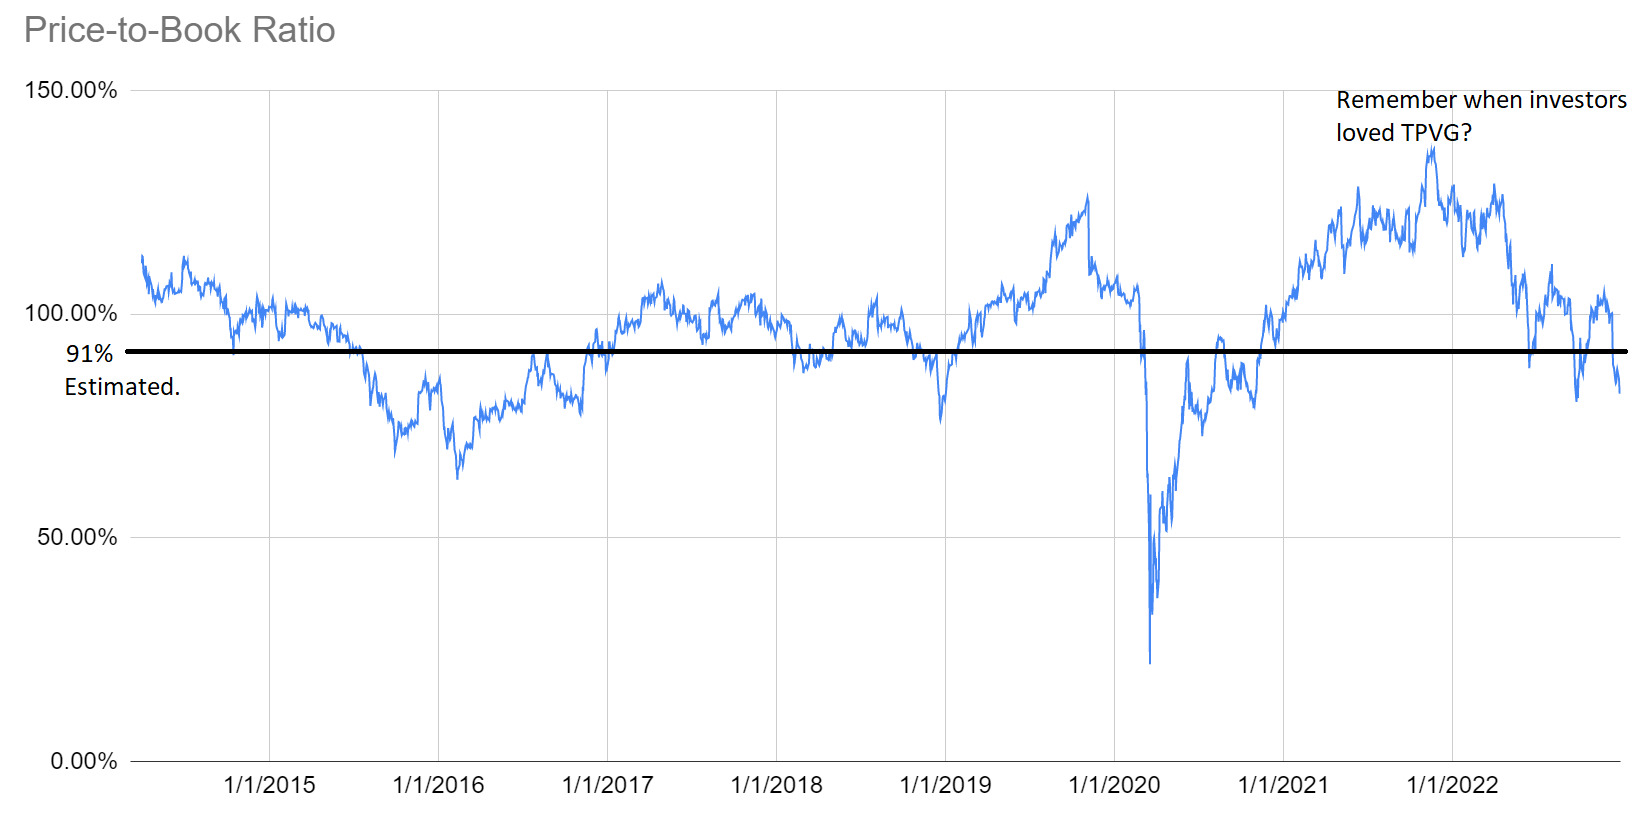
TriplePoint Venture Growth ( TPVG ) had a horrific fourth quarter. Negative news about one of their investments signals a headwind for the BDC, but the share price severely overreacted and drove TPVG into our bullish range. Since Thanksgiving, TPVG was simply crushed. The decline for TPVG was materially larger than for any of the other BDCs we cover. Historically, TPVG averaged a price-to-trailing book value ratio of 97.7%. The ratio for price to book value from Q3 2022 is currently 82.2%. We’re expecting a material drop in book value for TPVG. It ended Q3 2022 at $12.69, but we expect it to be in the high $11s or low $12 range. If we’re right, then the ratio would be around 91% today. I put together a chart price-to-trailing book value for TPVG going back several years and added a line for about 91%:
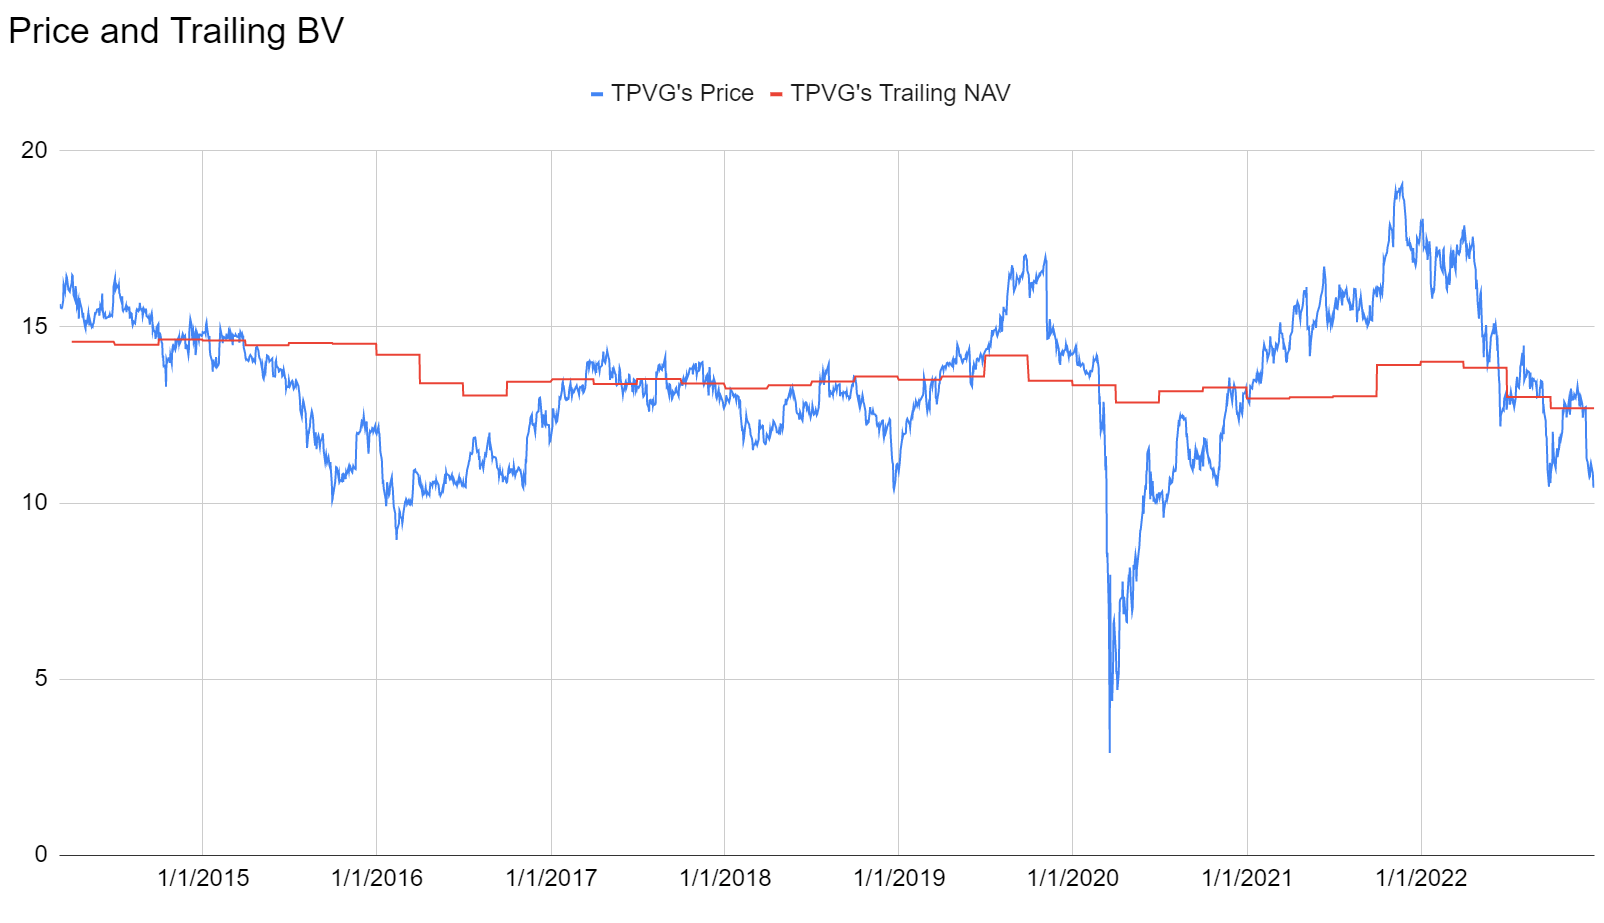
Even if TPVG’s book value dropped during Q3, the resulting price-to-book ratio would still be unusually low compared to their ratios over the last few years. In 2021 and early 2022 investors loved the BDC. We see the potential for TPVG’s valuation to improve. Over the years, TPVG’s book value has been relatively steady. Aside from a few hiccups this year, book value hardly declined since 2014 despite paying out a large dividend:
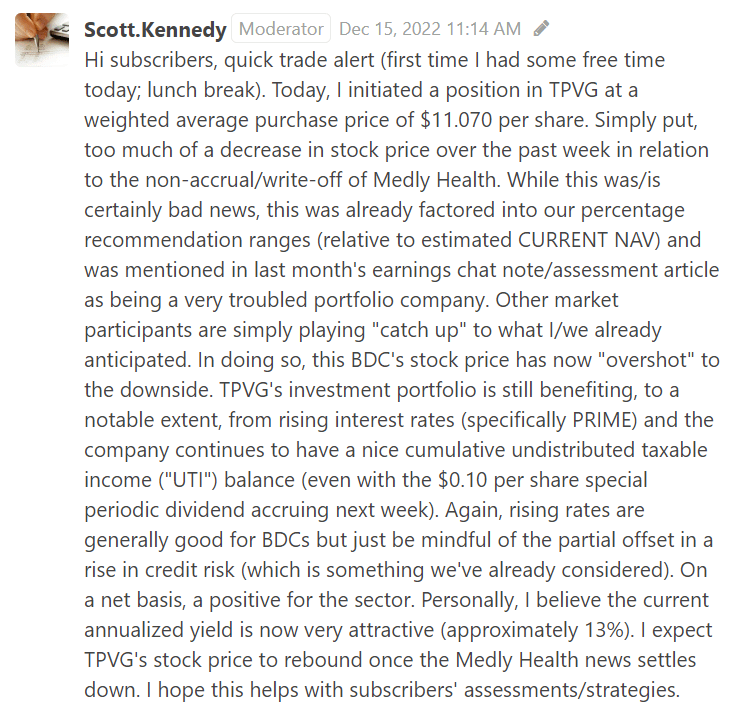
The issue with one of their tenants was something we knew about in advance and was factored into our targets in advance. After TPVG got hammered, Scott Kennedy wrote:
Seeing Scott’s investment in TPVG, I followed suit a few days later and initiated a position at $10.5933 per share.
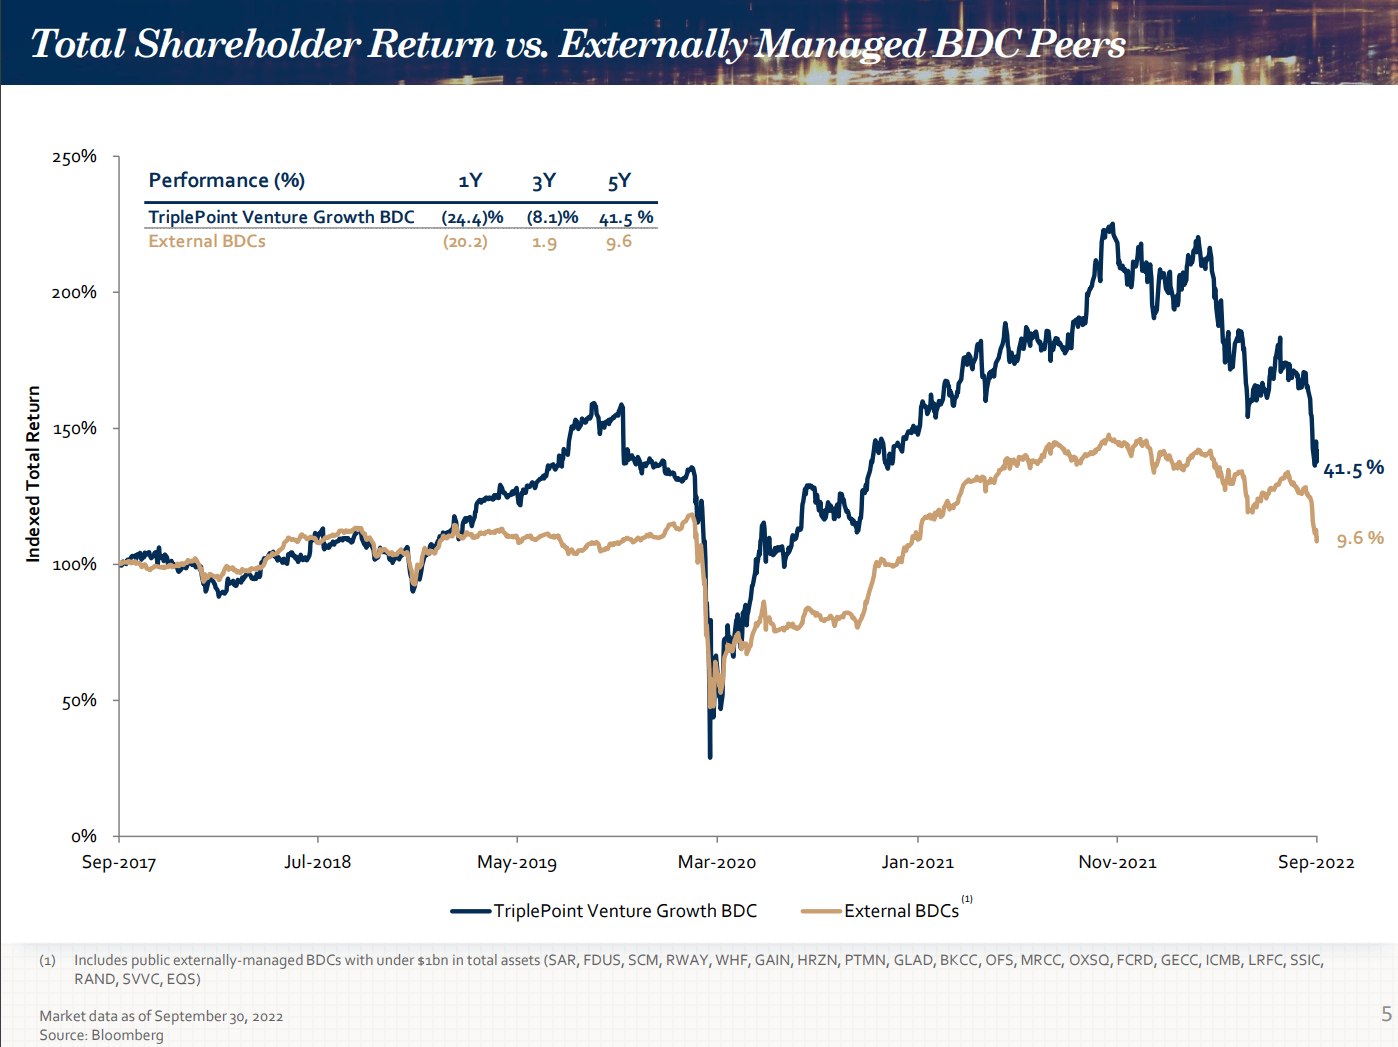
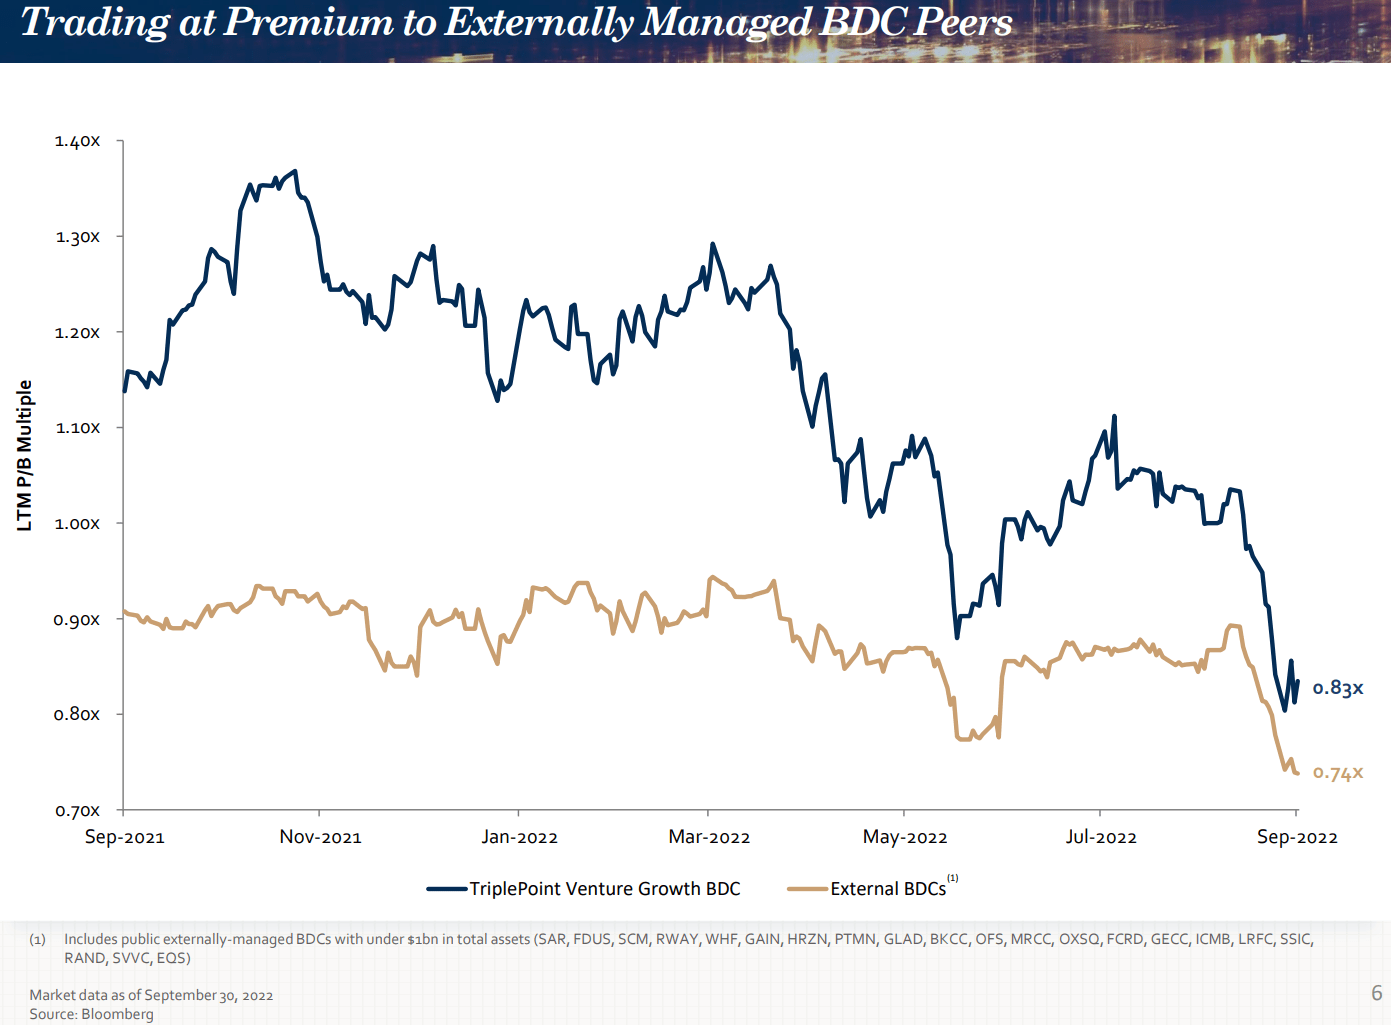
Prior to TPVG’s plunge in late November and December, they had significantly outperformed the average for externally managed BDCs (their peer group):
Prior to the plunge, they were consistently achieving a higher average price-to-book ratio than peers.
One of the biggest problems with externally managed investments is the incentive to pump out shares even if the price is below net asset value. However, that hasn’t been an issue for TPVG:
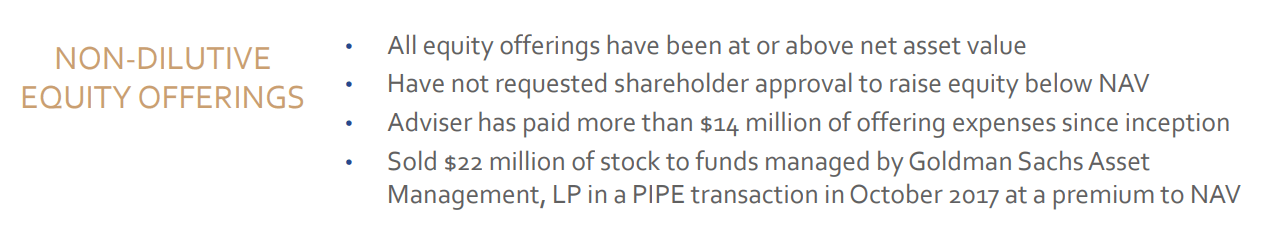
Consequently, I think it’s reasonable to believe TPVG will once again return to trading at a premium to book value. Not bad for a share carrying a dividend yield over 13%.
Franklin Square KKR Capital
FS KKR Capital ( FSK ) is another share that moved into sale territory. Shares have gone on sale a few times this year and so far they bounced back from each. Unlike TPVG, FSK doesn’t get to trade at a premium to book value:
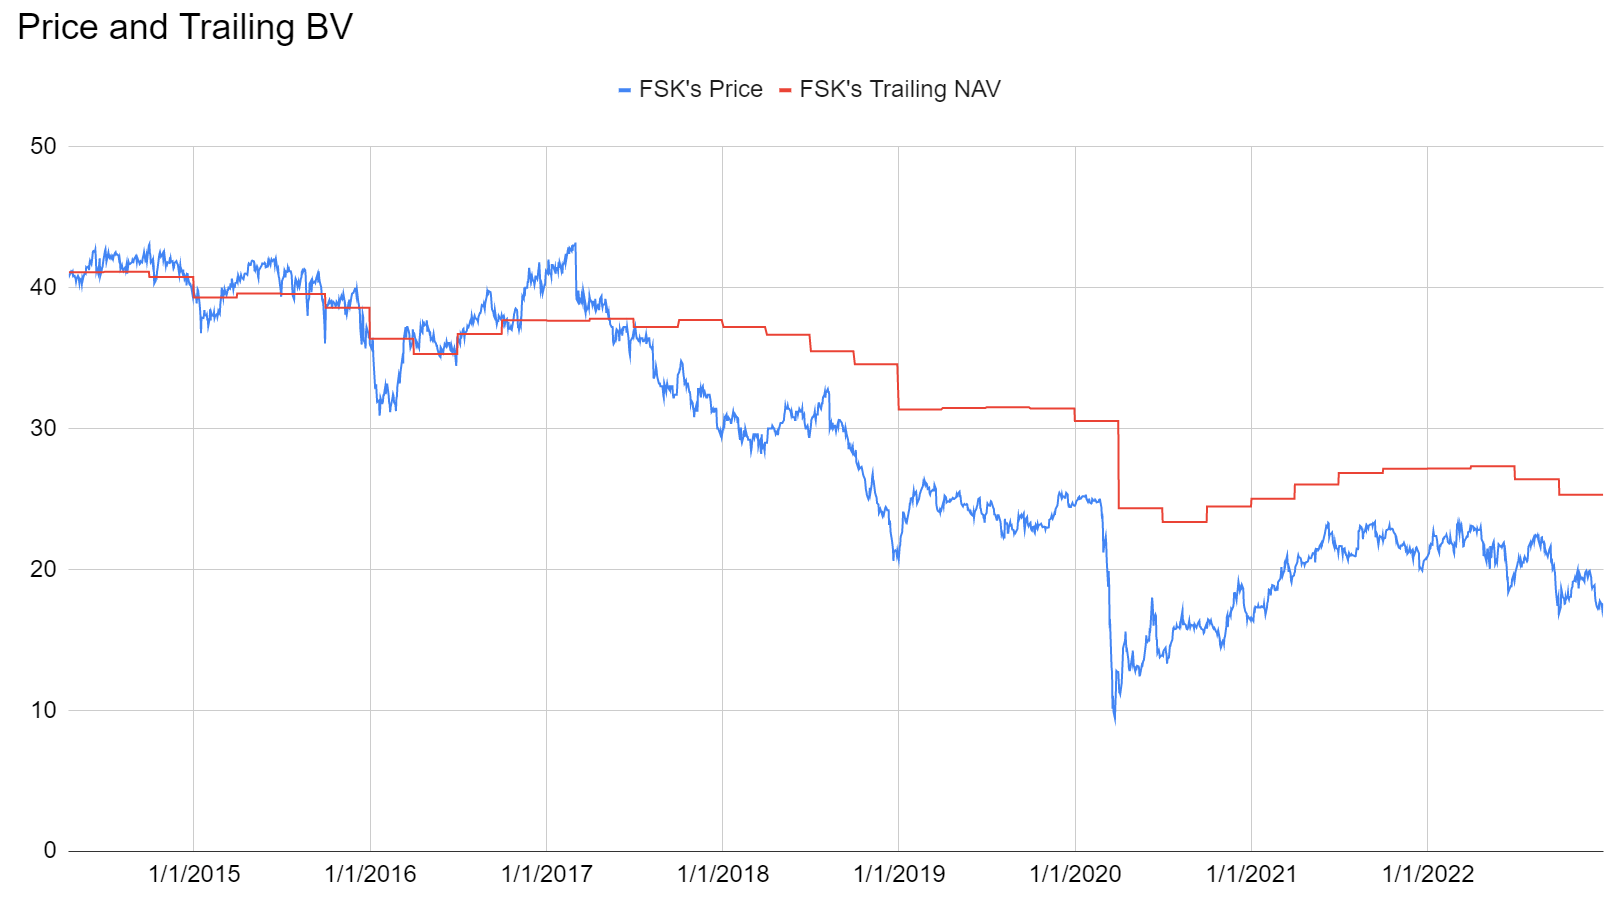
Shares are consistently trading at a discount to book value. It’s been many years since they were above book value. That one quarter with a big drop was Q1 2020. That was a rough quarter for many stocks. For mREITs and BDCs, the difficulty showed up more explicitly in the financial statements.
Outside of late 2018 and parts of 2020, we’ve hardly seen FSK drop below a .70 price-to-book ratio:
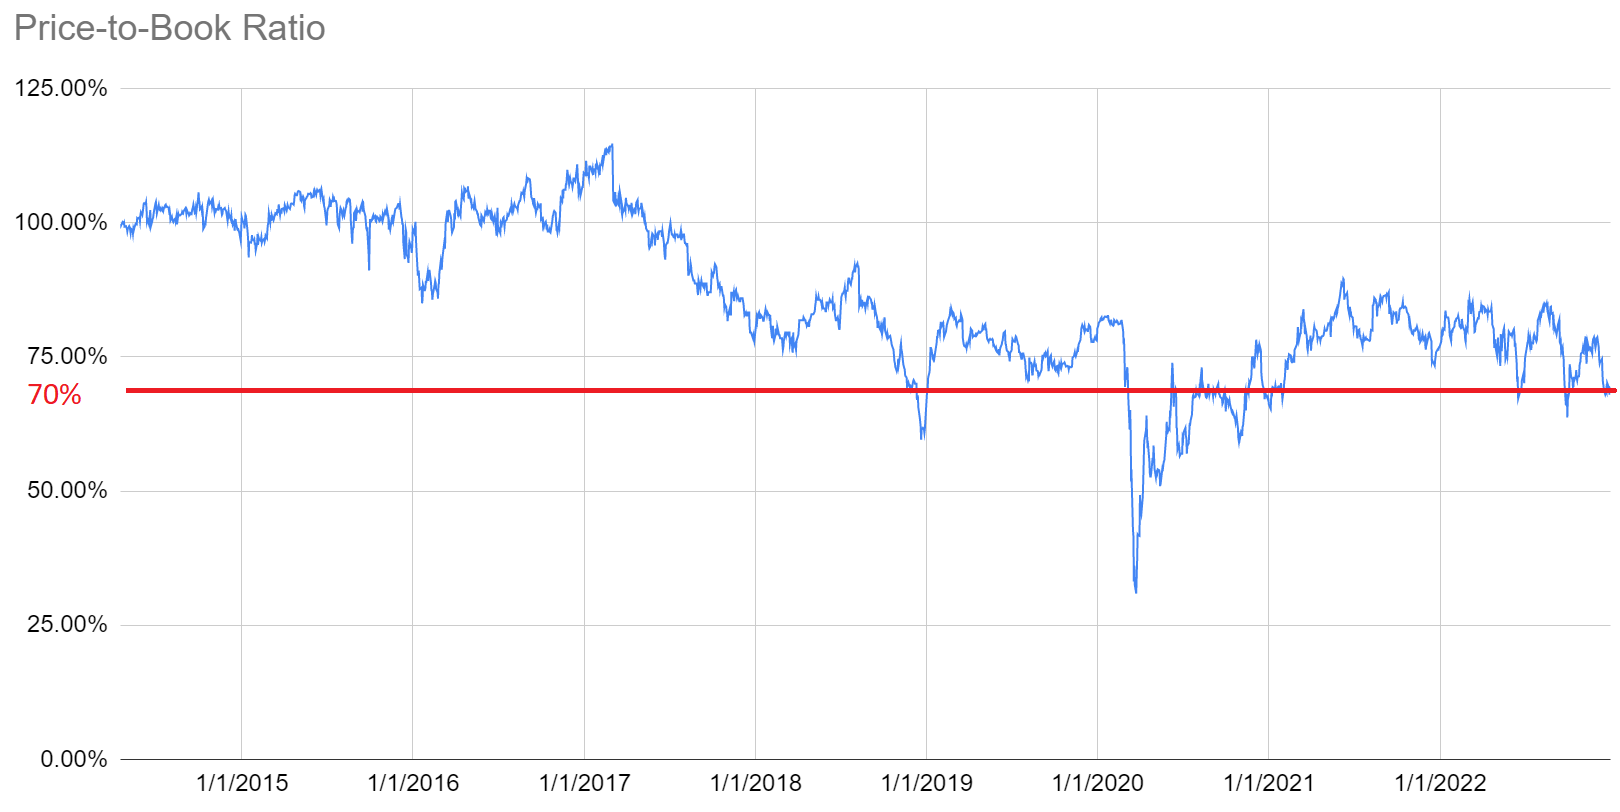
We’re expecting a pretty small adjustment to FSK’s book value for Q4 2022, so the impact to this chart would be tiny. That creates a pretty good risk/reward profile. A move higher is materially more likely than a move lower, which is pretty nice for shares that carry a dividend yield over 13%. It’s hard to be precise with BDC dividend yields due to the prevalence of small extra dividends. The 13% dividend yield calculation is before the additional dividends paid out last year.
While FSK’s valuation fell, their financials haven’t changed that much over the last year:
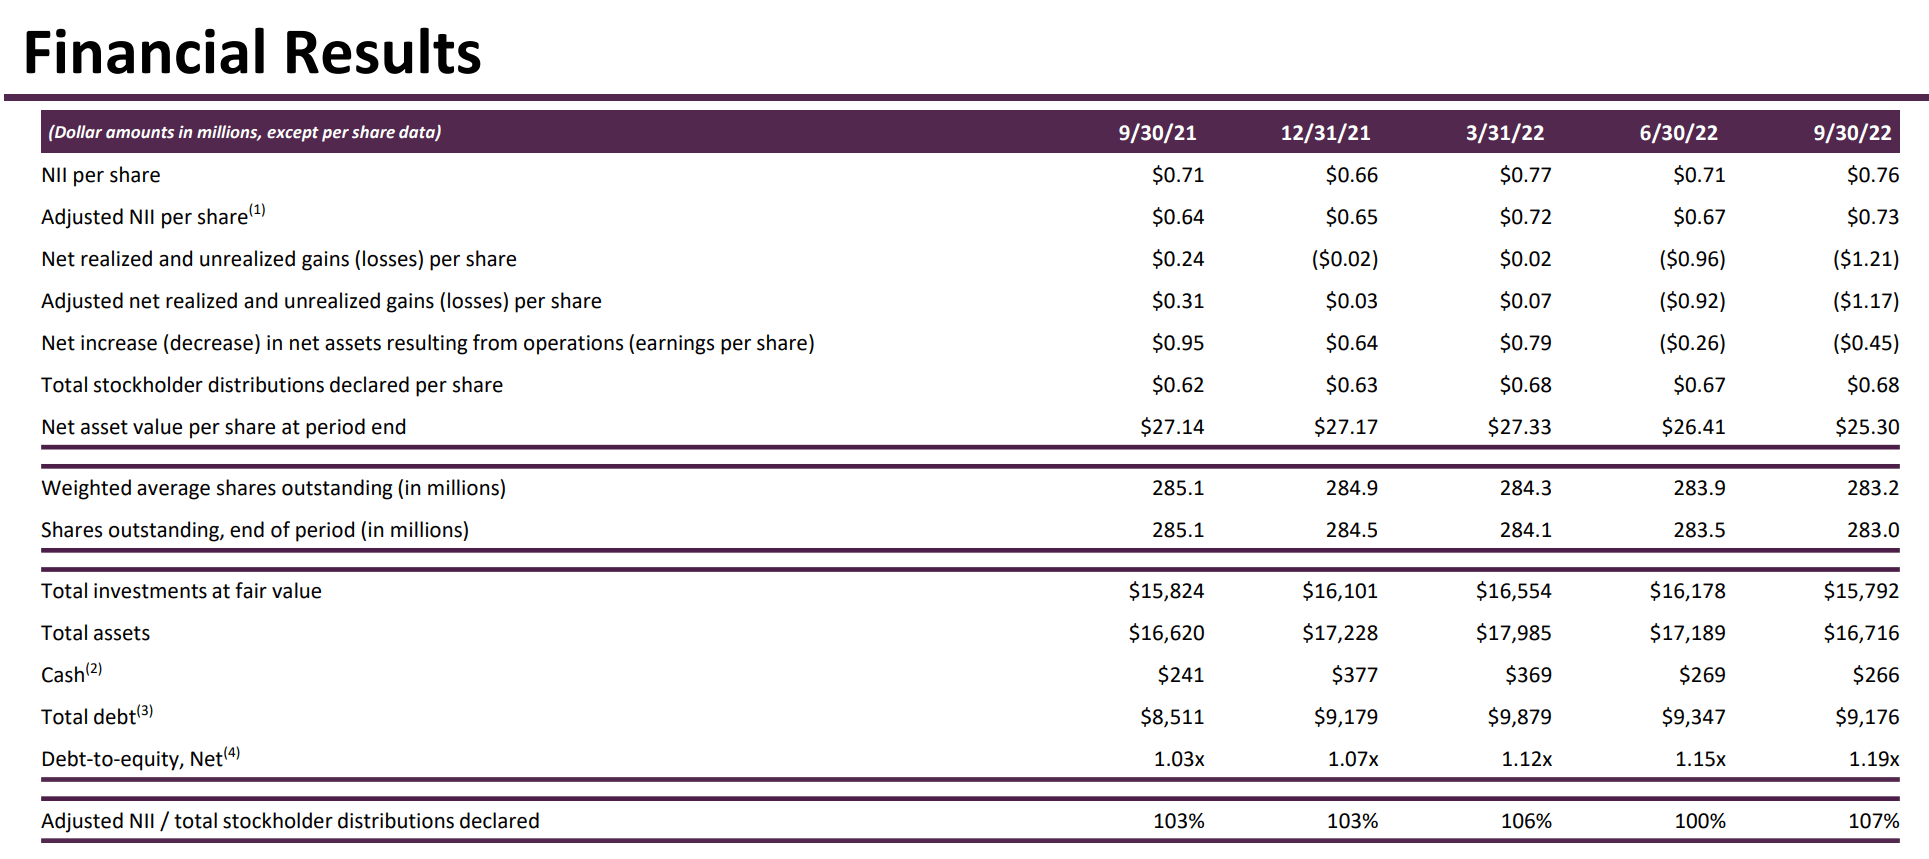
It’s also nice to see that shares outstanding decreased slightly over that period.
Most of their investments carry floating rates, which has been favorable for this environment:
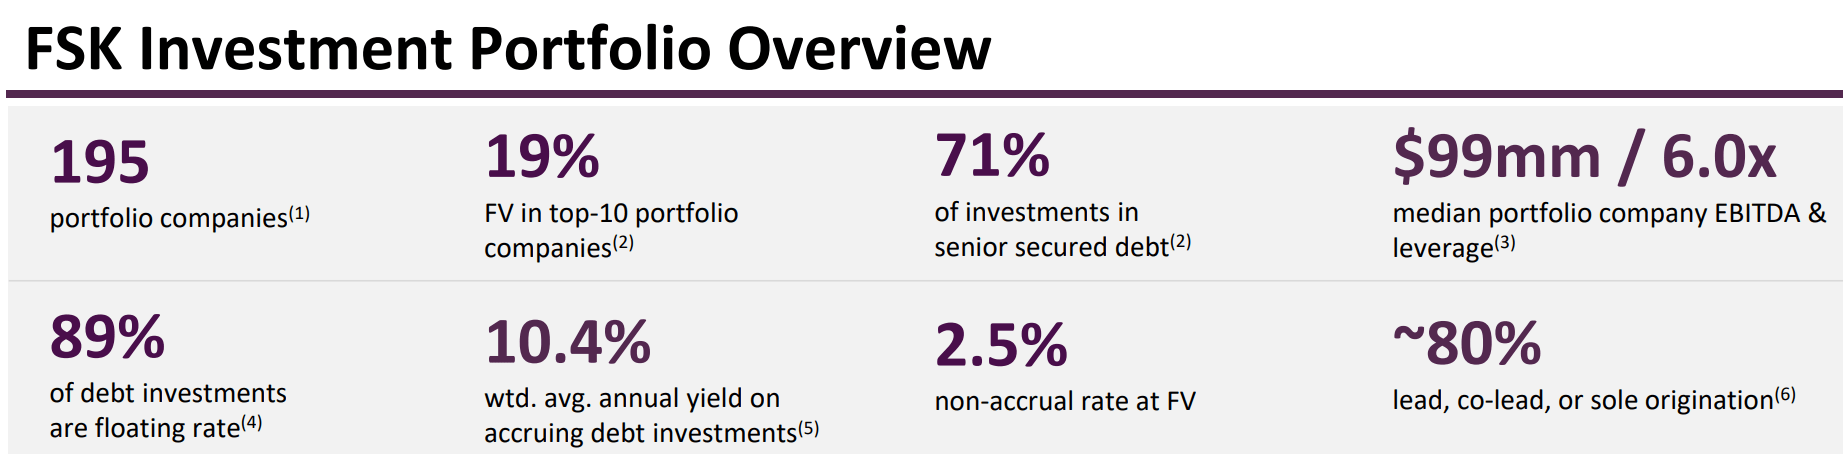
I currently don’t have a position in FSK, though I’ve invested in them before and may invest in them again. Our prior investment ran from 12/20/2021 to 3/16/2022 and delivered a 12.4% return.
Scott Kennedy leads our research for the BDCs and the common shares of the mortgage REITs. Scott currently owns a position in FSK.
Preferred Shares
Last night I wrote a huge update on preferred share opportunities for members. I plan to share part of that article publicly soon.
In brief, I'll highlight that we also have several bullish ratings on preferred shares yielding 8% to 12%. Further, there's a dramatic difference in valuation between some very similar shares. The market is simply mispricing shares relative to each other, which has been excellent for investors willing to swap back and forth between positions.
We're running a promotion for new members. We'll be donating to a dog rescue for every annual member who joins The REIT Forum .
Stock Table
We will close out the rest of the article with the tables and charts we provide for readers to help them track the sector for both common shares and preferred shares.
We’re including a quick table for the common shares that will be shown in our tables:
| Type of REIT or BDC |
| Residential Agency |
| Residential Hybrid |
| Residential Originator and Servicer |
| Commercial |
| BDC |
Let the images begin!
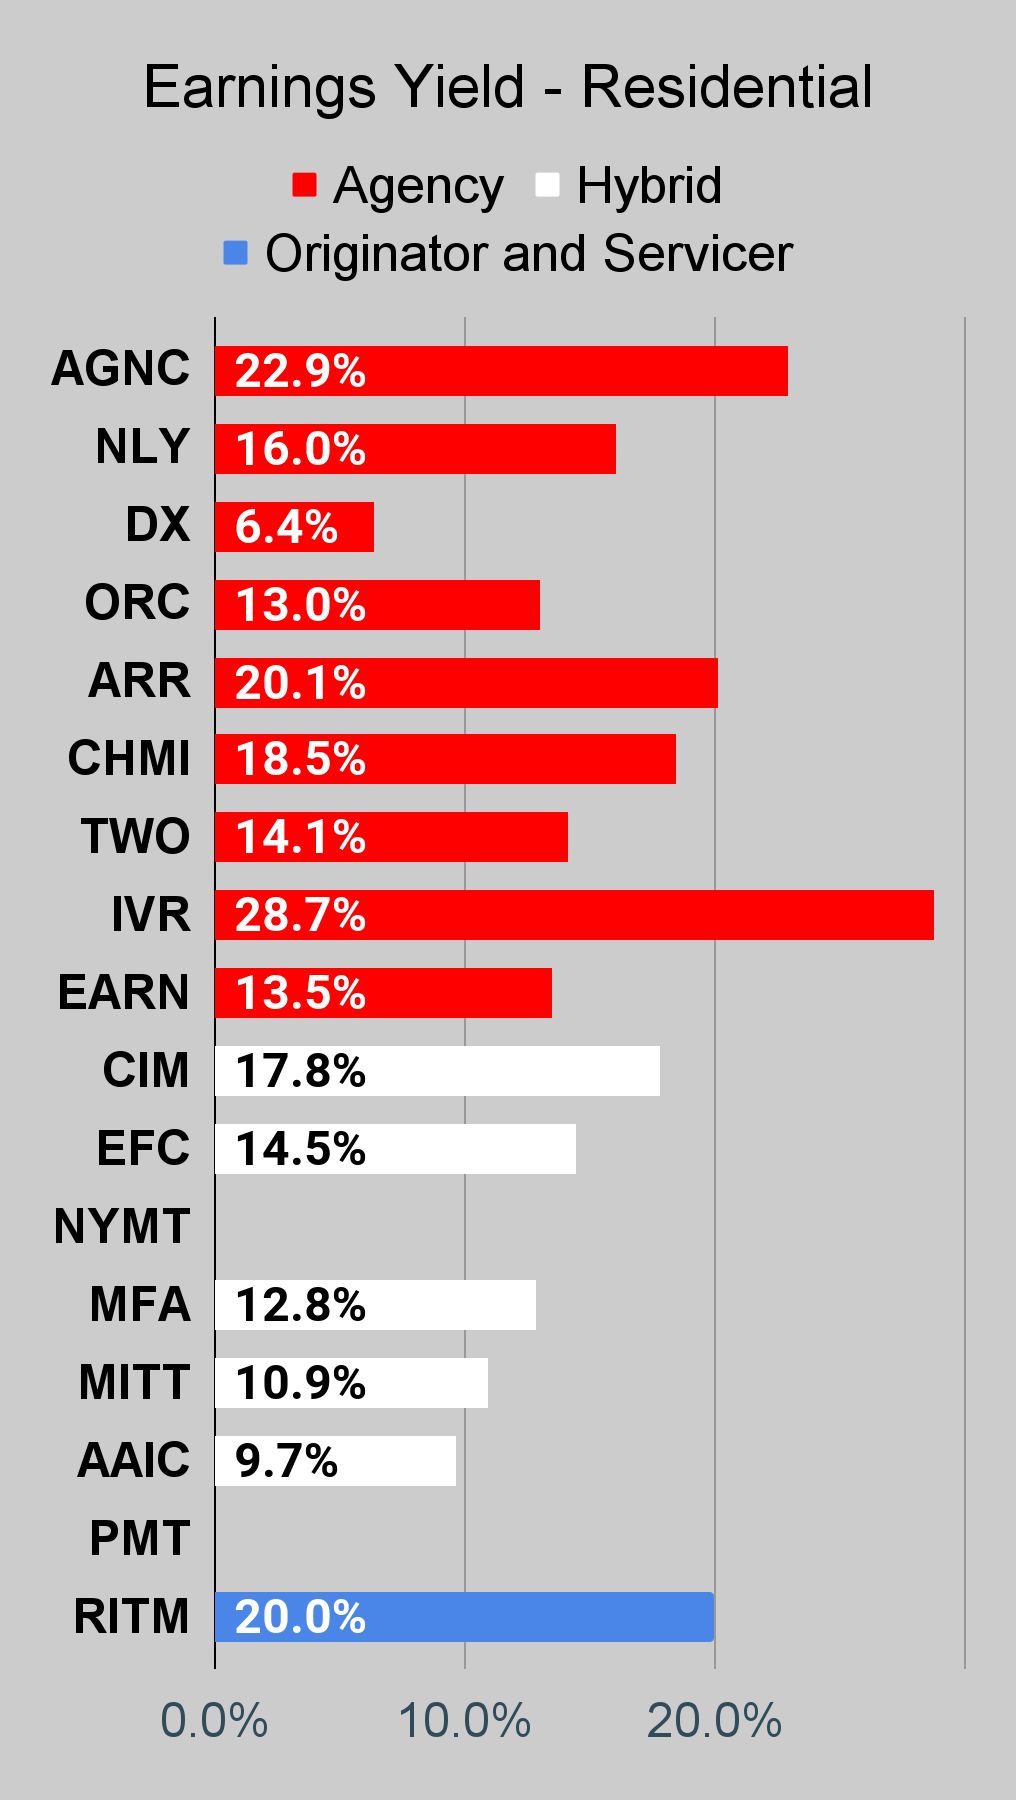
Residential Mortgage REIT Charts
Note: The chart for our public articles uses the book value per share from the latest earnings release. Current estimated book value per share is used in reaching our targets and trading decisions. It is available in our service, but those estimates are not included in the charts below. PMT and NYMT are not showing an earnings yield metric as neither REIT provides a quarterly “Core EPS” metric.
Second Note: Due to the way historical amortized cost and hedging is factored into the earnings metrics, it's possible for two mortgage REITs with similar portfolios to post materially different metrics for earnings. I would be very cautious about putting much emphasis on the consensus analyst estimate (which is used to determine the earnings yield). In particular, throughout late 2022 the earnings metric became less comparable for many REITs.
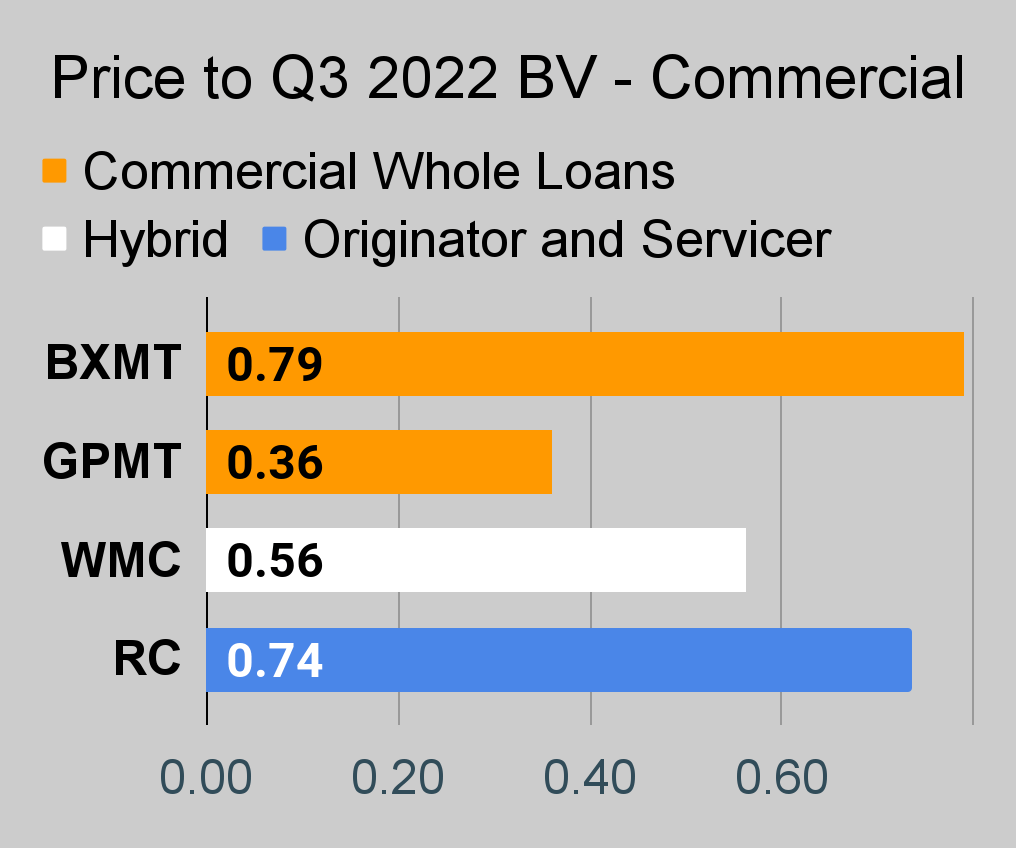
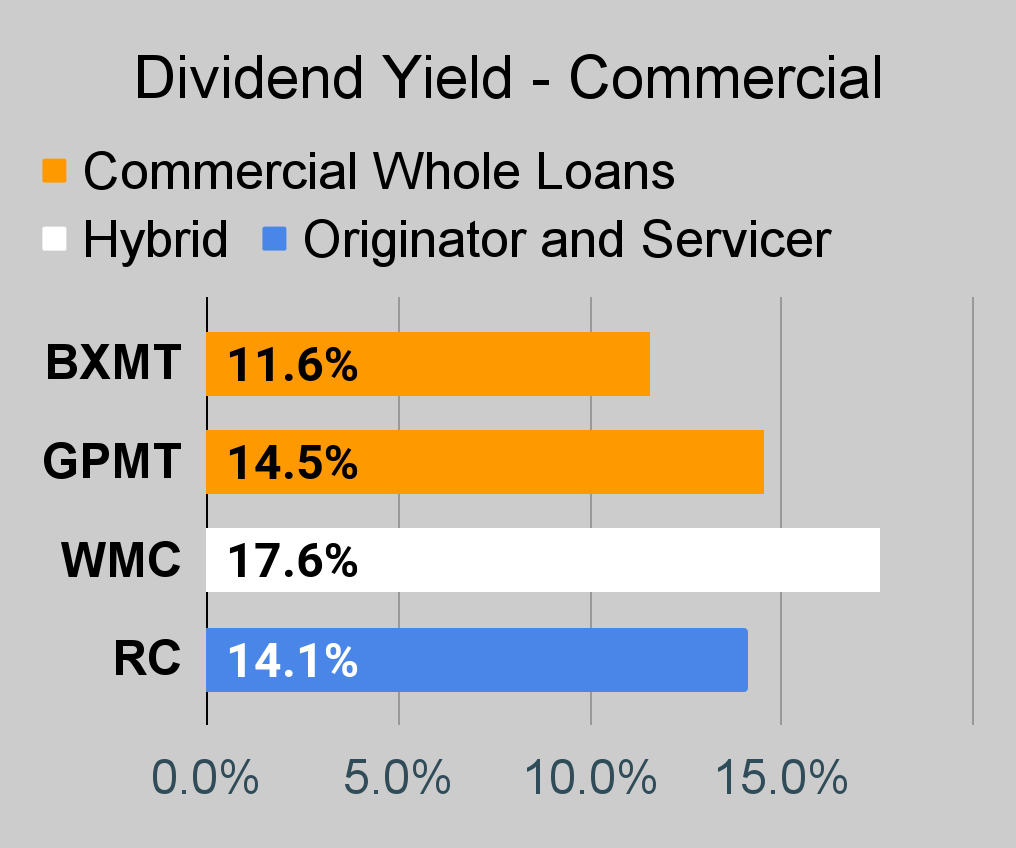
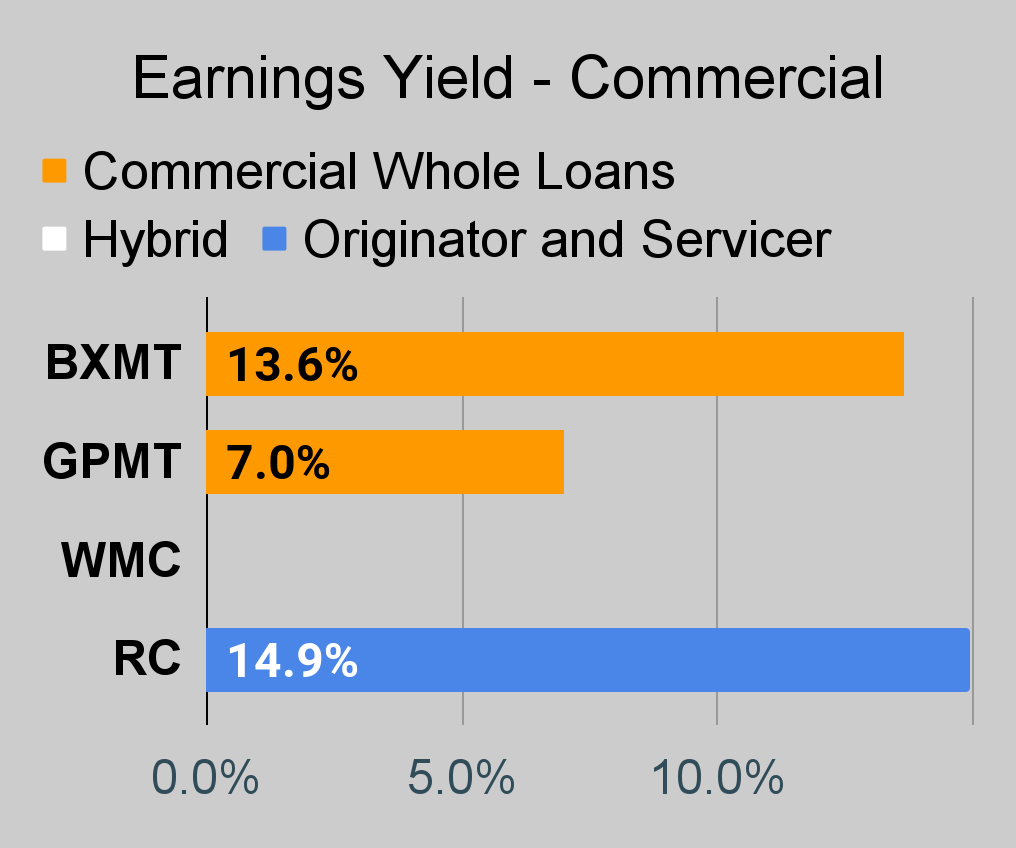
Commercial Mortgage REIT Charts
BDC Charts
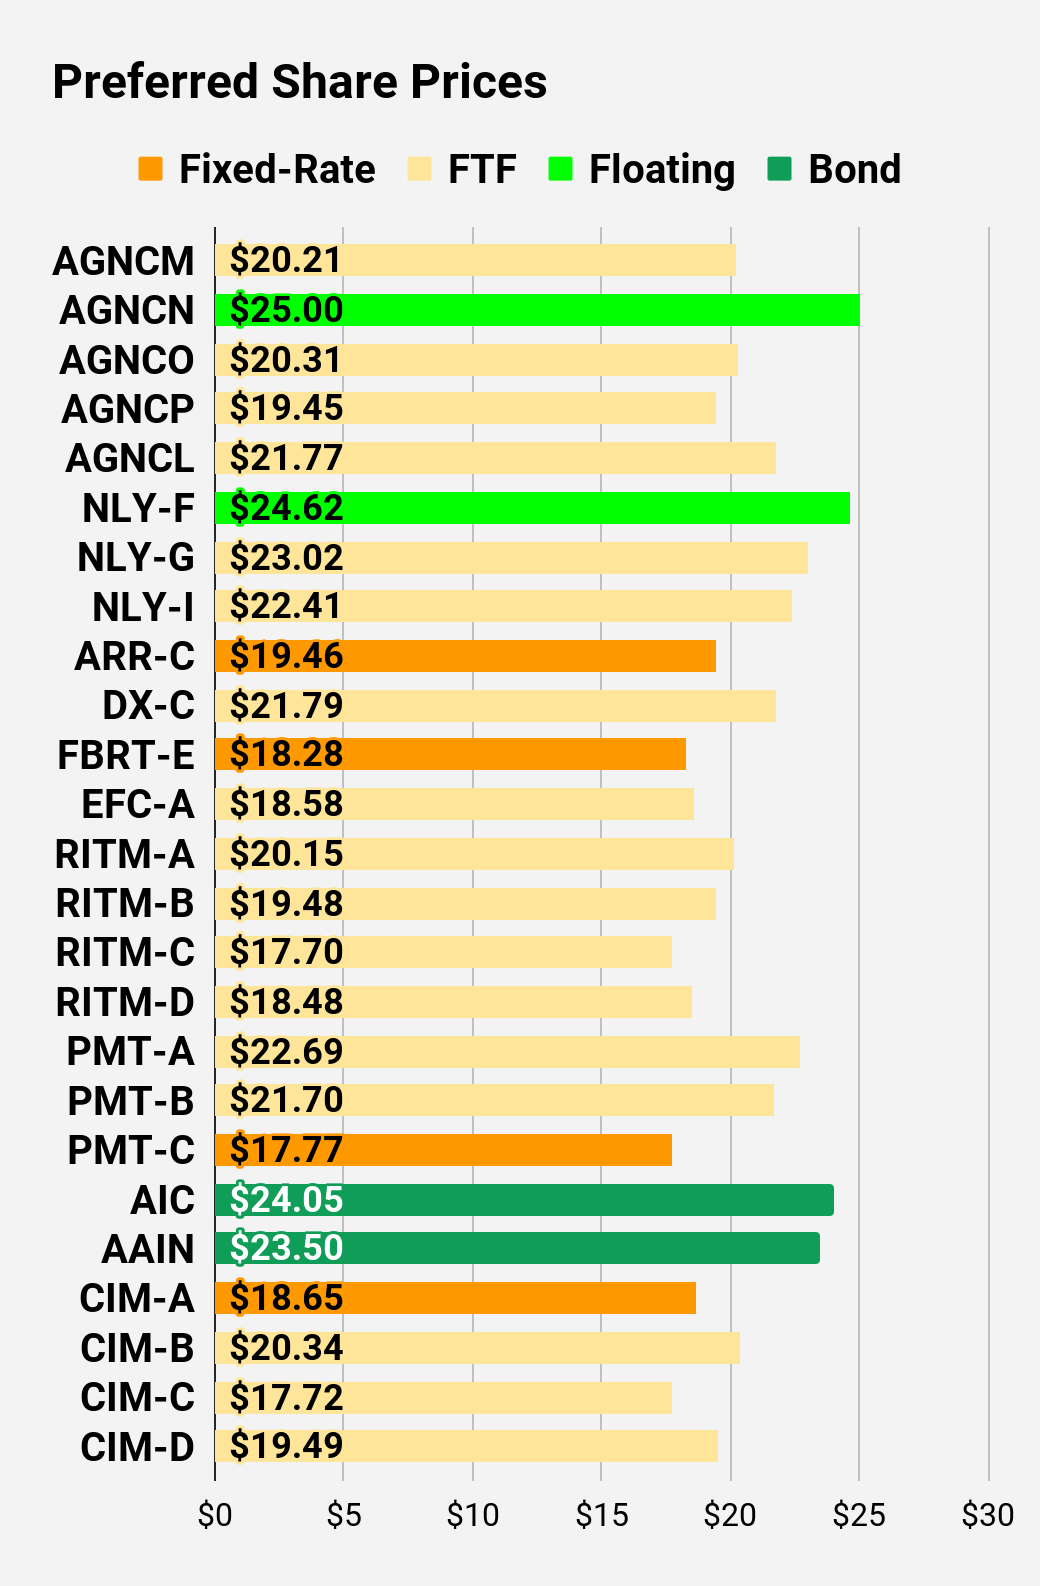
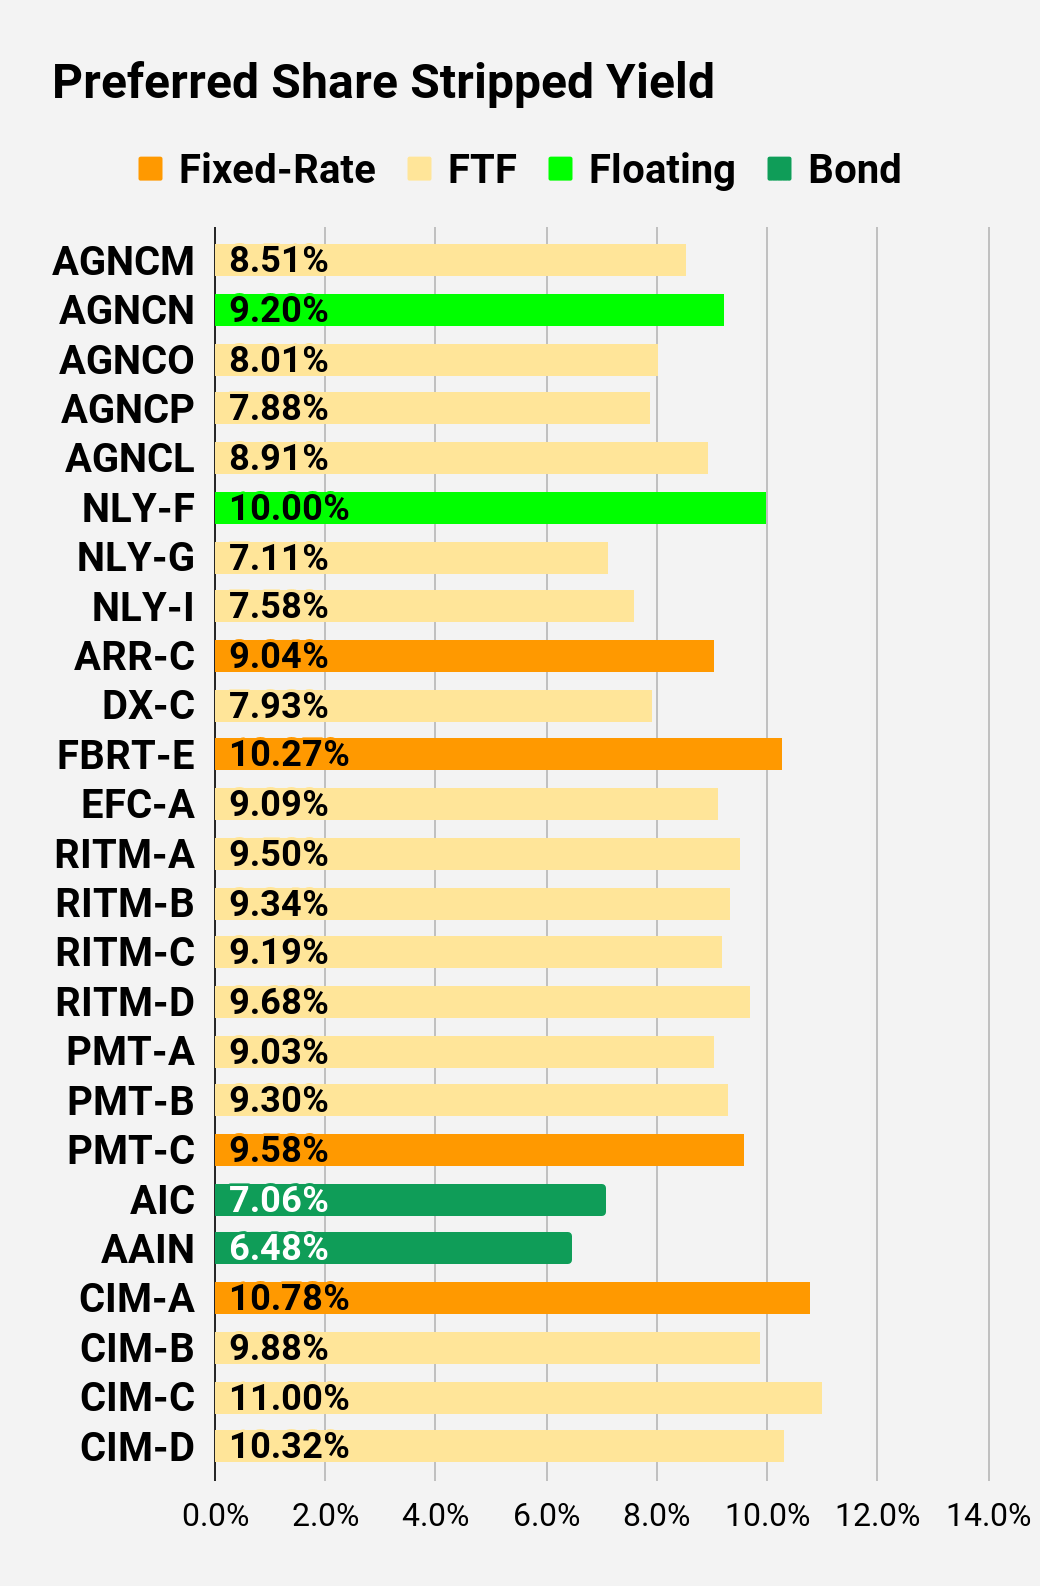
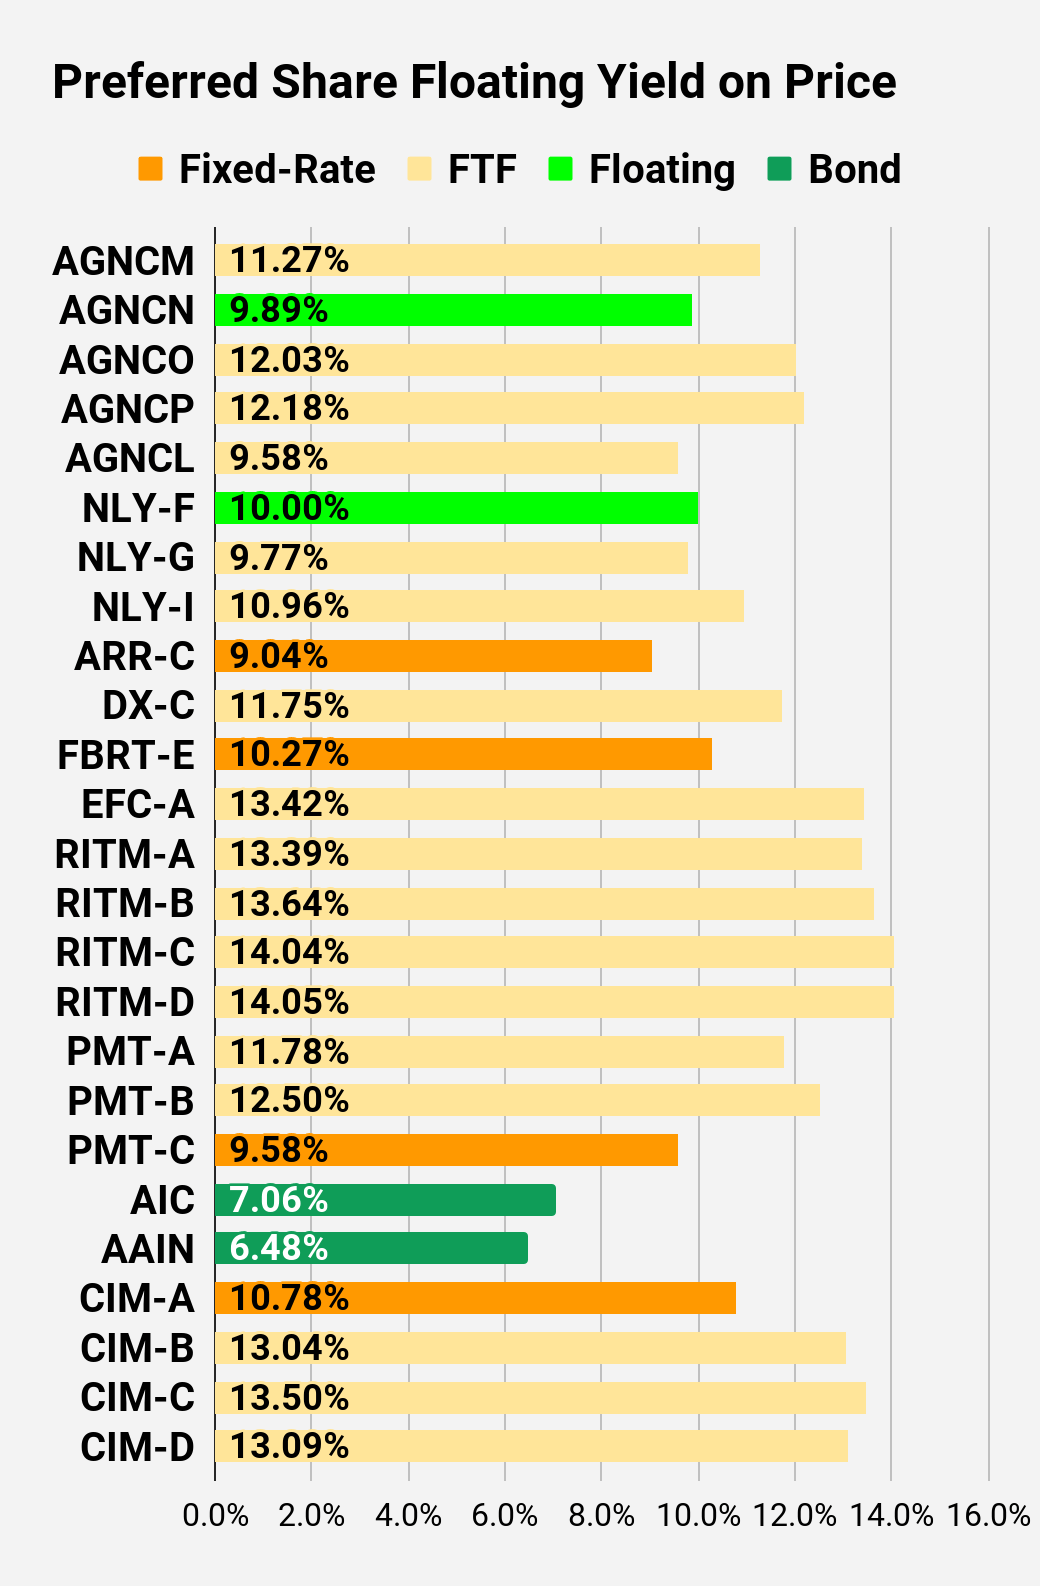
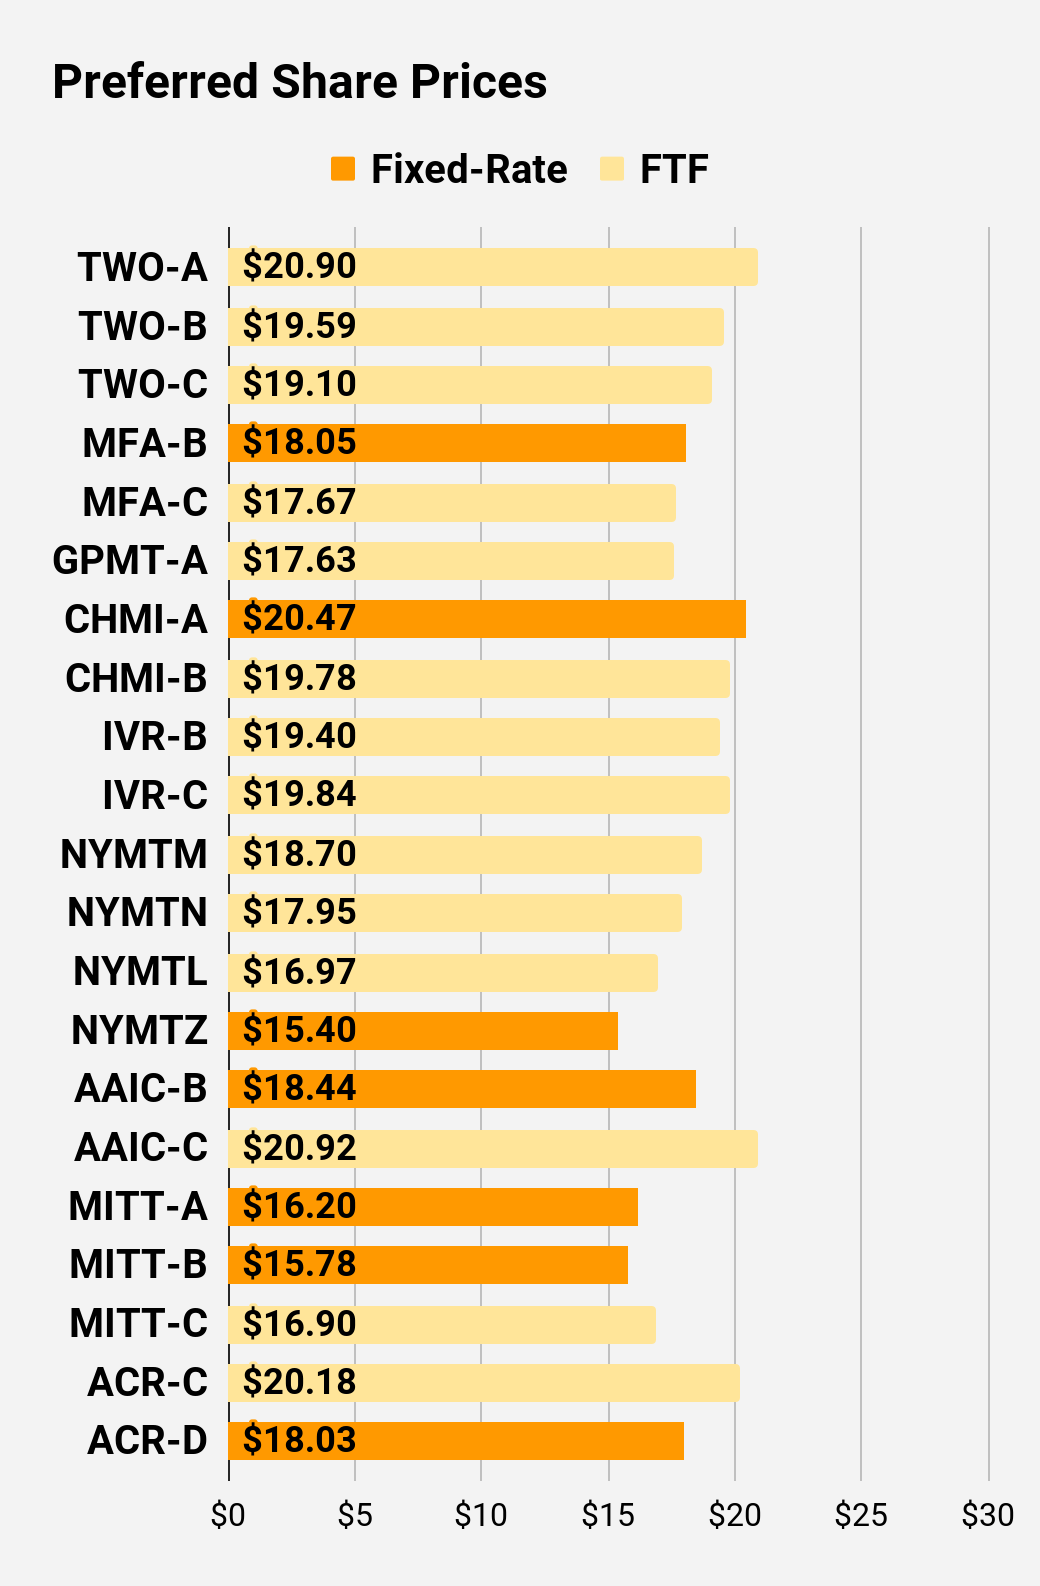
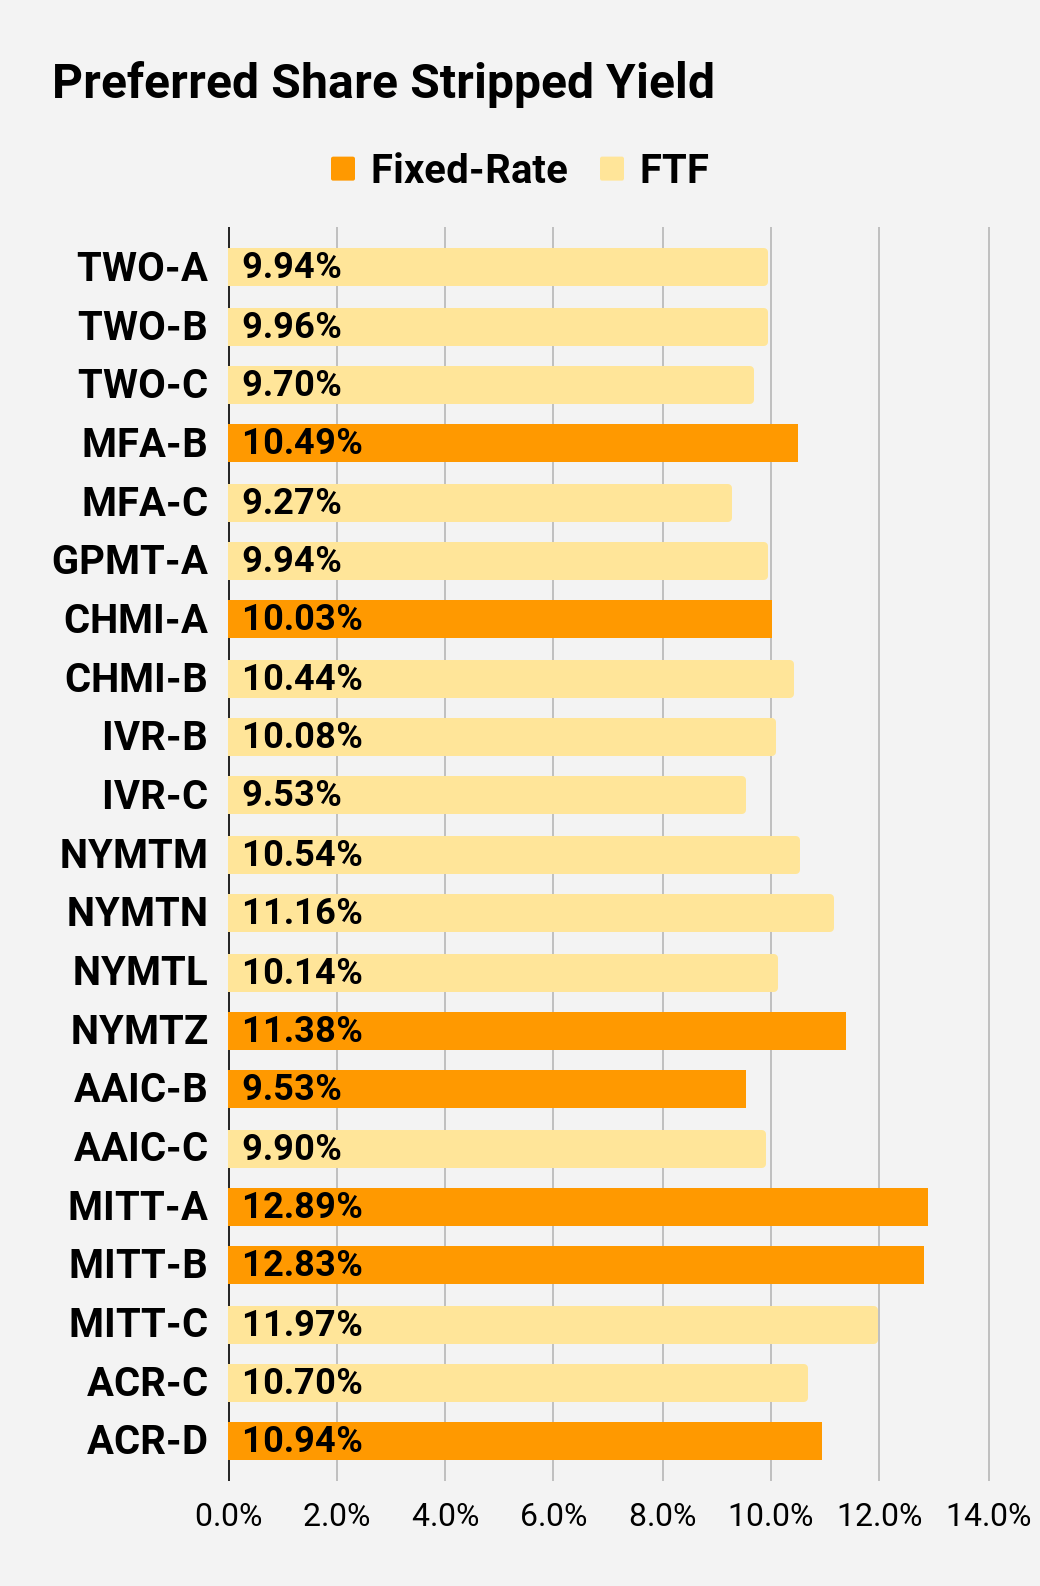
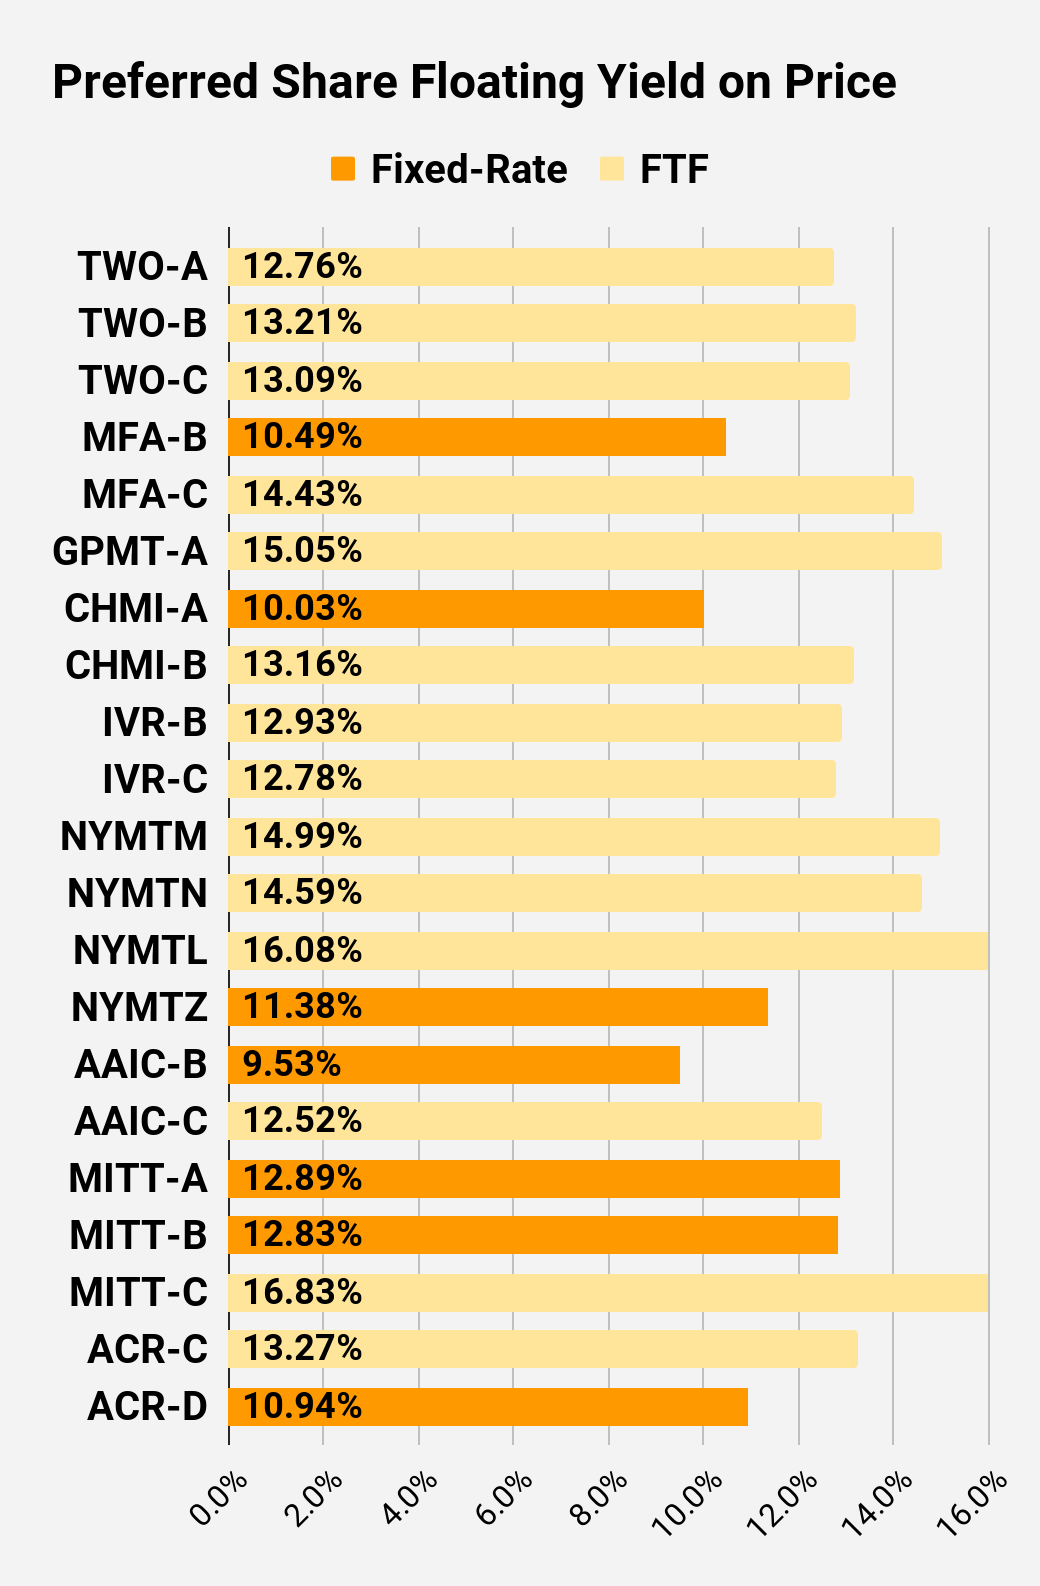
Preferred Share Charts
I changed the coloring a bit. We needed to adjust to include that the first fixed-to-floating shares have transitioned over to floating rates. When a share is already floating, the stripped yield may be different from the “Floating Yield on Price” due to changes in interest rates. For instance, NLY-F already has a floating rate. However, the rate is only reset once per three months. The stripped yield is calculated using the upcoming projected dividend payment and the “Floating Yield on Price” is based on where the dividend would be if the rate reset today. In my opinion, for these shares the “Floating Yield on Price” is clearly the more important metric.
Preferred Share Data
Beyond the charts, we’re also providing our readers with access to several other metrics for the preferred shares.
After testing out a series on preferred shares, we decided to try merging it into the series on common shares. After all, we are still talking about positions in mortgage REITs. We don’t have any desire to cover preferred shares without cumulative dividends, so any preferred shares you see in our column will have cumulative dividends. You can verify that by using Quantum Online. We’ve included the links in the table below.
To better organize the table, we needed to abbreviate column names as follows:
- Price = Recent Share Price - Shown in Charts
- BoF = Bond or FTF (Fixed-to-Floating)
- S-Yield = Stripped Yield - Shown in Charts
- Coupon = Initial Fixed-Rate Coupon
- FYoP = Floating Yield on Price - Shown in Charts
- NCD = Next Call Date (the soonest shares could be called)
- Note: For all FTF issues, the floating rate would start on NCD.
- WCC = Worst Cash to Call (lowest net cash return possible from a call)
- QO Link = Link to Quantum Online Page
| Ticker |
| Price |
| BoF |
| S-Yield |
| Coupon |
| FYoP |
| NCD |
| WCC |
| QO Link |
| P-Link |
| $20.21 |
| FTF |
| 8.51% |
| 6.88% |
| 11.27% |
| 4/15/2024 |
| $6.95 |
| $25.00 |
| Floating |
| 9.20% |
| 9.19% |
| 9.89% |
| 2/2/2023 |
| $0.13 |
| $20.31 |
| FTF |
| 8.01% |
| 6.50% |
| 12.03% |
| 10/15/2024 |
| $7.54 |
| $19.45 |
| FTF |
| 7.88% |
| 6.13% |
| 12.18% |
| 4/15/2025 |
| $9.00 |
| $21.77 |
| FTF |
| 8.91% |
| 7.75% |
| 9.58% |
| 10/15/2027 |
| $12.44 |
| $24.62 |
| Floating |
| 10.00% |
| 9.75% |
| 10.00% |
| 2/2/2023 |
| $0.61 |
| $23.02 |
| FTF |
| 7.11% |
| 6.50% |
| 9.77% |
| 3/31/2023 |
| $2.39 |
| $22.41 |
| FTF |
| 7.58% |
| 6.75% |
| 10.96% |
| 6/30/2024 |
| $5.12 |
| $19.46 |
| 9.04% |
| 7.00% |
| 9.04% |
| 1/28/2025 |
| $9.19 |
| $21.79 |
| FTF |
| 7.93% |
| 6.90% |
| 11.75% |
| 4/15/2025 |
| $7.09 |
| $18.28 |
| 10.27% |
| 7.50% |
| 10.27% |
| 2/2/2023 |
| $6.81 |
| $18.58 |
| FTF |
| 9.09% |
| 6.75% |
| 13.42% |
| 10/30/2024 |
| $9.45 |
| $20.15 |
| FTF |
| 9.50% |
| 7.50% |
| 13.39% |
| 8/15/2024 |
| $8.15 |
| $19.48 |
| FTF |
| 9.34% |
| 7.13% |
| 13.64% |
| 8/15/2024 |
| $8.65 |
| $17.70 |
| FTF |
| 9.19% |
| 6.38% |
| 14.04% |
| 2/15/2025 |
| $10.91 |
| $18.48 |
| FTF |
| 9.68% |
| 7.00% |
| 14.05% |
| 11/15/2026 |
| $13.54 |
| $22.69 |
| FTF |
| 9.03% |
| 8.13% |
| 11.78% |
| 3/15/2024 |
| $4.85 |
| $21.70 |
| FTF |
| 9.30% |
| 8.00% |
| 12.50% |
| 6/15/2024 |
| $6.30 |
| $17.77 |
| 9.58% |
| 6.75% |
| 9.58% |
| 8/24/2026 |
| $13.46 |
| $24.05 |
| Bond |
| 7.06% |
| 6.75% |
| 7.06% |
| 2/2/2023 |
| $1.16 |
| $23.50 |
| Bond |
| 6.48% |
| 6.00% |
| 6.48% |
| 8/1/2023 |
| $2.62 |
| $18.65 |
| 10.78% |
| 8.00% |
| 10.78% |
| 2/2/2023 |
| $6.54 |
| $20.34 |
| FTF |
| 9.88% |
| 8.00% |
| 13.04% |
| 3/30/2024 |
| $7.16 |
| $17.72 |
| FTF |
| 11.00% |
| 7.75% |
| 13.50% |
| 9/30/2025 |
| $12.62 |
| $19.49 |
| FTF |
| 10.32% |
| 8.00% |
| 13.09% |
| 03/30/2024 |
| $8.01 |
Second Batch:
| Ticker |
| Price |
| BoF |
| S-Yield |
| Coupon |
| FYoP |
| NCD |
| WCC |
| QO Link |
| P-Link |
| $20.90 |
| FTF |
| 9.94% |
| 8.13% |
| 12.76% |
| 04/27/2027 |
| $13.24 |
| $19.59 |
| FTF |
| 9.96% |
| 7.63% |
| 13.21% |
| 07/27/2027 |
| $14.47 |
| $19.10 |
| FTF |
| 9.70% |
| 7.25% |
| 13.09% |
| 1/27/2025 |
| $9.99 |
| $18.05 |
| 10.49% |
| 7.50% |
| 10.49% |
| 2/2/2023 |
| $7.13 |
| $17.67 |
| FTF |
| 9.27% |
| 6.50% |
| 14.43% |
| 3/31/2025 |
| $10.99 |
| $17.63 |
| FTF |
| 9.94% |
| 7.00% |
| 15.05% |
| 11/30/2026 |
| $14.14 |
| $20.47 |
| 10.03% |
| 8.20% |
| 10.03% |
| 2/2/2023 |
| $4.56 |
| $19.78 |
| FTF |
| 10.44% |
| 8.25% |
| 13.16% |
| 4/15/2024 |
| $7.72 |
| $19.40 |
| FTF |
| 10.08% |
| 7.75% |
| 12.93% |
| 12/27/2024 |
| $9.50 |
| $19.84 |
| FTF |
| 9.53% |
| 7.50% |
| 12.78% |
| 9/27/2027 |
| $14.09 |
| $18.70 |
| FTF |
| 10.54% |
| 7.88% |
| 14.99% |
| 1/15/2025 |
| $10.24 |
| $17.95 |
| FTF |
| 11.16% |
| 8.00% |
| 14.59% |
| 10/15/2027 |
| $16.55 |
| $16.97 |
| FTF |
| 10.14% |
| 6.88% |
| 16.08% |
| 10/15/2026 |
| $14.48 |
| $15.40 |
| 11.38% |
| 7.00% |
| 11.38% |
| 1/15/2027 |
| $16.60 |
| $18.44 |
| 9.53% |
| 7.00% |
| 9.53% |
| 2/2/2023 |
| $6.63 |
| $20.92 |
| FTF |
| 9.90% |
| 8.25% |
| 12.52% |
| 3/30/2024 |
| $6.55 |
| $16.20 |
| 12.89% |
| 8.25% |
| 12.89% |
| 2/2/2023 |
| $9.03 |
| $15.78 |
| 12.83% |
| 8.00% |
| 12.83% |
| 2/2/2023 |
| $9.44 |
| $16.90 |
| FTF |
| 11.97% |
| 8.00% |
| 16.83% |
| 9/17/2024 |
| $11.57 |
| $20.18 |
| FTF |
| 10.70% |
| 8.63% |
| 13.27% |
| 7/30/2024 |
| $8.06 |
| $18.03 |
| 10.94% |
| 7.88% |
| 10.94% |
| 5/21/2026 |
| $13.49 |
Strategy
Our goal is to maximize total returns . We achieve those most effectively by including “trading” strategies. We regularly trade positions in the mortgage REIT common shares and BDCs because:
- Prices are inefficient.
- Long term, share prices generally revolve around book value.
- Short term, price-to-book ratios can deviate materially.
- Book value isn’t the only step in analysis, but it is the cornerstone.
We also allocate to preferred shares and equity REITs. We encourage buy-and-hold investors to consider using more preferred shares and equity REITs.
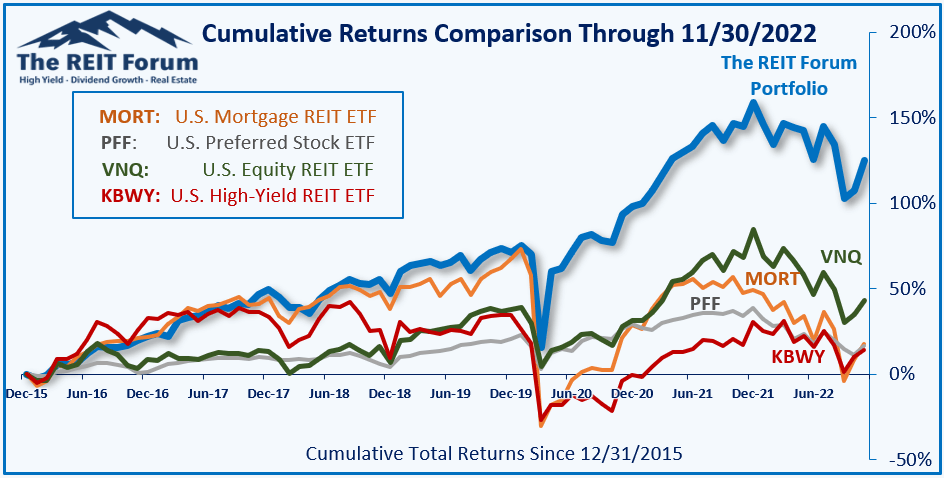
Performance
We compare our performance against four ETFs that investors might use for exposure to our sectors:
The four ETFs we use for comparison are:
| Ticker |
| Exposure |
| One of the largest mortgage REIT ETFs |
| One of the largest preferred share ETFs |
| Largest equity REIT ETF |
| The high-yield equity REIT ETF. Yes, it has been dreadful. |
When investors think it isn’t possible to earn solid returns in preferred shares or mortgage REITs, we politely disagree. The sector has plenty of opportunities, but investors still need to be wary of the risks. We can’t simply reach for yield and hope for the best. When it comes to common shares, we need to be even more vigilant to protect our principal by regularly watching prices and updating estimates for book value and price targets.
Ratings: Bullish on TPVG, FSK
For further details see:
2 Big 13% Dividend Yields On Sale