FBRT - 3 REITs To Dump On The Insane Rally
Summary
- These three REITs got much too cheap in October 2022, but they rallied too hard. Take the money and run!
- Shares are up 33% to 52%. They deserved a rally, but not that much.
- We're not always bearish. We recommended one of these shares within days of the 52-week low.
Get ready for charts, images, and tables because they are better than words. The ratings and outlooks we highlight here come after Scott Kennedy’s weekly updates in the REIT Forum. Your continued feedback is greatly appreciated, so please leave a comment with suggestions.
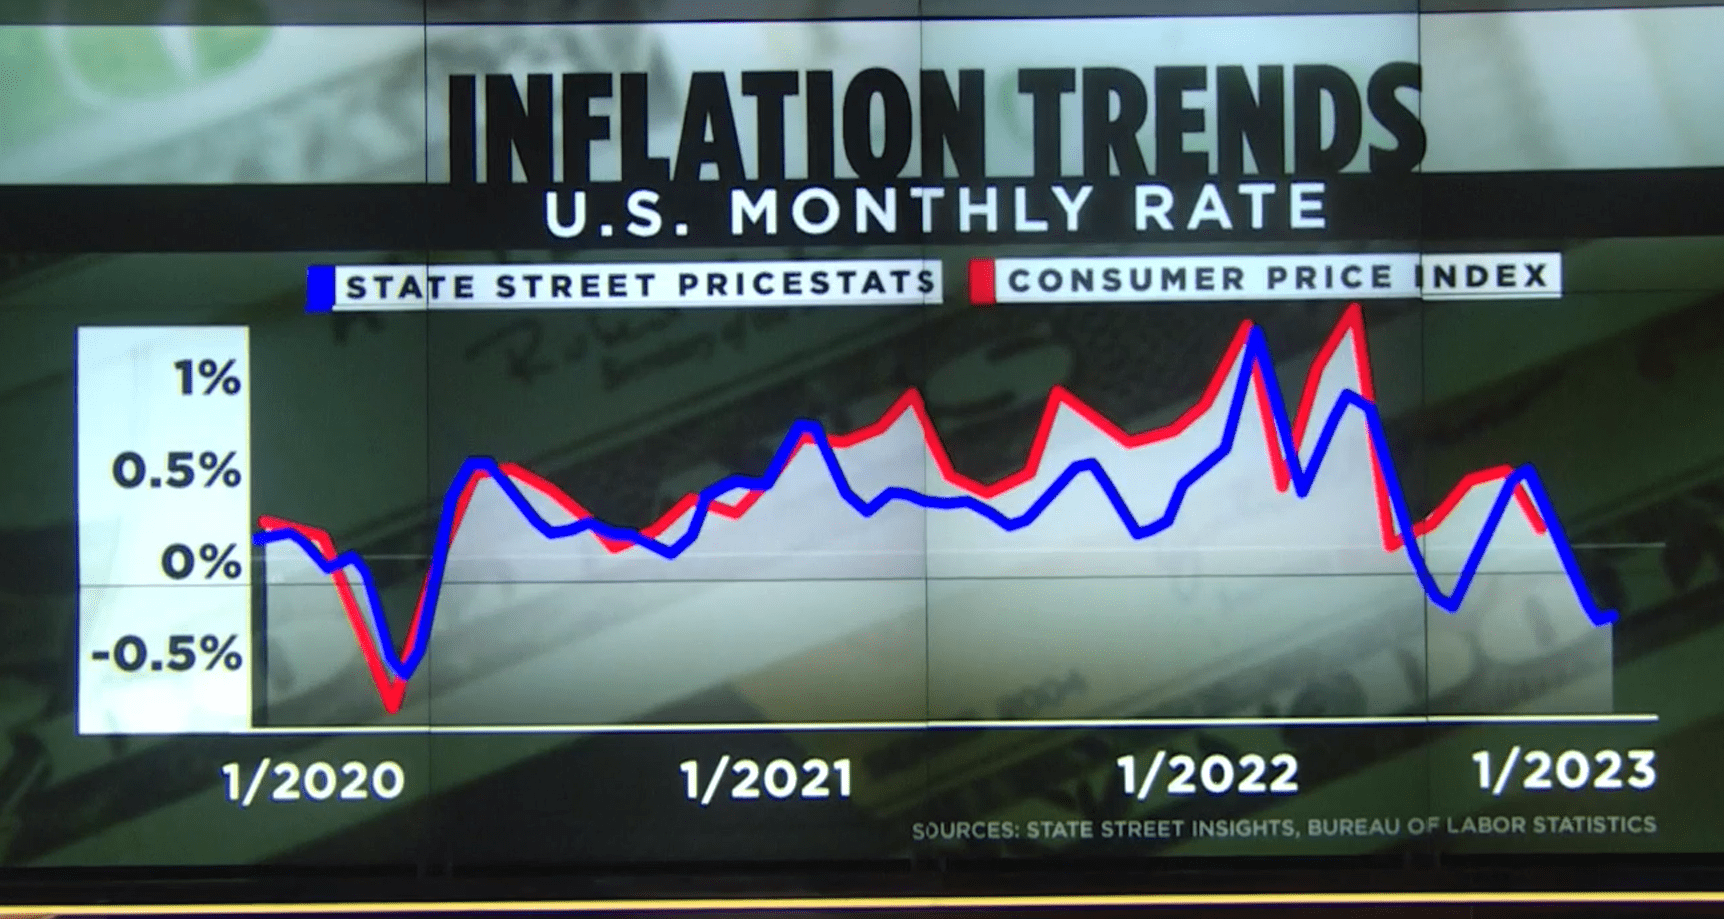
2023 has been a wild year from the start. We’ve seen a significant rally in less than two weeks. A significant chunk of the decline from 2022 has already been wiped out as investors become much more optimistic about the future path of inflation. We’ve talked before about the potential for markets to jump higher on any weakness in yields. If the Federal Reserve can simply “not steer us over a cliff,” that would be great news. The bar was set that low. Now investors are shifting to expecting significantly lower inflation.
We’ve written several articles about the high probability of inflation falling off significantly in 2023 and the evidence continues to support that idea:
Screenshot from CNBC, see other sources on image
With all the positive developments, I want to highlight a few shares where I think the market is getting a bit too optimistic. These are shares where prices are already quite a bit above our estimate for NAV.
We’ll be looking at our NAV estimates for early January. Before writing this article, I glanced at Treasury movements for the weeks and prices on MBS. I’m inclined to say that so far this week there is probably a modest gain to book value for the agency mortgage REITs. That could reverse later in the week, or it could increase. The point is, the estimates we’re using should still be pretty good (the best you’ll find).
It’s time for analysis.
Note: I’m writing this before the market closes, so the closing prices may be slightly different from those referenced in the article.
AGNC
AGNC Investment Corp. ( AGNC ) comes first on our list. At $11.18, shares are only trading about 1% above book value. However, book value includes intangible assets (Goodwill) from the buyout of the external manager years ago. By our estimate, tangible book value (which excludes Goodwill) is about $10.15 per share. That means the price-to-tangible-book ratio is about 1.1x. Historically speaking, that’s unusually high. It’s well outside the normal range. The odds are highly in favor of the share price falling. It’s worth noting that by our estimates during Q4 2022 book value may have bottomed out around the middle of the $8 range. That was in late October / early November. The lowest close was October 10th, 2022.
Since then, share prices recovered 51.3%. That's in addition to some dividends. Shares were down to about $7.37. They were a good deal at that price, but not today. While there has been a respectable recovery in projected book value, it is dwarfed by the change in the share price.
The majority of the mortgage REITs we cover set their 52-week low closing prices on 10/10/2022. At that point, we had mostly bullish ratings throughout the sector as discounts to book value were dramatic. Spreads between MBS and Treasuries were also huge. However, the market rarely rewards mortgage REIT share prices when the spread between MBS yields and Treasury yields is high.
Earnings Yields and Uninformed Investors
You may think investors want to buy when the “earnings yield” is high, but this is an accounting issue. The time with the highest “earnings yield” is not the same as the time when spreads between MBS and Treasuries are actually widest. The issue is the role of historical prices. Interest rate swaps are based on the rate when the position was entered. Likewise, the yield on MBS depends on the price paid for the MBS.
So how can you pump up Core Earnings?
This is just a hypothetical example.
Let’s say you entered some 5-year LIBOR swaps when LIBOR rates were 1.5%.
At the same time, let’s say you bought some MBS with a 2.5% coupon rate for $104. Based on prepayments, you may have expected to earn a yield of about 2.1%.
So at this point, you would be expecting a 0.6% spread.
As rates increase, you expect lower prepayments. Your yield on the MBS could move up to almost 2.5% if you assume nearly 0 prepayments.
However, that still only creates a 1.0% spread. Fast forward a few months and you can buy a 5.5% MBS for $100. Since you’re paying $100, there is no premium to amortize. You’re going to have a yield of 5.5% on this position regardless of what happens with rates.
But how are you going to get the cash to buy this mortgage at 5.5%? You can either issue new shares or dump your MBS with the 2.5% coupon rate for a large loss. Let’s say you dump some of those MBS with the 2.5% coupon rate. You record a realized loss on the position and then it gets ejected from your income statement.
Was that actually a good trade? It depends entirely on the price you were able to get for selling the MBS with the 2.5% coupon rate. If you sold it for $50, it would clearly be an absolutely awful trade. If you sold it at $99, the other party got ripped off.
However, whether you got a good deal or a bad deal, you’re about to report a 5.5% yield on your new MBS and ditch the lower yield from the older MBS.
Congratulations, now you know how to pump up your net interest spread and core earnings! Think investors can see through this? You’ve got to be kidding me. A chunk of Wall Street analysts don’t even grasp this.
It reminds me of a few years ago when an analyst was asking Gary Kain about the expected yield on a new dollar of equity. The pause that followed was epic. To be clear, as an analyst, you should absolutely be able to calculate that for yourself. However, new equity is neither more valuable nor less valuable than older equity.
Transcripts don’t differentiate between a one second pause and several seconds of face palming.
I’m highlighting this for readers because it is hilarious and because we’re seeing a dramatic difference in the amount of “earnings” produced by each dollar of book value between mortgage REITs. The difference is not reflecting skill. It's a reflection of the impact from the rules for interest income and interest expense. We’ve only gone over the issue for interest income here, but there’s some significant impacts on interest expense coming from the way hedges are designed. In some cases, two similar portfolios can produce extremely different income statements due to the way the income and expense is classified. Yet we’ve got plenty of analysts out there who think it’s all about the earnings instead of looking at the book value.
Annaly Capital Management
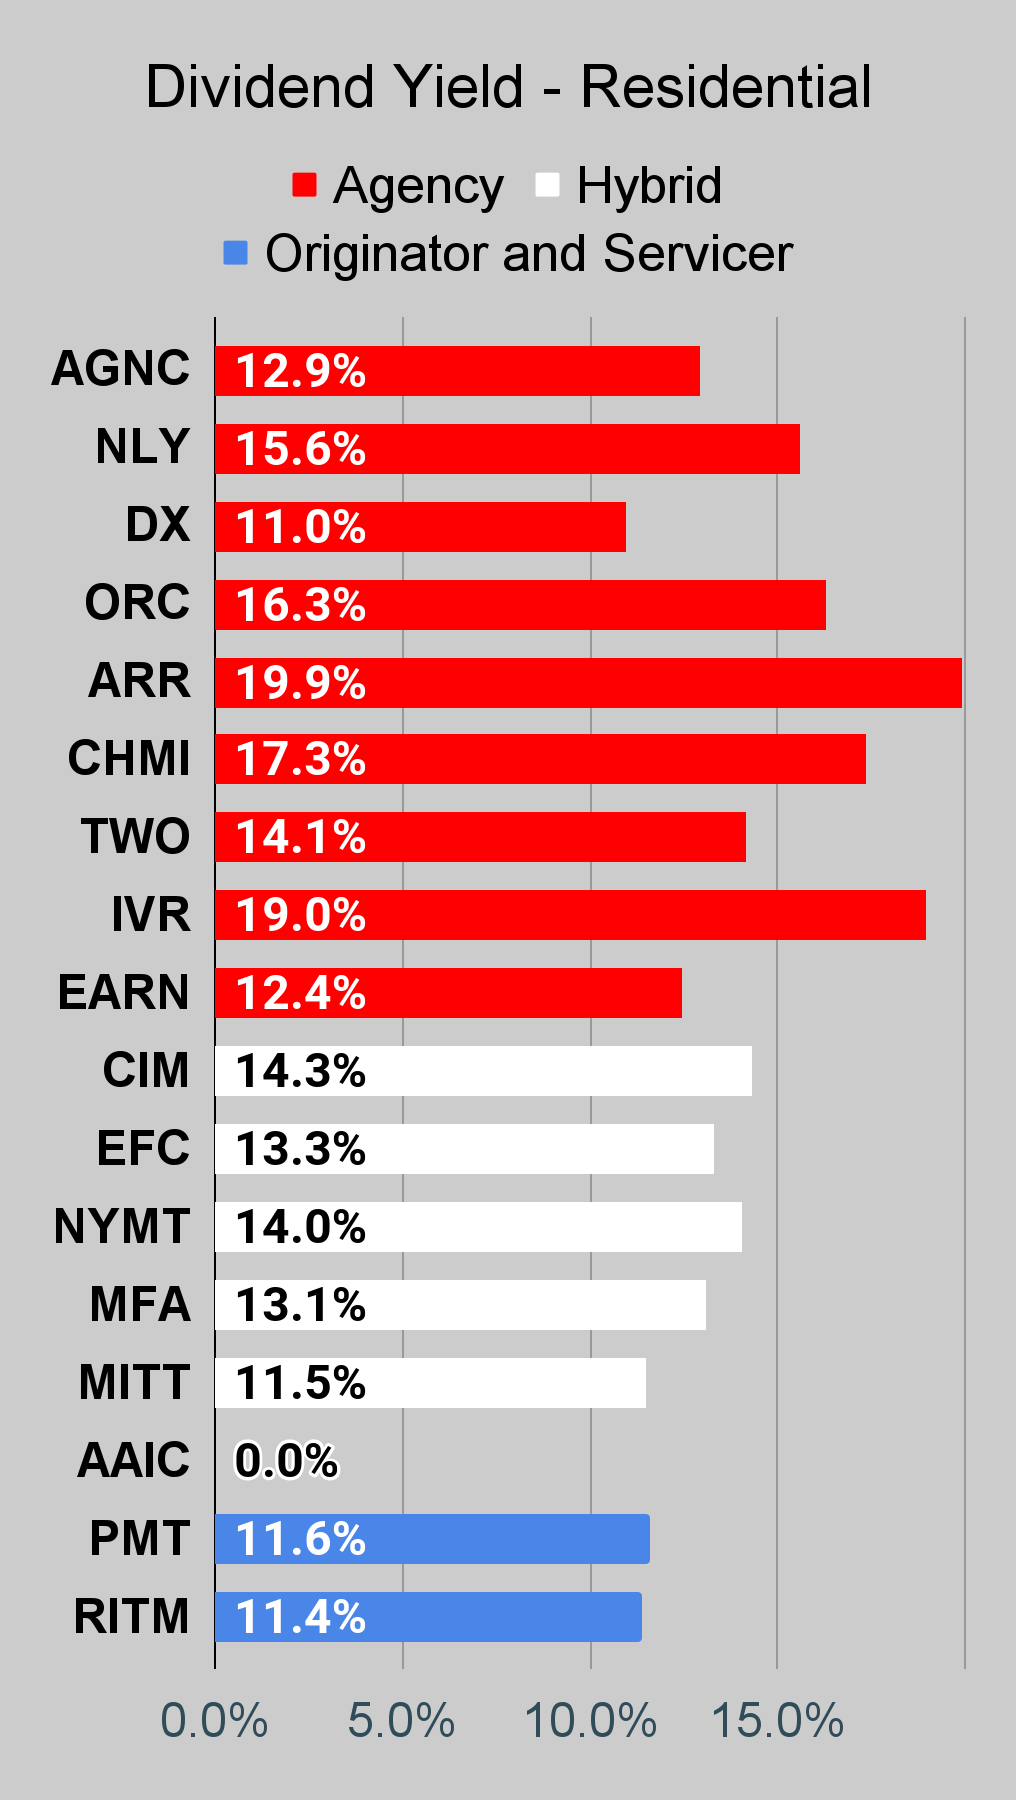
My next pick for a share that rallied too much is Annaly Capital Management (NLY). Shares trade at a price-to-projected-book-value ratio of 1.05 based on a recent price of $22.54. Much like AGNC, they’ve recovered dramatically from October 10th, 2022. Prices are up 49% in addition to the dividend. That’s a huge recovery and it makes NLY far less attractive. Either of these REITs could rally if they report a strong fourth quarter. However, if they didn’t change their portfolio significantly, our estimates should be pretty close. You should probably be a bit concerned that NLY’s dividend yield on projected book value is 16.4%. That’s not saying they have to announce a cut right now, but that’s an unusually high ratio.
I could write several articles to convince you that book value is the important metric, but most people have already chosen to either listen or to ignore all evidence. To be fair, I’ve already written well over a hundred articles hammering on that point.
ARMOUR Residential
ARMOUR Residential REIT ( ARR ) also has an estimated book value slightly below the $6.03 share price. ARR has done an exceptional job at reducing book value per share and slashing dividends over the last several years. Why would you pay more than book value for that? I sure wouldn’t. ARR is only up about 33% to 34% from their lowest close, but the price-to-book inching over 1.0 should be a red flag for investors who missed the prior red flags.
What Should These REITs Do?
If we’re right about the current book value, these REITs would be wise to issue new shares. To enable that, they may want to think about pre-reporting Q4 results. For AGNC, that would be particularly attractive with price-to-tangible book value at such high levels.
There are much better choices available in the sector. It's quite unlikely that these would be the top three over the next year or two. You can still get a respectable discount to book value on several mortgage REITs and you can get a far less dangerous dividend using the preferred shares. As an added benefit, the book value for preferred shares doesn’t trend down over time.
Not Always Bearish
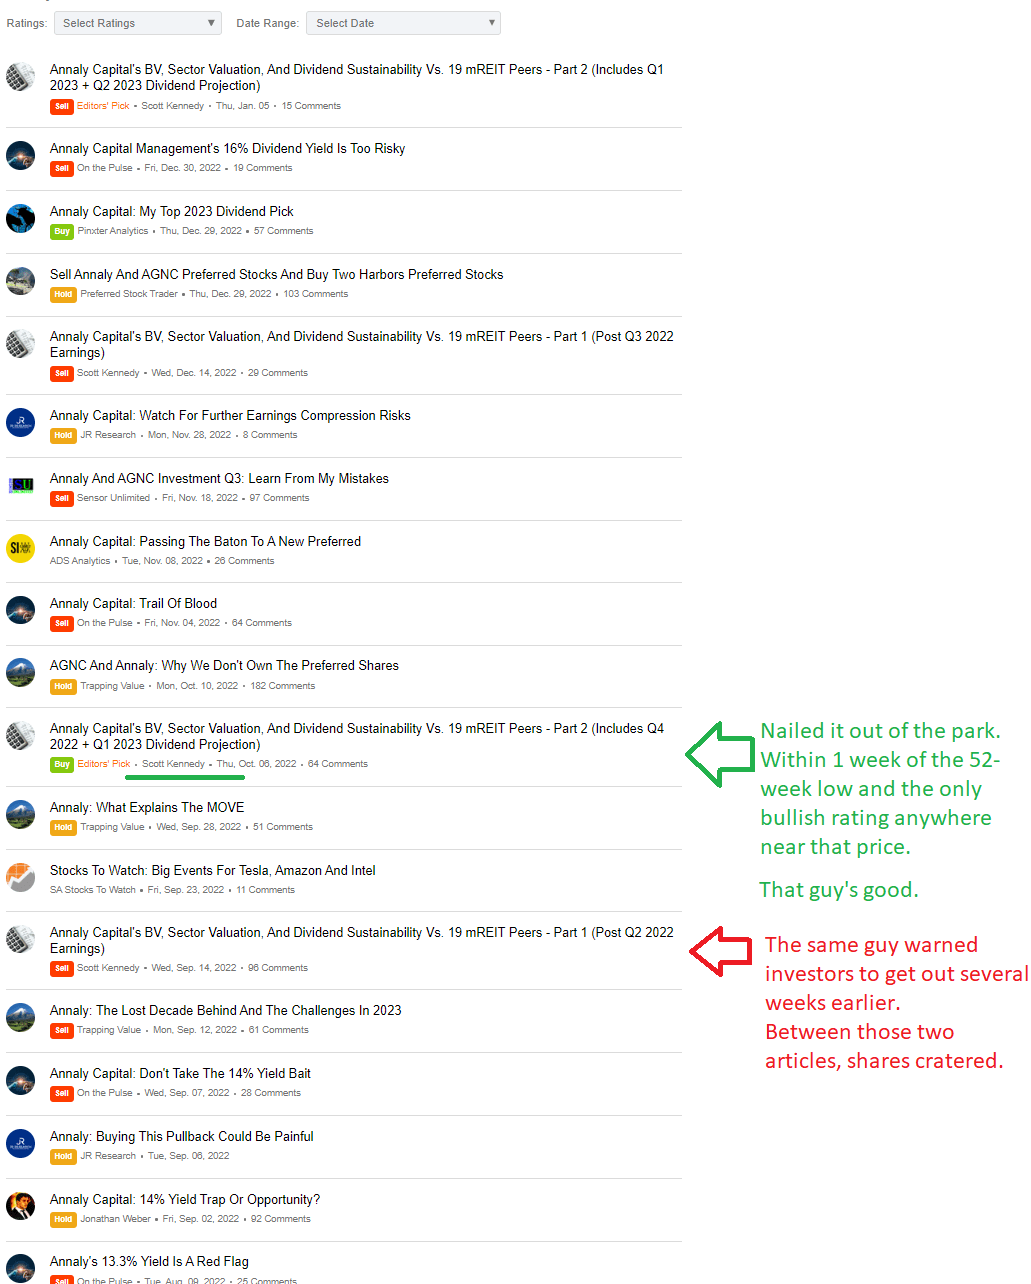
Some investors may think that the REIT Forum is constantly bearish on mortgage REITs. That would be hilarious, given the number of bullish ratings we’ve published. However, I still hear it from time to time. Let’s take a look at the rating history for Annaly Capital Management:
Seeking Alpha
There was an analyst who posted the bullish rating within one week of the 52-week low. However, he wasn’t stuck in a bullish view. He posted a bearish rating a few weeks earlier. How bad did the stock crater between those ratings?
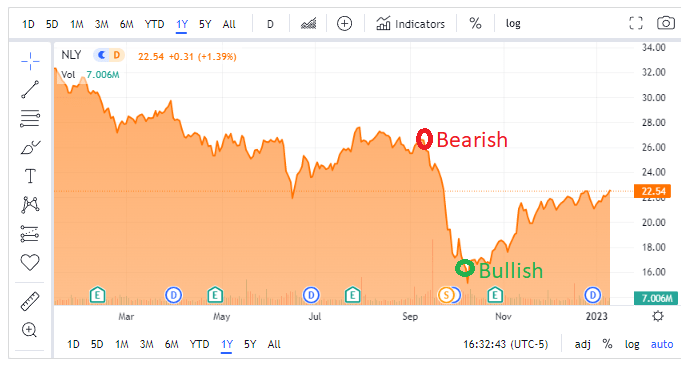
Seeking Alpha
Yeah, that’s perfection.
Scott Kennedy is the analyst in charge of the research on common shares for mortgage REITs and BDCs for The REIT Forum. It’s his estimates for book value I referenced earlier in this article.
Did we set the bar too high? That's why our articles emphasize that analysts need to beat the index or get out.
Stock Table
We will close out the rest of the article with the tables and charts we provide for readers to help them track the sector for both common shares and preferred shares.
We’re including a quick table for the common shares that will be shown in our tables:
| Type of REIT or BDC |
| Residential Agency |
| Residential Hybrid |
| Residential Originator and Servicer |
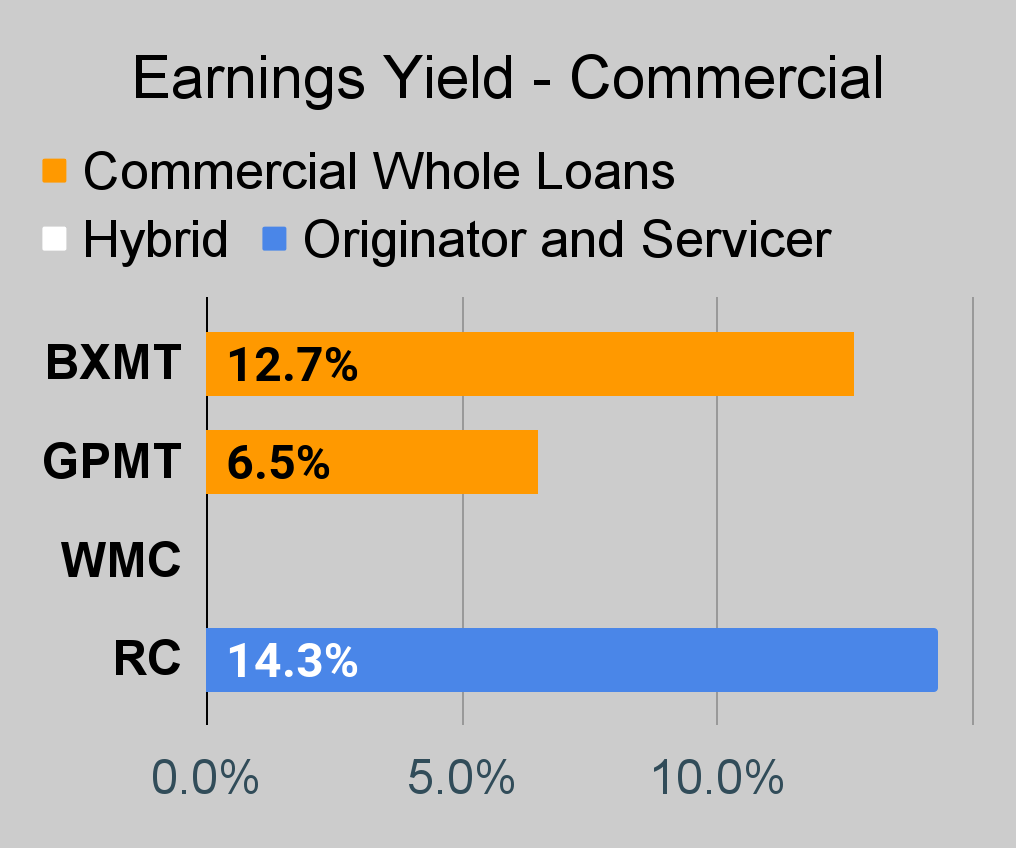
| Commercial |
| BDC |
Let the images begin!
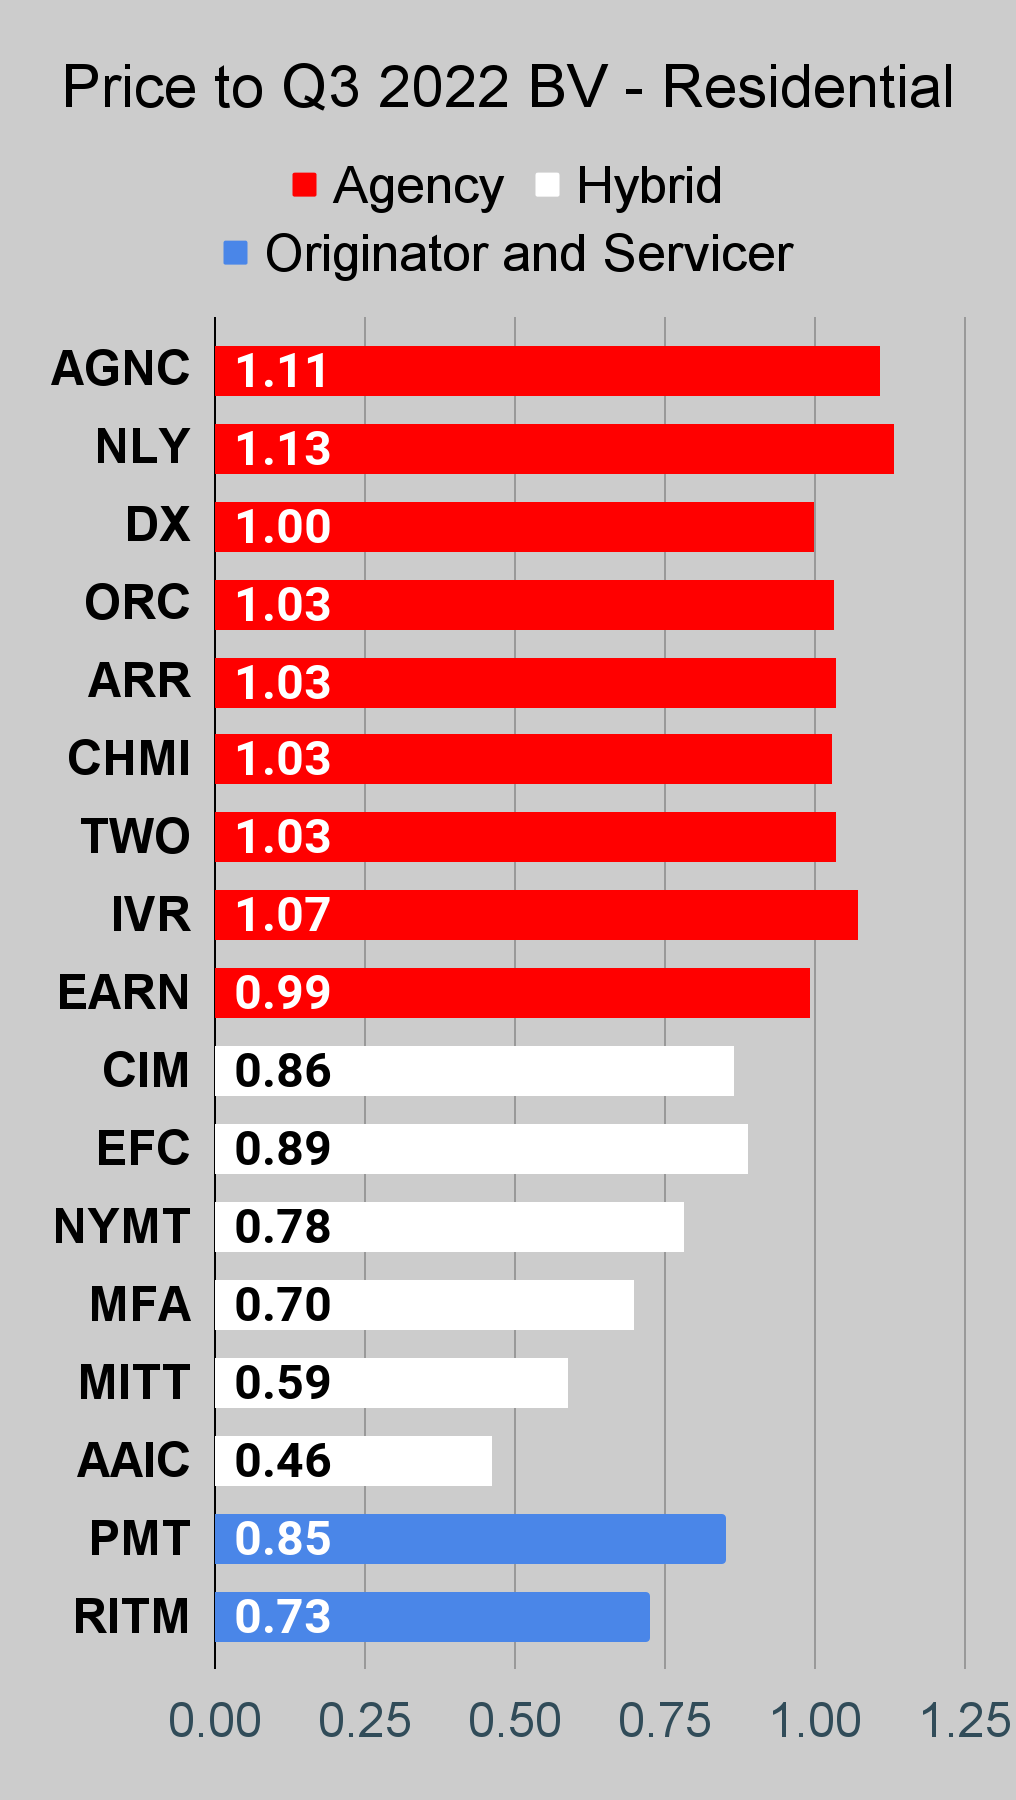
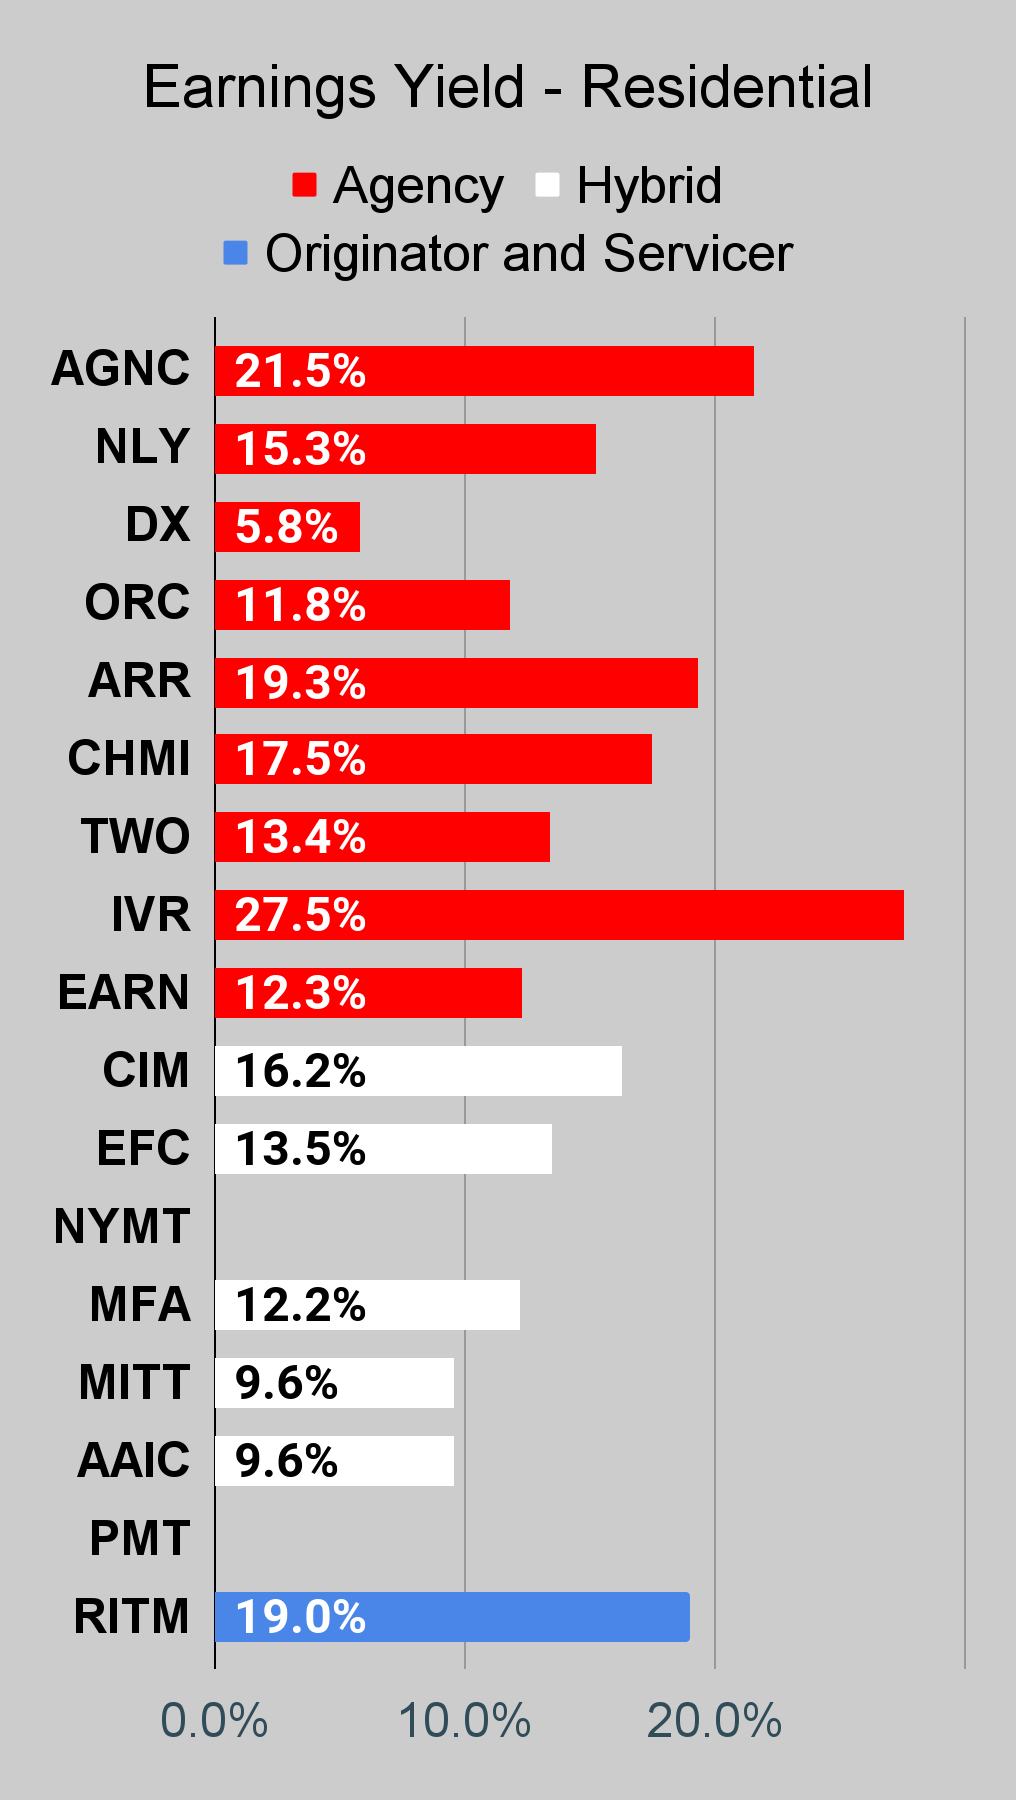
Residential Mortgage REIT Charts
Note: The chart for our public articles uses the book value per share from the latest earnings release. Current estimated book value per share is used in reaching our targets and trading decisions. It's available in our service, but those estimates are not included in the charts below. PMT and NYMT are not showing an earnings yield metric as neither REIT provides a quarterly “Core EPS” metric.
Second Note: Due to the way historical amortized cost and hedging is factored into the earnings metrics, it's possible for two mortgage REITs with similar portfolios to post materially different metrics for earnings. I would be very cautious about putting much emphasis on the consensus analyst estimate (which is used to determine the earnings yield). In particular, throughout late 2022 the earnings metric became less comparable for many REITs.
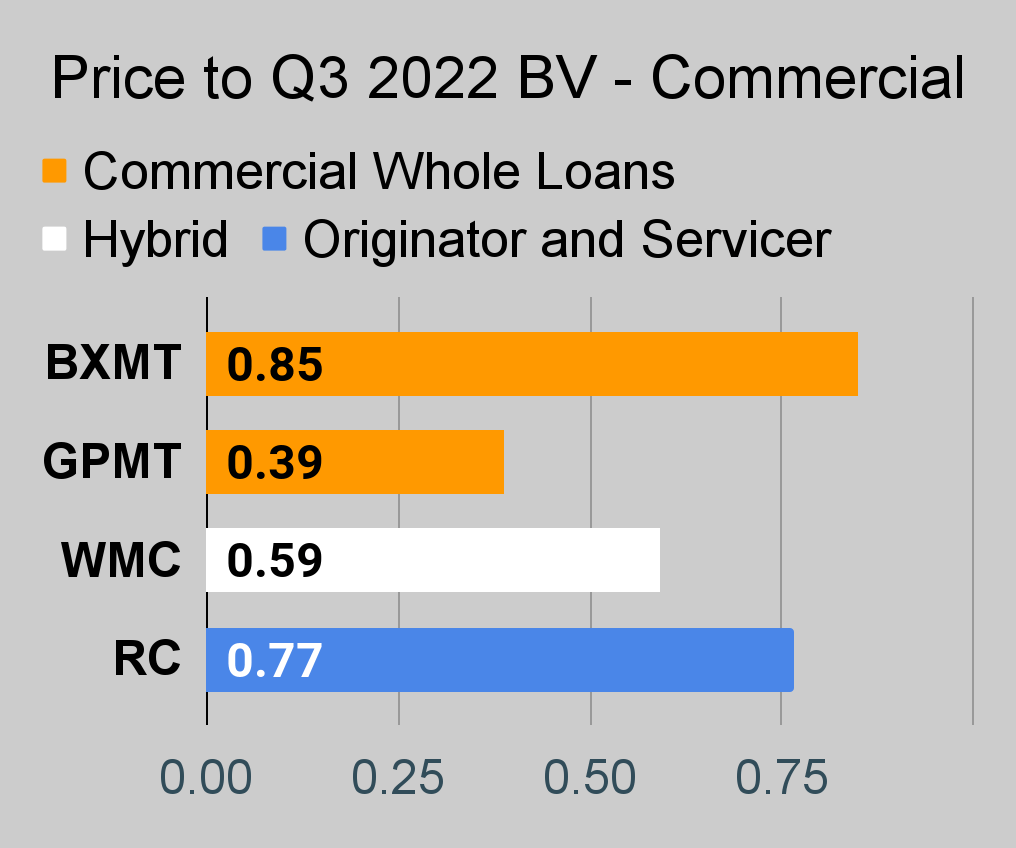
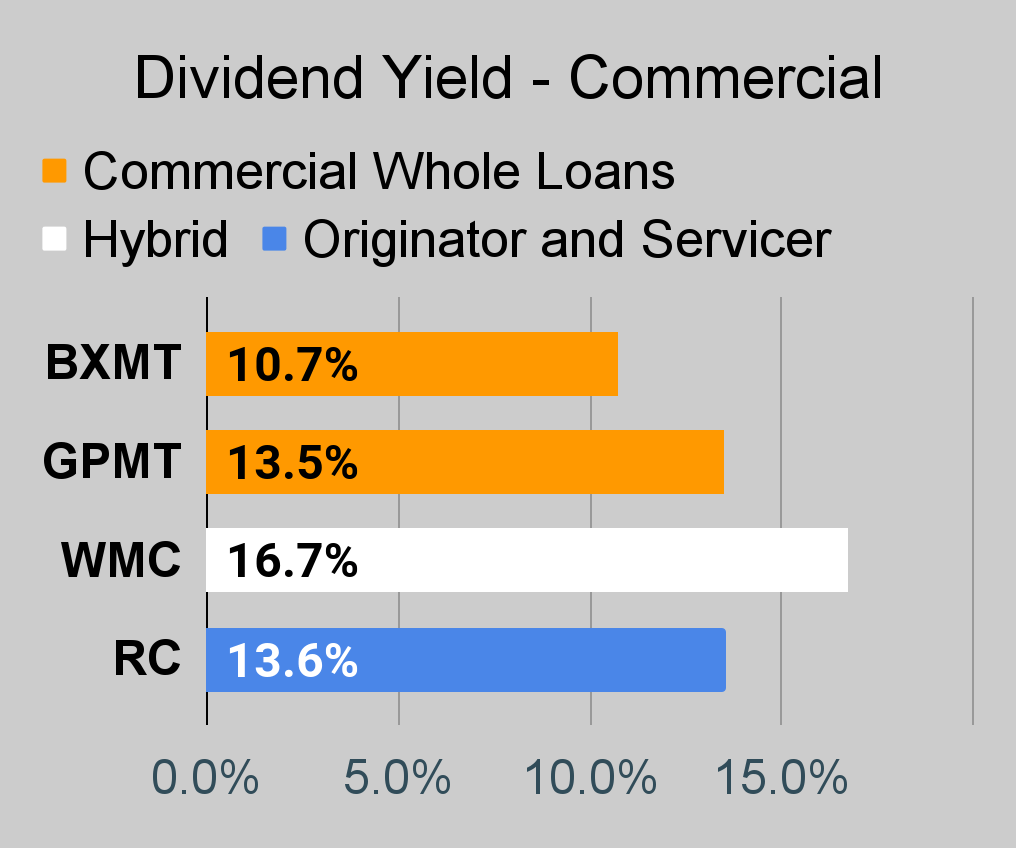
Commercial Mortgage REIT Charts
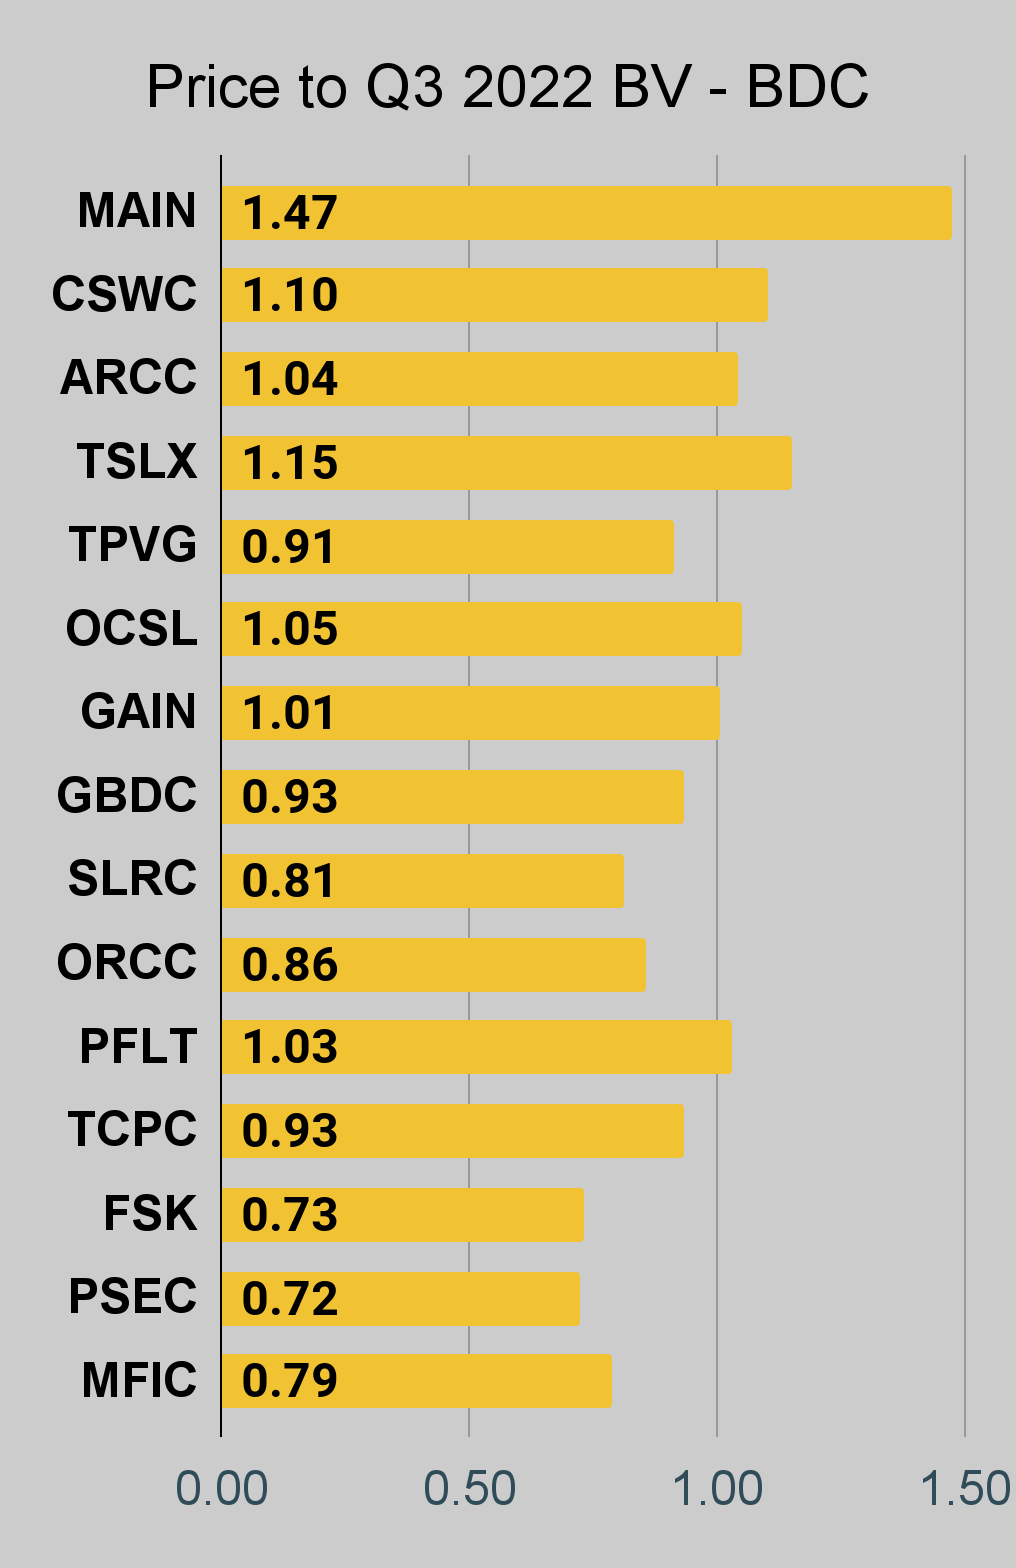
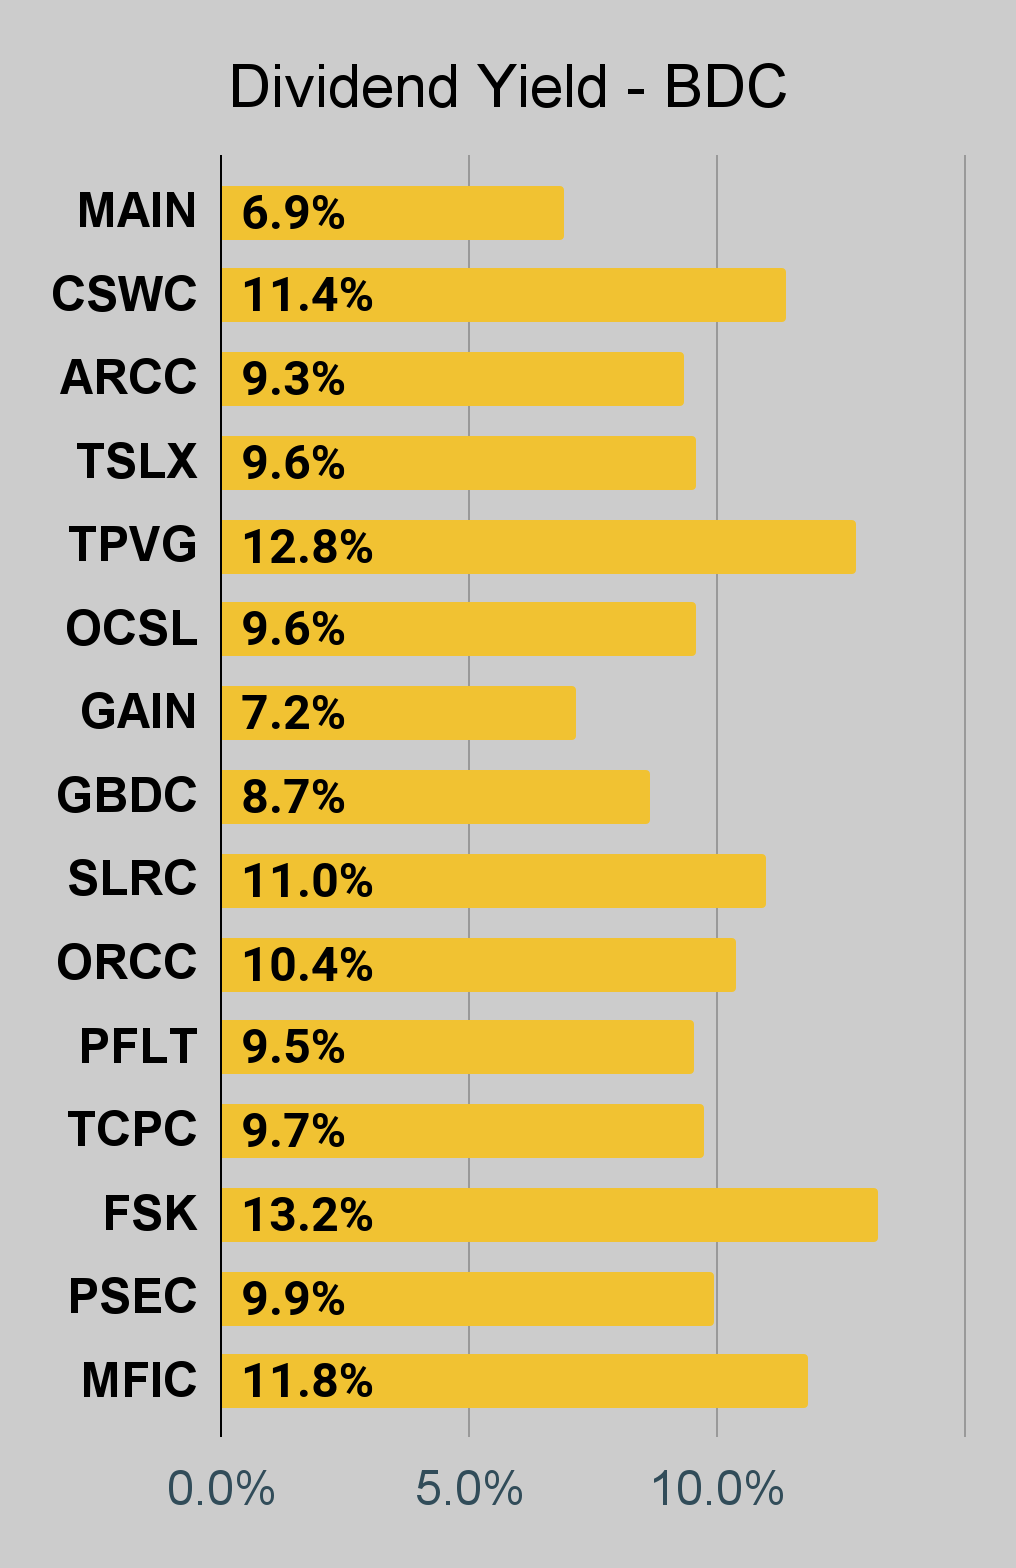
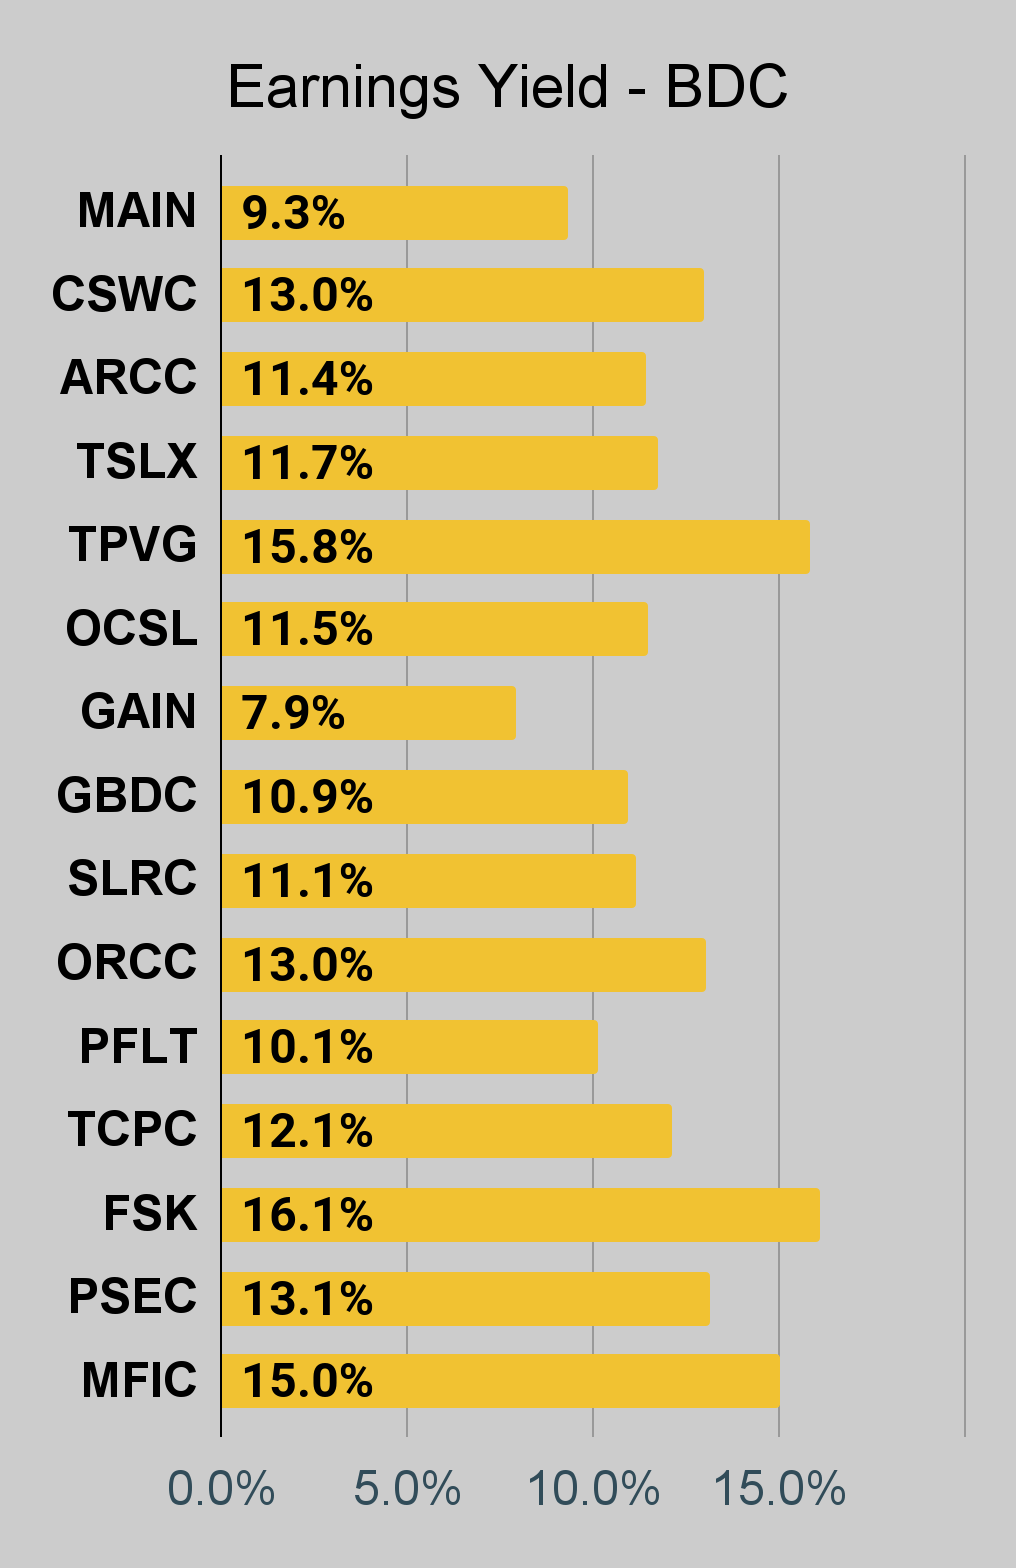
BDC Charts
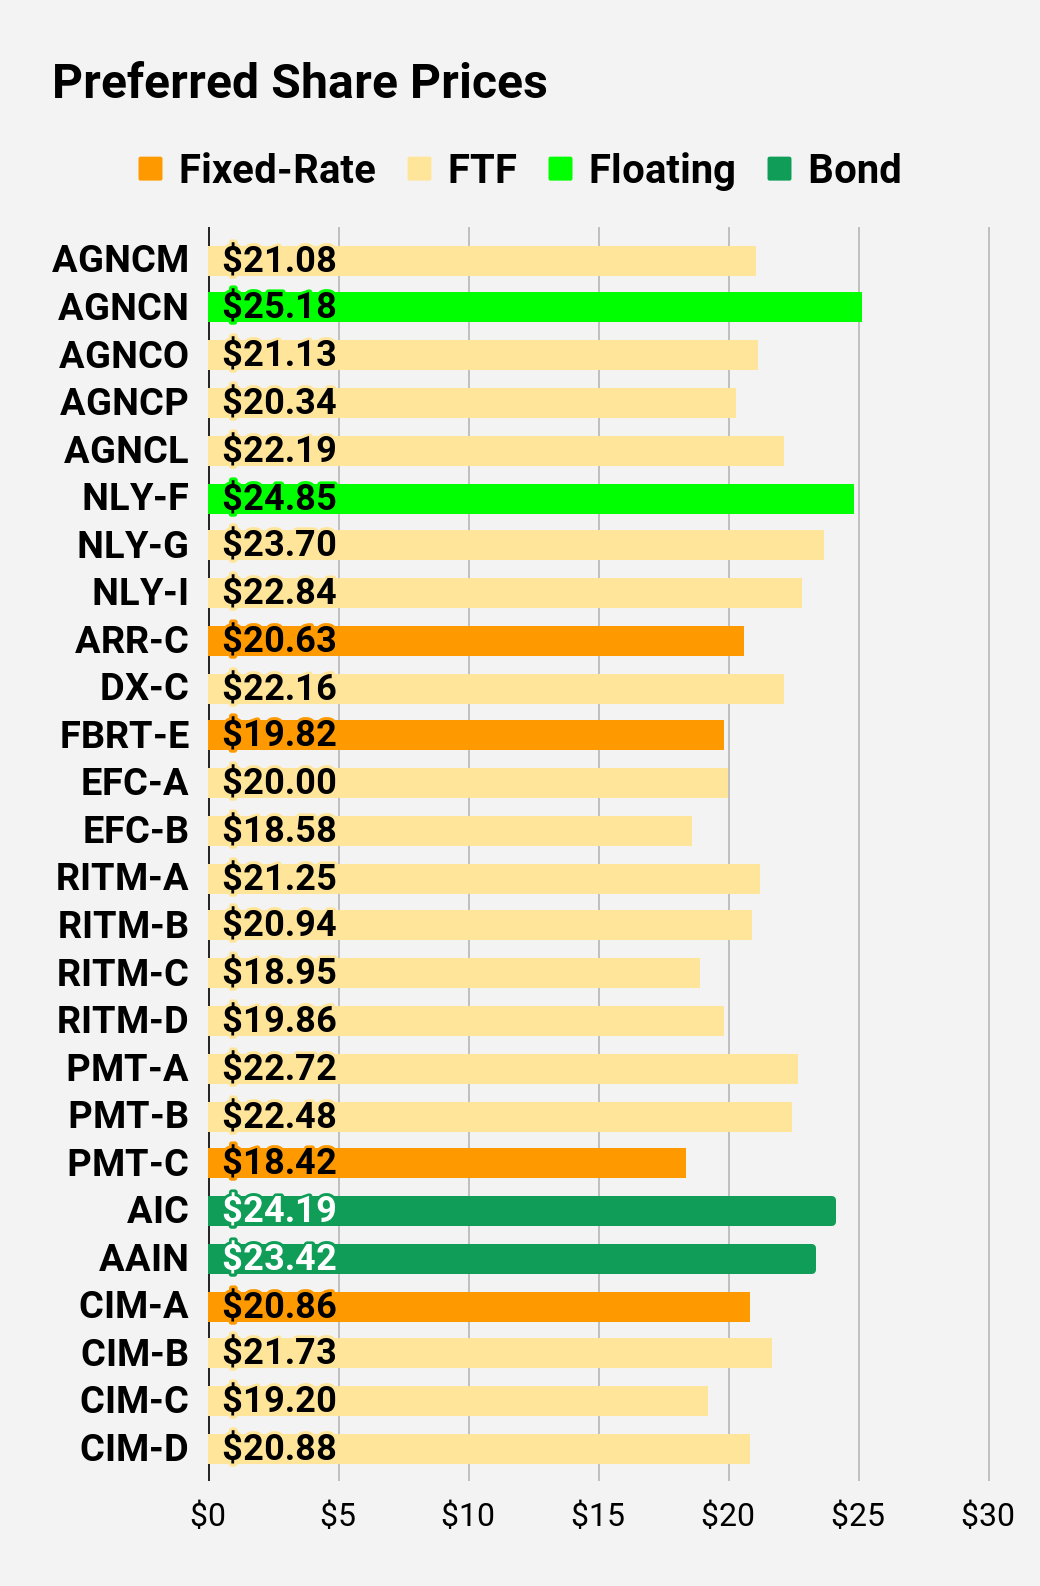
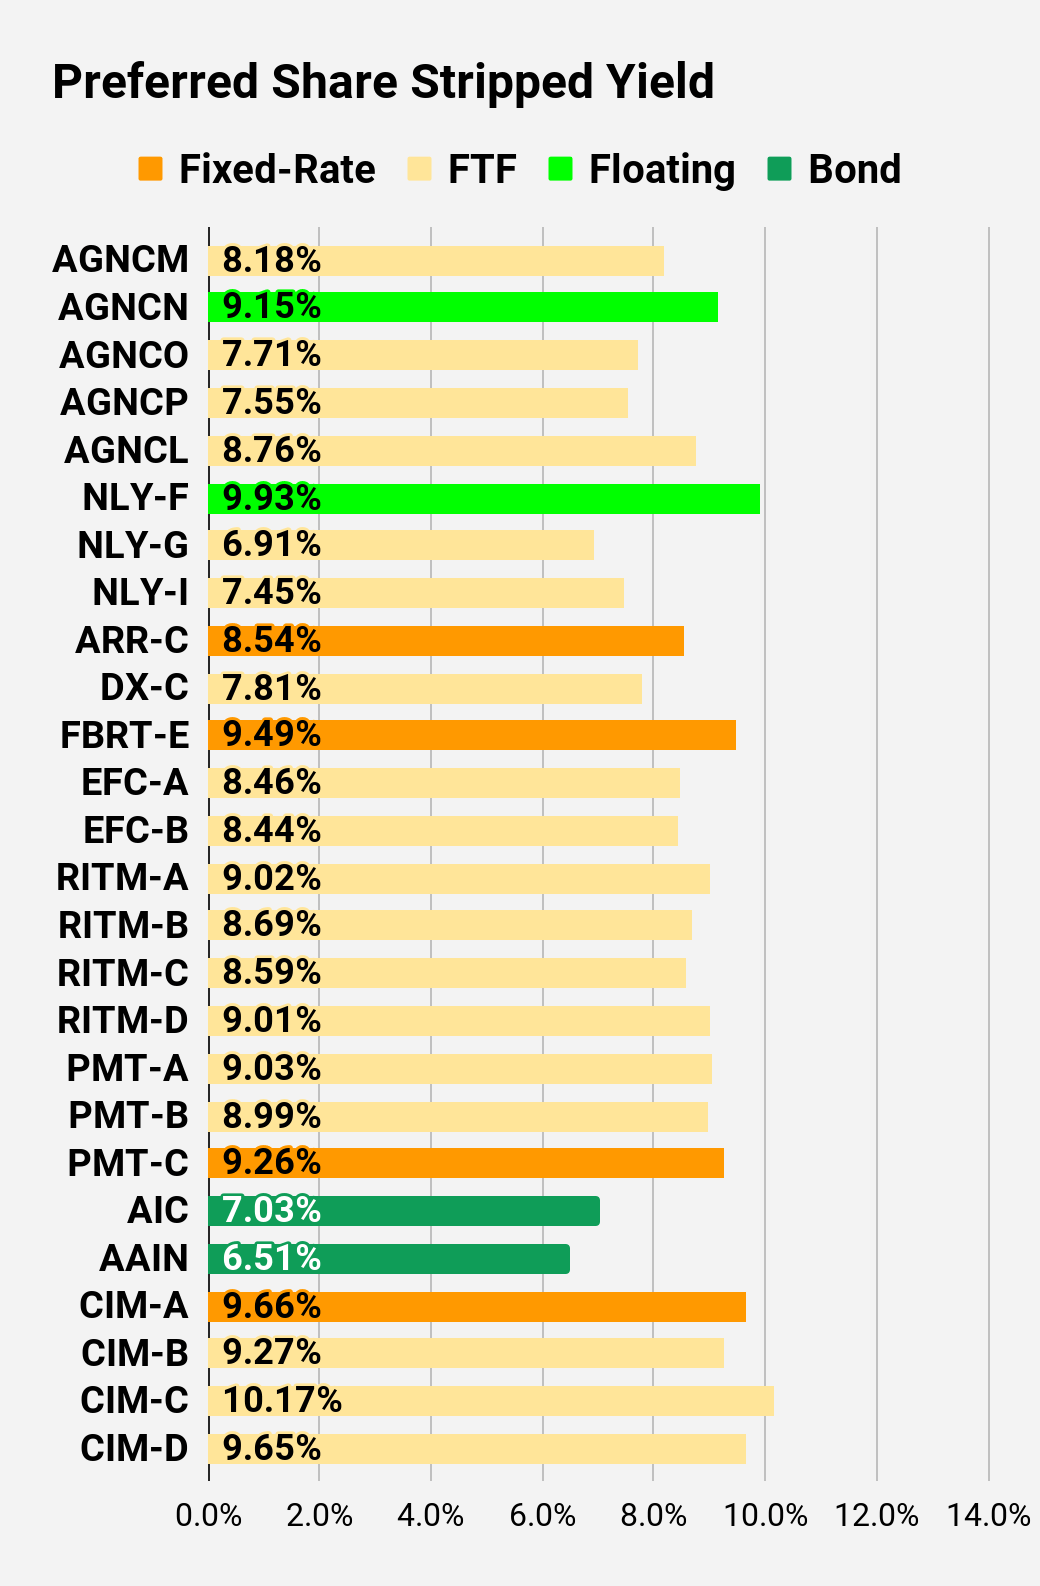
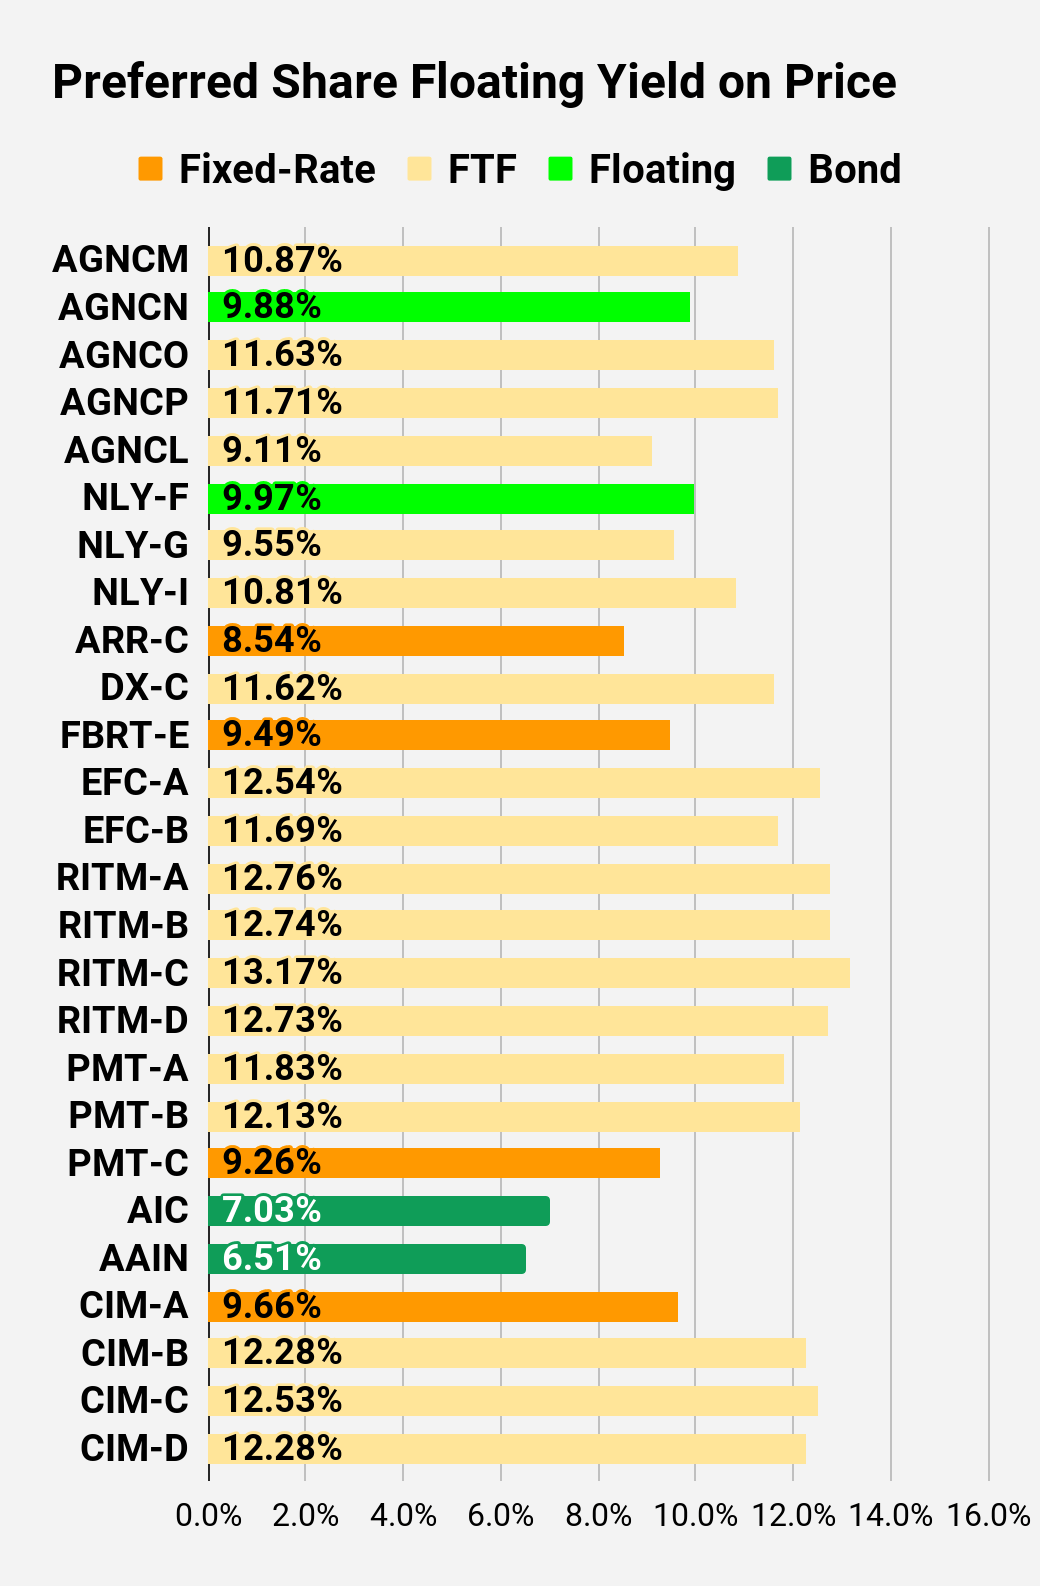
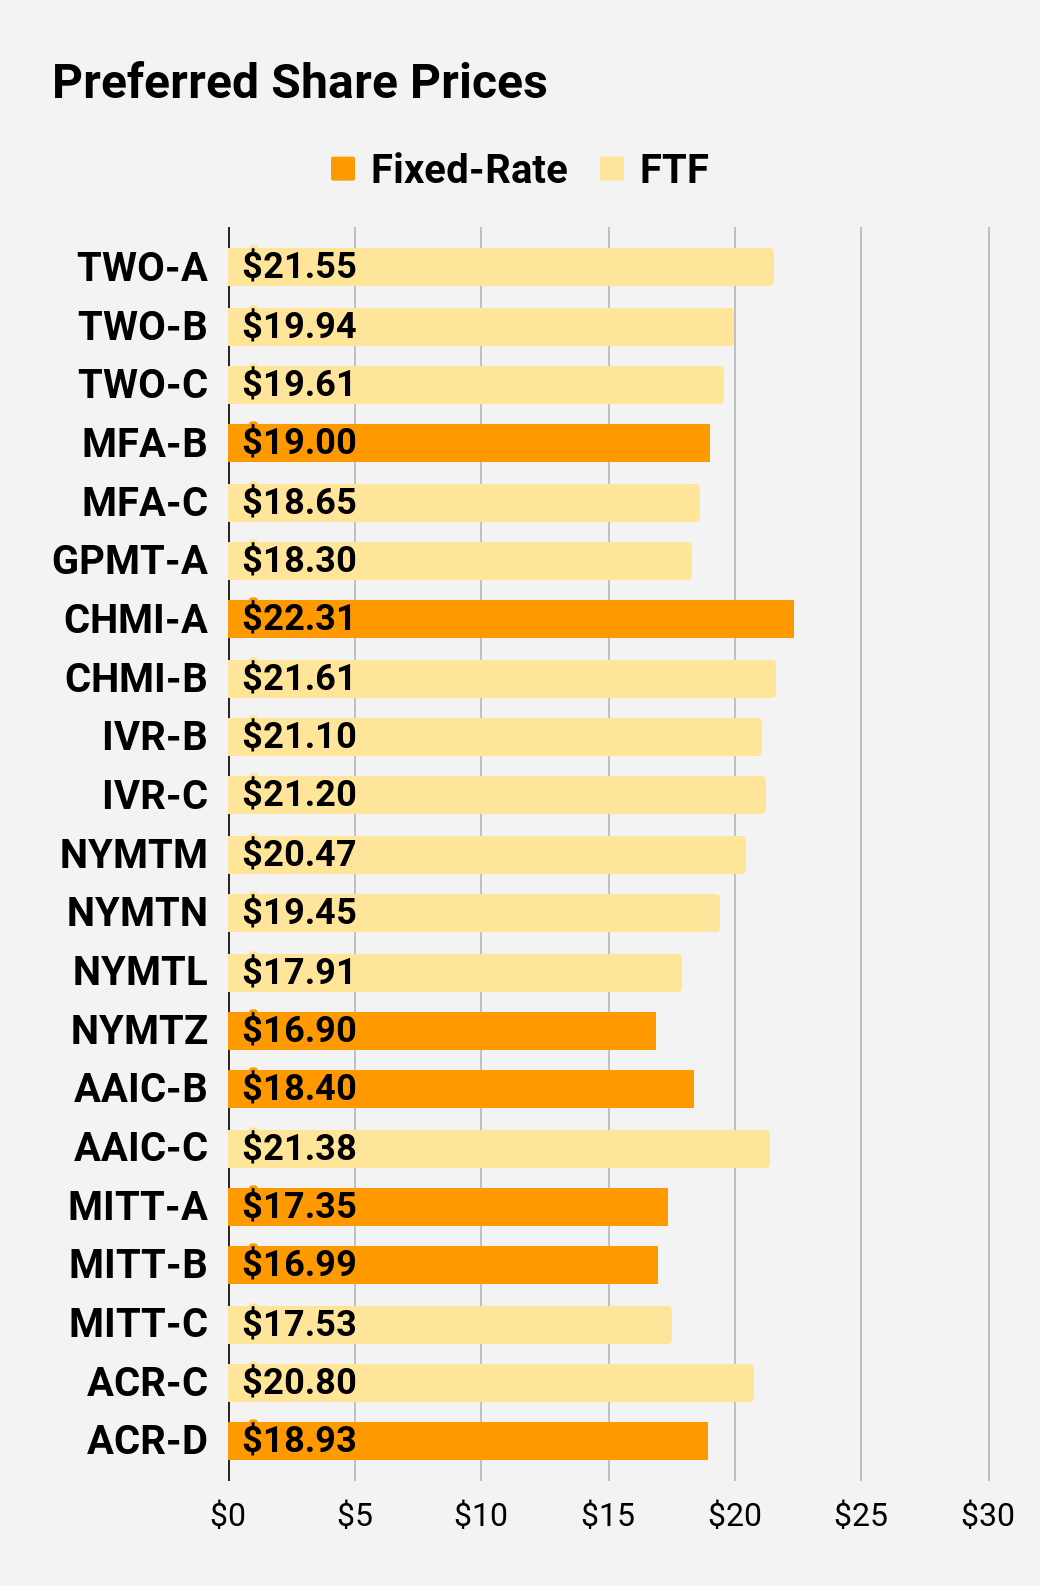
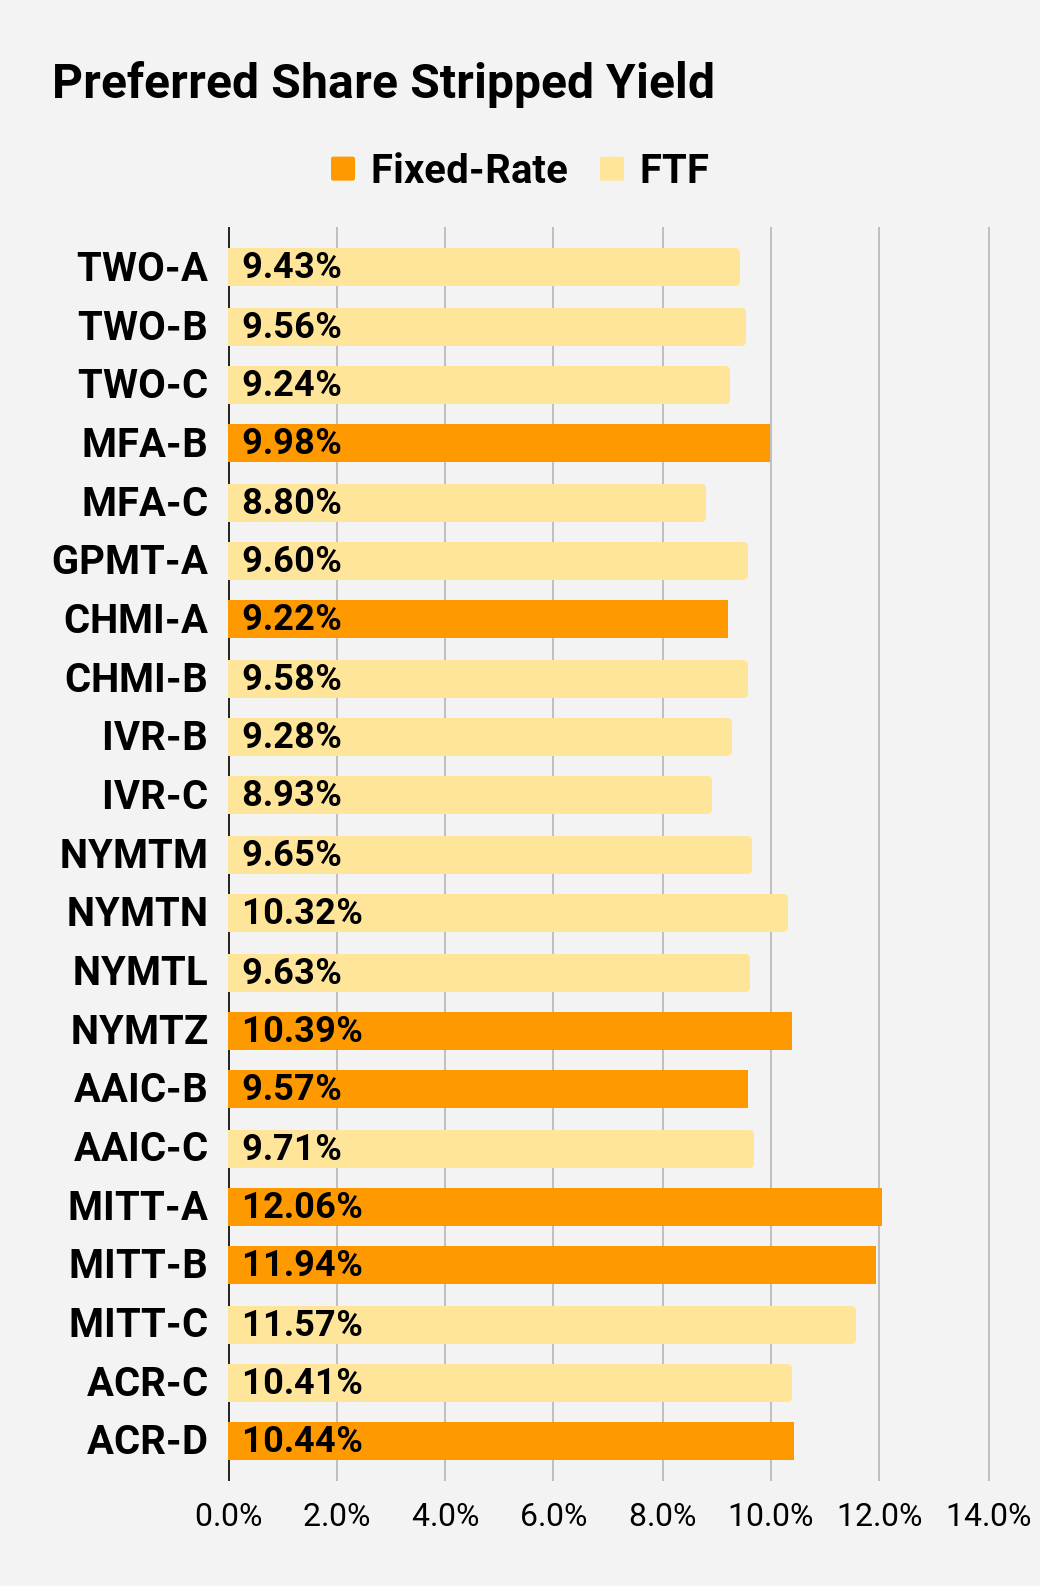
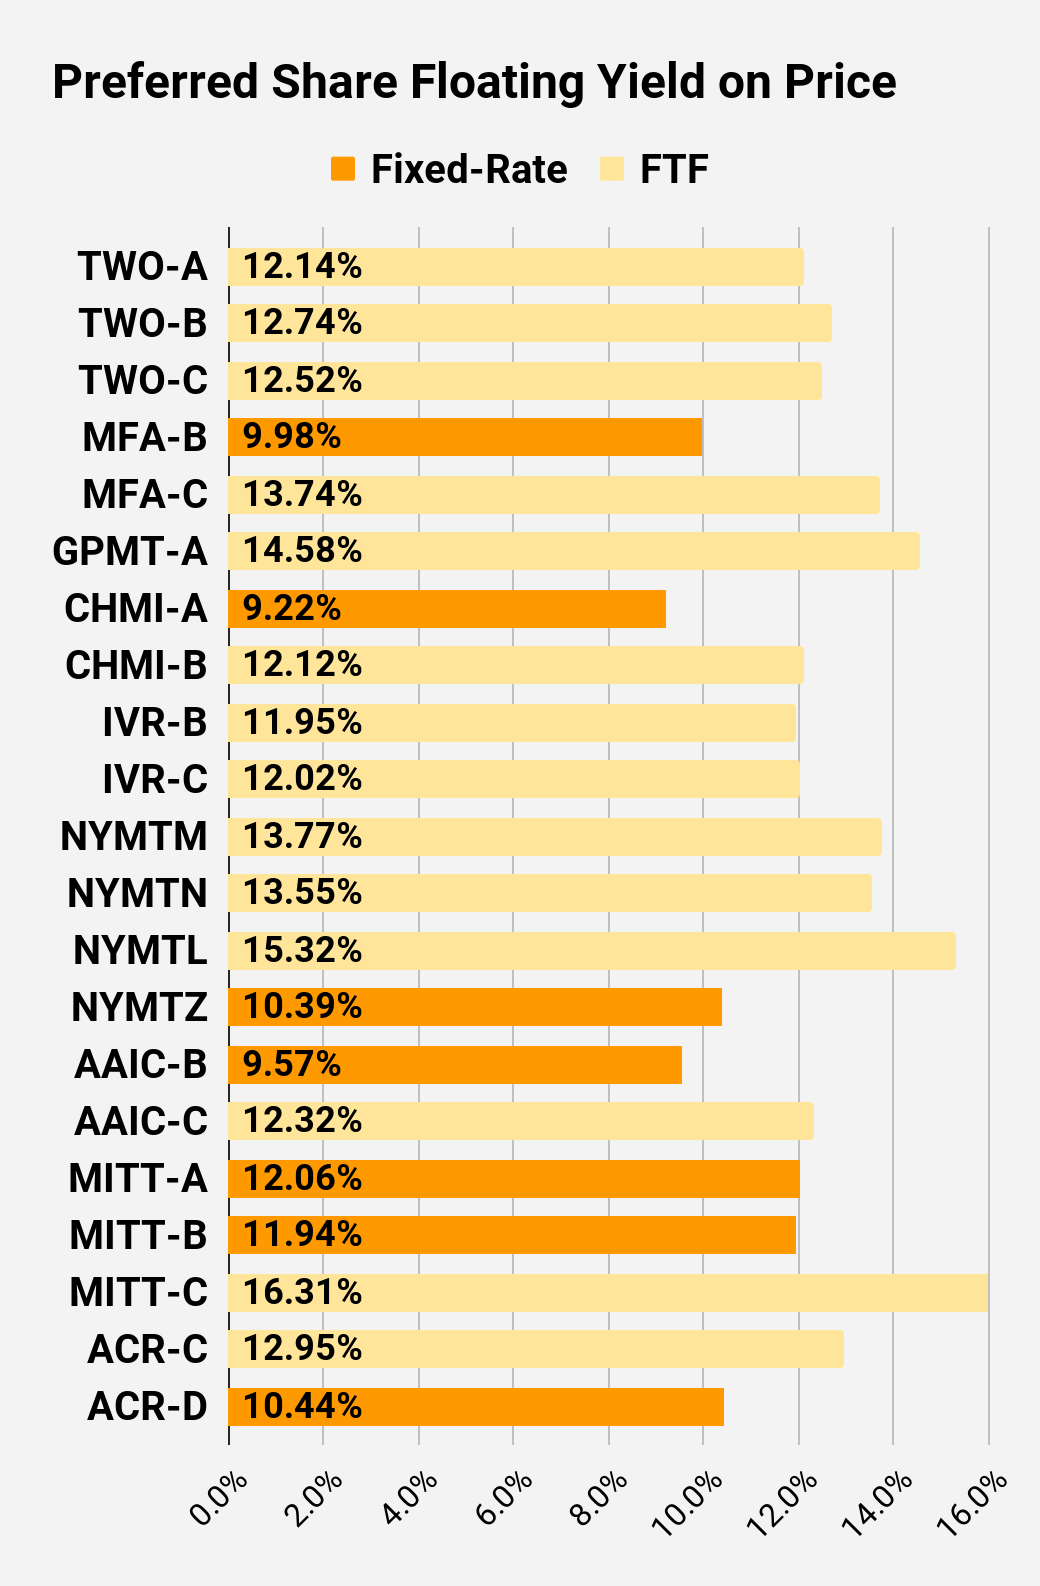
Preferred Share Charts
I changed the coloring a bit. We needed to adjust to include that the first fixed-to-floating shares have transitioned over to floating rates. When a share is already floating, the stripped yield may be different from the “Floating Yield on Price” due to changes in interest rates. For instance, NLY-F already has a floating rate. However, the rate is only reset once per three months. The stripped yield is calculated using the upcoming projected dividend payment and the “Floating Yield on Price” is based on where the dividend would be if the rate reset today. In my opinion, for these shares the “Floating Yield on Price” is clearly the more important metric.
Preferred Share Data
Beyond the charts, we’re also providing our readers with access to several other metrics for the preferred shares.
After testing out a series on preferred shares, we decided to try merging it into the series on common shares. After all, we're still talking about positions in mortgage REITs. We don’t have any desire to cover preferred shares without cumulative dividends, so any preferred shares you see in our column will have cumulative dividends. You can verify that by using Quantum Online. We’ve included the links in the table below.
To better organize the table, we needed to abbreviate column names as follows:
- Price = Recent Share Price - Shown in Charts
- BoF = Bond or FTF (Fixed-to-Floating)
- S-Yield = Stripped Yield - Shown in Charts
- Coupon = Initial Fixed-Rate Coupon
- FYoP = Floating Yield on Price - Shown in Charts
- NCD = Next Call Date (the soonest shares could be called)
- Note: For all FTF issues, the floating rate would start on NCD.
- WCC = Worst Cash to Call (lowest net cash return possible from a call)
- QO Link = Link to Quantum Online Page
| Ticker |
| Price |
| BoF |
| S-Yield |
| Coupon |
| FYoP |
| NCD |
| WCC |
| QO Link |
| P-Link |
| $21.08 |
| FTF |
| 8.18% |
| 6.88% |
| 10.87% |
| 4/15/2024 |
| $6.08 |
| $25.18 |
| Floating |
| 9.15% |
| 9.19% |
| 9.88% |
| 2/10/2023 |
| $0.00 |
| $21.13 |
| FTF |
| 7.71% |
| 6.50% |
| 11.63% |
| 10/15/2024 |
| $6.72 |
| $20.34 |
| FTF |
| 7.55% |
| 6.13% |
| 11.71% |
| 4/15/2025 |
| $8.11 |
| $22.19 |
| FTF |
| 8.76% |
| 7.75% |
| 9.11% |
| 10/15/2027 |
| $12.02 |
| $24.85 |
| Floating |
| 9.93% |
| 9.75% |
| 9.97% |
| 2/10/2023 |
| $0.43 |
| $23.70 |
| FTF |
| 6.91% |
| 6.50% |
| 9.55% |
| 3/31/2023 |
| $1.71 |
| $22.84 |
| FTF |
| 7.45% |
| 6.75% |
| 10.81% |
| 6/30/2024 |
| $4.69 |
| $20.63 |
| 8.54% |
| 7.00% |
| 8.54% |
| 1/28/2025 |
| $8.02 |
| $22.16 |
| FTF |
| 7.81% |
| 6.90% |
| 11.62% |
| 4/15/2025 |
| $6.72 |
| $19.82 |
| 9.49% |
| 7.50% |
| 9.49% |
| 2/10/2023 |
| $5.31 |
| $20.00 |
| FTF |
| 8.46% |
| 6.75% |
| 12.54% |
| 10/30/2024 |
| $8.03 |
| $18.58 |
| FTF |
| 8.44% |
| 6.25% |
| 11.69% |
| 1/30/2027 |
| $12.75 |
| $21.25 |
| FTF |
| 9.02% |
| 7.50% |
| 12.76% |
| 8/15/2024 |
| $7.05 |
| $20.94 |
| FTF |
| 8.69% |
| 7.13% |
| 12.74% |
| 8/15/2024 |
| $7.19 |
| $18.95 |
| FTF |
| 8.59% |
| 6.38% |
| 13.17% |
| 2/15/2025 |
| $9.66 |
| $19.86 |
| FTF |
| 9.01% |
| 7.00% |
| 12.73% |
| 11/15/2026 |
| $12.16 |
| $22.72 |
| FTF |
| 9.03% |
| 8.13% |
| 11.83% |
| 3/15/2024 |
| $4.82 |
| $22.48 |
| FTF |
| 8.99% |
| 8.00% |
| 12.13% |
| 6/15/2024 |
| $5.52 |
| $18.42 |
| 9.26% |
| 6.75% |
| 9.26% |
| 8/24/2026 |
| $12.81 |
| $24.19 |
| Bond |
| 7.03% |
| 6.75% |
| 7.03% |
| 2/10/2023 |
| $1.06 |
| $23.42 |
| Bond |
| 6.51% |
| 6.00% |
| 6.51% |
| 8/1/2023 |
| $2.70 |
| $20.86 |
| 9.66% |
| 8.00% |
| 9.66% |
| 2/10/2023 |
| $4.37 |
| $21.73 |
| FTF |
| 9.27% |
| 8.00% |
| 12.28% |
| 3/30/2024 |
| $5.77 |
| $19.20 |
| FTF |
| 10.17% |
| 7.75% |
| 12.53% |
| 9/30/2025 |
| $11.14 |
| $20.88 |
| FTF |
| 9.65% |
| 8.00% |
| 12.28% |
| 03/30/2024 |
| $6.62 |
Second Batch:
| Ticker |
| Price |
| BoF |
| S-Yield |
| Coupon |
| FYoP |
| NCD |
| WCC |
| QO Link |
| P-Link |
| $21.55 |
| FTF |
| 9.43% |
| 8.13% |
| 12.14% |
| 04/27/2027 |
| $12.07 |
| $19.94 |
| FTF |
| 9.56% |
| 7.63% |
| 12.74% |
| 07/27/2027 |
| $13.63 |
| $19.61 |
| FTF |
| 9.24% |
| 7.25% |
| 12.52% |
| 1/27/2025 |
| $9.01 |
| $19.00 |
| 9.98% |
| 7.50% |
| 9.98% |
| 2/10/2023 |
| $6.22 |
| $18.65 |
| FTF |
| 8.80% |
| 6.50% |
| 13.74% |
| 3/31/2025 |
| $10.01 |
| $18.30 |
| FTF |
| 9.60% |
| 7.00% |
| 14.58% |
| 11/30/2026 |
| $13.47 |
| $22.31 |
| 9.22% |
| 8.20% |
| 9.22% |
| 2/10/2023 |
| $2.76 |
| $21.61 |
| FTF |
| 9.58% |
| 8.25% |
| 12.12% |
| 4/15/2024 |
| $5.89 |
| $21.10 |
| FTF |
| 9.28% |
| 7.75% |
| 11.95% |
| 12/27/2024 |
| $7.80 |
| $21.20 |
| FTF |
| 8.93% |
| 7.50% |
| 12.02% |
| 9/27/2027 |
| $12.73 |
| $20.47 |
| FTF |
| 9.65% |
| 7.88% |
| 13.77% |
| 1/15/2025 |
| $8.47 |
| $19.45 |
| FTF |
| 10.32% |
| 8.00% |
| 13.55% |
| 10/15/2027 |
| $15.05 |
| $17.91 |
| FTF |
| 9.63% |
| 6.88% |
| 15.32% |
| 10/15/2026 |
| $13.54 |
| $16.90 |
| 10.39% |
| 7.00% |
| 10.39% |
| 1/15/2027 |
| $15.10 |
| $18.40 |
| 9.57% |
| 7.00% |
| 9.57% |
| 2/10/2023 |
| $6.71 |
| $21.38 |
| FTF |
| 9.71% |
| 8.25% |
| 12.32% |
| 3/30/2024 |
| $6.09 |
| $17.35 |
| 12.06% |
| 8.25% |
| 12.06% |
| 2/10/2023 |
| $7.92 |
| $16.99 |
| 11.94% |
| 8.00% |
| 11.94% |
| 2/10/2023 |
| $8.27 |
| $17.53 |
| FTF |
| 11.57% |
| 8.00% |
| 16.31% |
| 9/17/2024 |
| $10.94 |
| $20.80 |
| FTF |
| 10.41% |
| 8.63% |
| 12.95% |
| 7/30/2024 |
| $7.44 |
| $18.93 |
| 10.44% |
| 7.88% |
| 10.44% |
| 5/21/2026 |
| $12.59 |
Strategy
Our goal is to maximize total returns . We achieve those most effectively by including “trading” strategies. We regularly trade positions in the mortgage REIT common shares and BDCs because:
- Prices are inefficient.
- Long term, share prices generally revolve around book value.
- Short term, price-to-book ratios can deviate materially.
- Book value isn’t the only step in analysis, but it is the cornerstone.
We also allocate to preferred shares and equity REITs. We encourage buy-and-hold investors to consider using more preferred shares and equity REITs.
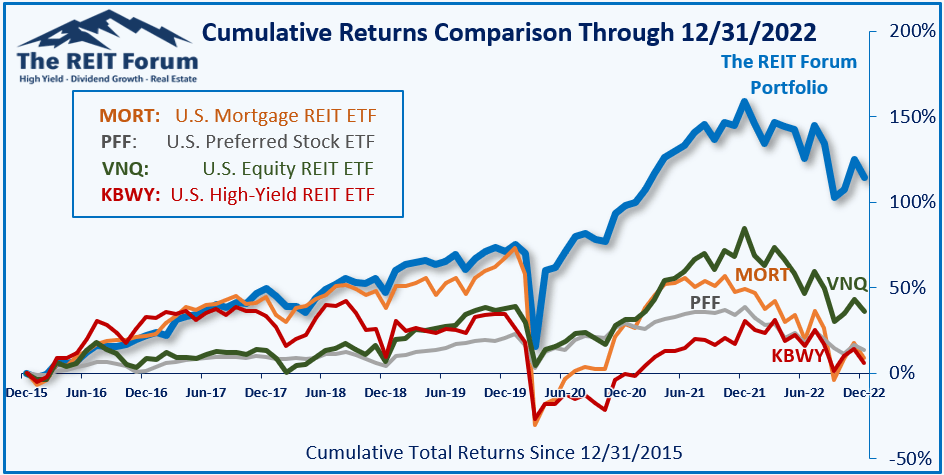
Performance
We compare our performance against four ETFs that investors might use for exposure to our sectors:
The REIT Forum
The four ETFs we use for comparison are:
| Ticker |
| Exposure |
| One of the largest mortgage REIT ETFs |
| One of the largest preferred share ETFs |
| Largest equity REIT ETF |
| The high-yield equity REIT ETF. Yes, it has been dreadful. |
When investors think it isn’t possible to earn solid returns in preferred shares or mortgage REITs, we politely disagree. The sector has plenty of opportunities, but investors still need to be wary of the risks. We can’t simply reach for yield and hope for the best. When it comes to common shares, we need to be even more vigilant to protect our principal by regularly watching prices and updating estimates for book value and price targets.
Ratings: Bearish on AGNC, NLY, ARR
For further details see:
3 REITs To Dump On The Insane Rally