FBRT - 4 Fat Yields: 13% To 0%
Summary
- Spreads widened dramatically.
- Each dollar of book value can generate higher returns in this environment.
- The yield curve is inverted. That's bad, but not awful. It is more relevant to management than to shareholders.
Get ready for charts, images, and tables because they are better than words. The ratings and outlooks we highlight here come after Scott Kennedy’s weekly updates in the REIT Forum. Your continued feedback is greatly appreciated, so please leave a comment with suggestions.
A member recently asked me about how well some of the mortgage REITs could handle a scenario where interest rises to 4%. That’s a great question and I want to share part of the answer:
If the Federal Reserve jacked rates up to 4% at the next meeting, I would expect severe damage. However, I don't think that's even a remote possibility. We're probably looking at either 2.75% to 3.00% or 3.00% to 3.25%. The absolute level of interest rates may be less relevant than the path the rates take to get there. High volatility is generally bad for mortgage REITs while low volatility is good.
However, we also have to consider how much volatility is priced in. With the difference between mortgage rates and Treasury rates at relatively high levels, the amount of volatility priced into book values is significant. If volatility drops off, it can cause book values to increase. For mortgage REITs that are already trading at large discounts to book value, that's great. For mortgage REITs trading at premiums to book value, it can reduce the pain from a correction in the price-to-book ratio.
If you’re new to mortgage REITs, that might be a bit confusing.
We should dive into those concepts.
The first idea is that we need to consider spreads between MBS (mortgage-backed security) rates and Treasury rates . There are multiple ways to do this. We could look for an OAS (option-adjusted spread) or we could look at the difference in the “current coupon” rates. Either method is fine, though they won’t give identical results.
OAS attempts to adjust for expected levels of volatility in interest rates. It requires making assumptions about the future level of volatility. If those assumptions are wrong, it throws off the calculations. However, it can be useful for recognizing when volatility is particularly high.
The “Current Coupon” eliminates the need for the adjustment by using an MBS that should trade at face value. If you buy $100 of agency MBS for $100, no matter what happens with prepayments, the yield on your security is precisely equal to the coupon rate. That’s important because if you pay more or less than $100, you would need to amortize the difference. If you paid $102 and don’t know when you’ll get repaid your $100 of principal, you have to guess about how quickly you should recognize the extra $2 spent on the investment.
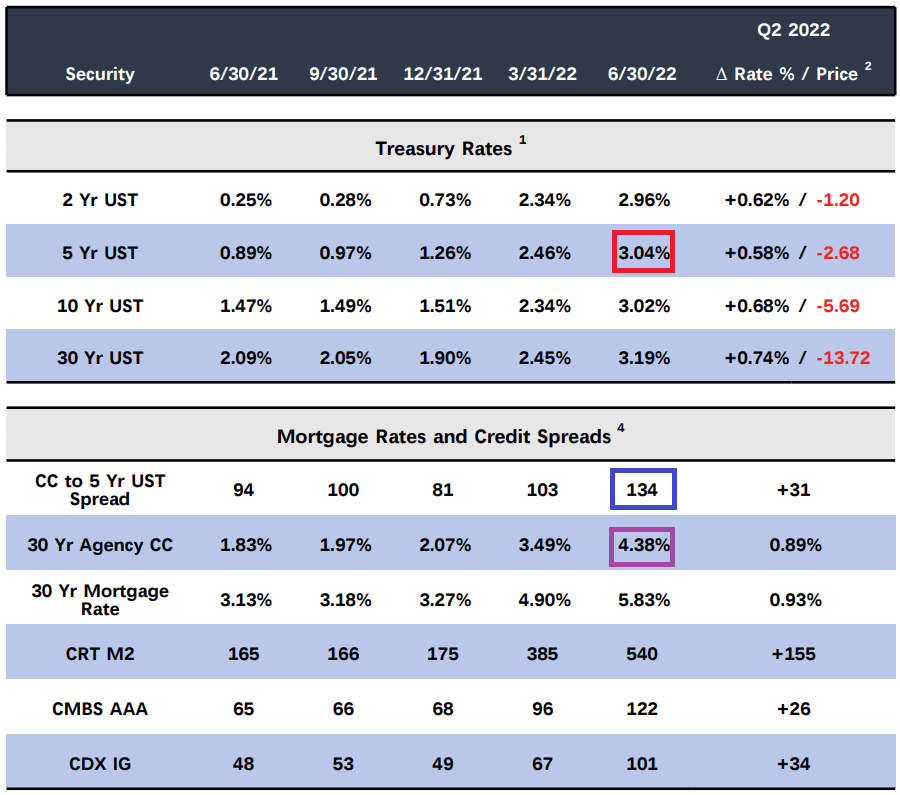
How are those spreads today? AGNC provides a slide to demonstrate how the value changes over time. I put a purple box around the latest quarterly reading:
The number there, 134, is pretty big by historical standards. You can calculate it by taking subtracting the red box from the purple box, but it’s nice to have the value laid out.
This is a good time to define four terms:
- Widening: MBS yields minus Treasury yields result in a bigger number. This used to be referenced relative to LIBOR relates, but now it makes more sense to just use Treasuries. When widening occurs, book value tends to decrease but the amount of income each dollar of book value can generate increases.
- Tightening: MBS yields minus Treasury yields result in a bigger number. Book value tends to increase, but the income that can be generated from each dollar of book value is lower.
- Steepening: When the yield curve becomes steeper. This can be measured by comparing long-term rates to short-term rates. We won’t cover this much in the article, but you need to know the word to know that we are not talking about the shape of the yield curve. A steeper curve can be better for earnings, but it is usually a smaller factor than widening and tightening. Many people get this wrong.
- Flattening: This is the opposite of steepening. Excessive flattening leads to “inversion”. Flattening or inversion is bad for earnings, but it is still less important than the widening/tightening.
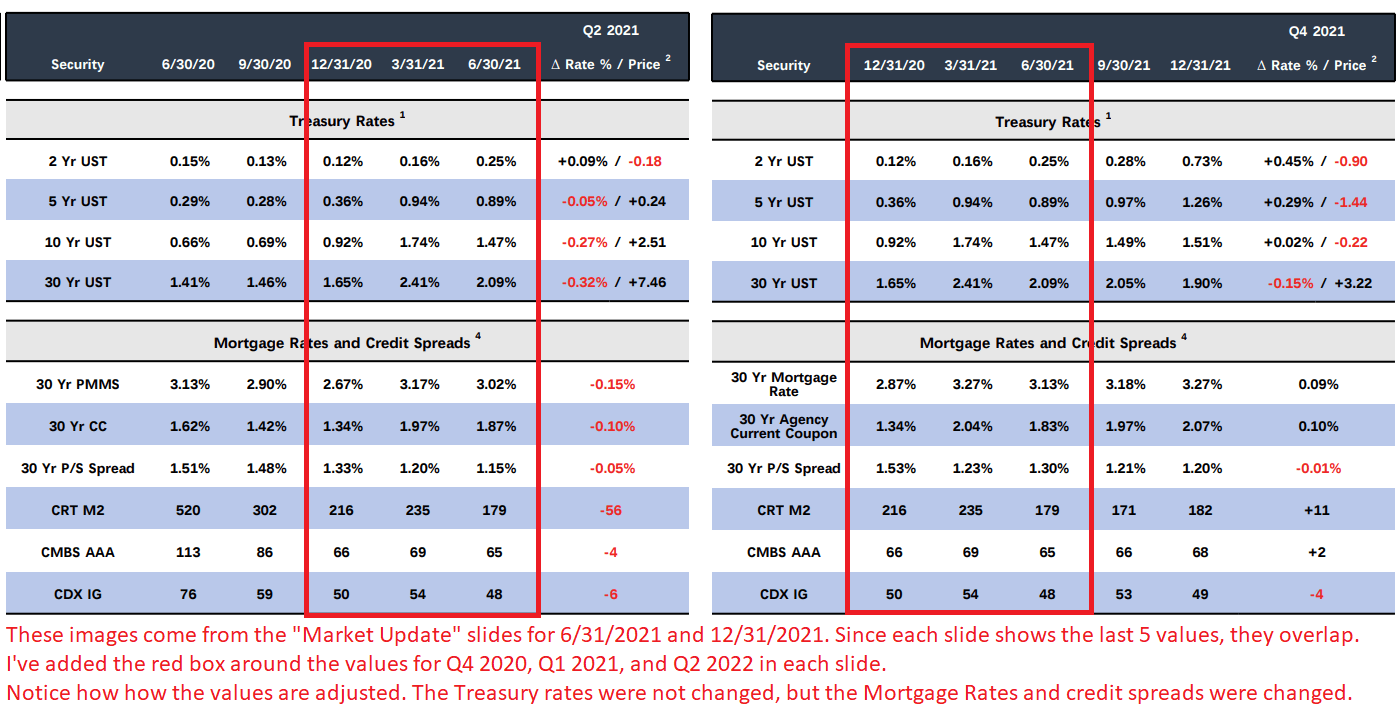
Unfortunately, AGNC changed the layout of this slide (called “Market Update”) multiple times in the last few years. That’s annoying because it changed which data was available and how that data was presented. If you want to compare data across several years, it becomes much more complex. Further, some of the data was revised, which gets really annoying. It may also hide some of the inconsistencies as some data may be updated retroactively. For instance, you can compare the tables published for Q4 2021 with the tables published for Q2 2021:
AGNC
The retroactive adjustments aren’t particularly large, but they can be material. The Q1 2021 value called “30 Yr CC” in one slide and “30 Yr Agency Current Coupon” in the other changed from 1.97% to 2.04%. It’s not a huge swing, but it could be material. However, I don’t want it to sound like I’m criticizing the adjustment. I wouldn’t be yours truly if I was just pulling this data from presentations. I have my own data sources and can pull the data in real-time. Using my formulas, I had a value of 2.06% for Q1 2021. Consequently, I think their 2.04% makes far more sense than the prior value of 1.97%.
In another article, I'll take you through my data for a comparison. However, we still have a few things to cover here.
Key Points
Two things I want you to remember:
- The spread between MBS and Treasury rates increased materially during the first half of 2022.
- Part of that is because fear increased in the market and part is because investors are bracing for the Federal Reserve to remain aggressive in their attempts to control inflation.
Federal Reserve
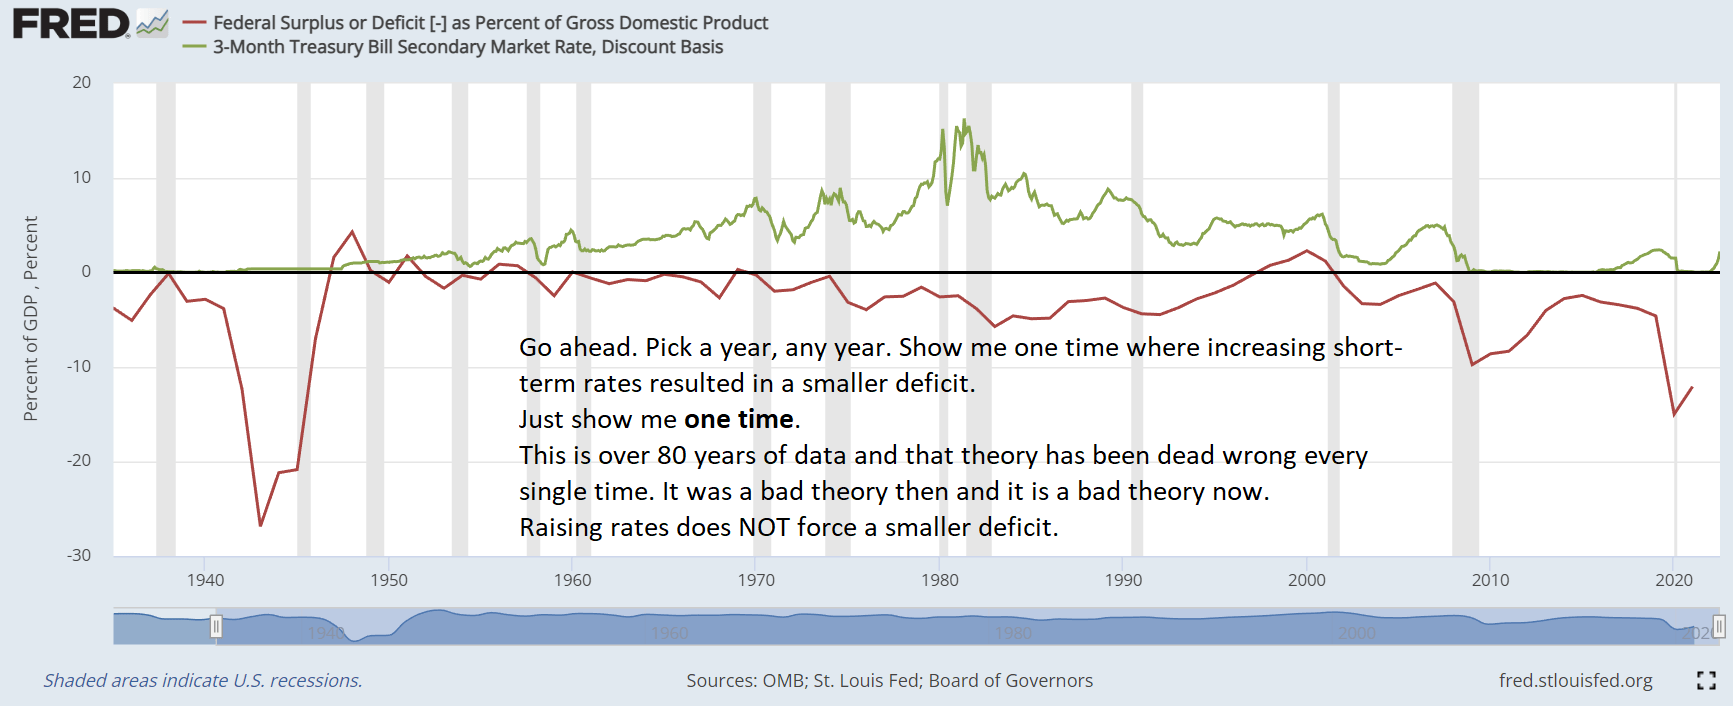
Since the Federal Reserve does not control the amount of the federal deficit or the amount of aggregate supply, the Federal Reserve is not equipped to handle this problem. To maintain relevance, they can push interest rates higher. However, it isn’t tackling either of the major problems, so it won’t be particularly effective.
To the one or two people who think raising rates will prevent deficit spending, I ask you:
When has that ever worked?
No, seriously, point to the time it worked:
Federal Reserve
Even a broken clock has a better accuracy rate than that belief.
Ratings
I'll touch on a few ratings as well. I'm even bolding them because I heard it was hard to find them amid so many words. Maybe the numbered bullet points will help?
- I'm bullish on Dynex Capital ( DX ) here. That's because shares trade at a material discount to projected current book value (about a 12% discount) combined with spreads being quite wide. Since spreads are already quite wide, the downside to book value is materially reduced. Further, management did a great job predicting how the last few quarters would play out and positioning the portfolio accordingly. Someone is going to tell me that the P/E ratio on DX is too high and I'm just going to laugh. As I'll be demonstrating, investors are focusing way too much on earnings (despite not knowing accounting) and not enough on the book value.
- I'm also bullish on Rithm Capital ( RITM ) . Still hate the name. However, that discount to book value is large enough to create an appealing bargain. While investors may hate that the company has a mortgage origination business, the MSRs (mortgage-servicing rights) have performed very well, and the origination business is already in the worst possible environment (a huge run higher in rates eliminating most refinancing).
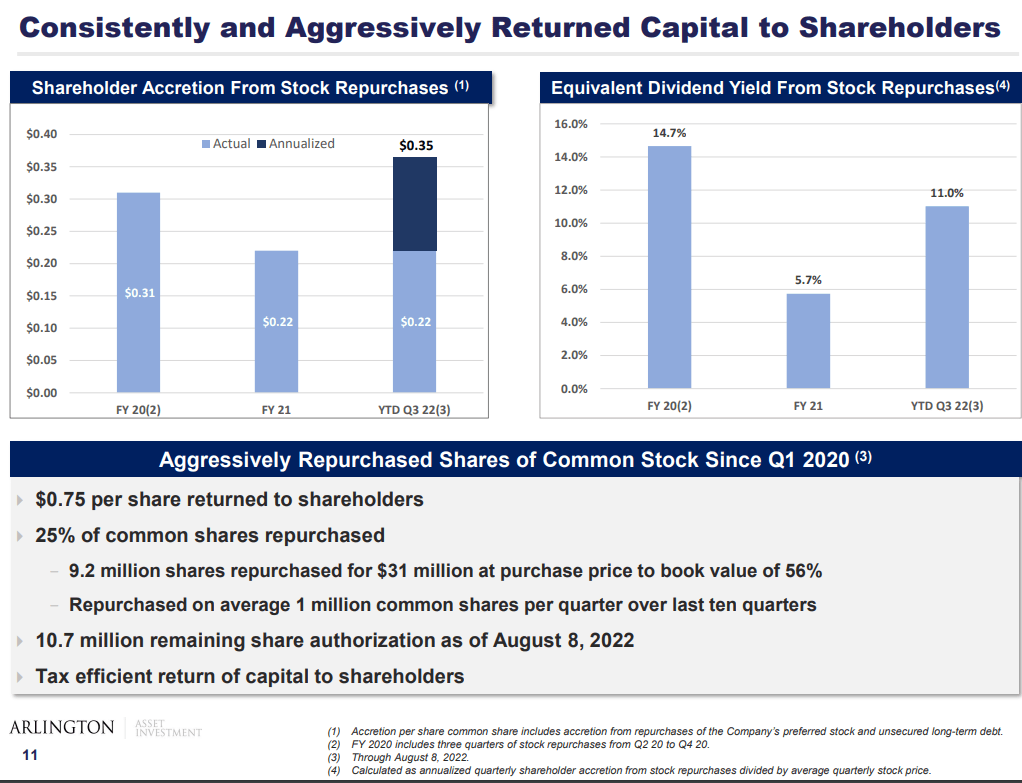
- Next, I'm bullish on the mortgage REIT with a 0% dividend yield. Arlington Asset Investment Corporation ( AAIC ) trades at a massive discount to book value. Given the home sales that were completed this quarter, book value should get a nice bump higher for Q3 2022 due to the gains on sale. Management is focusing on increasing book value and that's a good thing. They aren't paying a dividend, but they are using a large chunk of capital for repurchasing stock. Given the discount on their shares, I think that's a much better choice than paying out the dividend.
- You want me to really blow your mind? I'm even going to be bullish on AG Mortgage Investment Trust ( MITT ). That's a sharp contrast to the times in prior years where I suggested investors short the stock. What's different? Well, MITT's share price got demolished leading to a massive discount to book value. I'm not calling this a "great REIT", but I think it's got plenty of upside thanks to that discount. Planning to buy it and retire on that income? That would be a terrible plan. These are tools for trading around swings in the price-to-book ratio. Investors who refuse to learn that just keep looking at capital losses and proclaiming they got a dividend.
For AAIC, here's a chart showing how they return cash to shareholders through repurchases:
AAIC
Pretty clear, right? The cash they are spending on buybacks currently is running at the equivalent to an 11% yield. That would be a fat yield, so I'm comfortable calling this a fat 0% yielder. Since shares are available at a huge discount to book value, the buybacks are driving value much faster than a dividend. Sure, a dividend might cause the price to bump higher, but management should focus on the long term. We're here to make money on trades, but that's our job. Management's job is to maximize the value over a longer period.
There are several other good picks as well, but that should be enough for now. We added to one of our preferred share positions today and I'll look to include that position in one of my next few articles.
The rest of the charts in this article may be self-explanatory to some investors. However, if you’d like to know more about them, you’re encouraged to see our notes for the series .
Stock Table
We will close out the rest of the article with the tables and charts we provide for readers to help them track the sector for both common shares and preferred shares.
We’re including a quick table for the common shares that will be shown in our tables:
| Type of REIT or BDC |
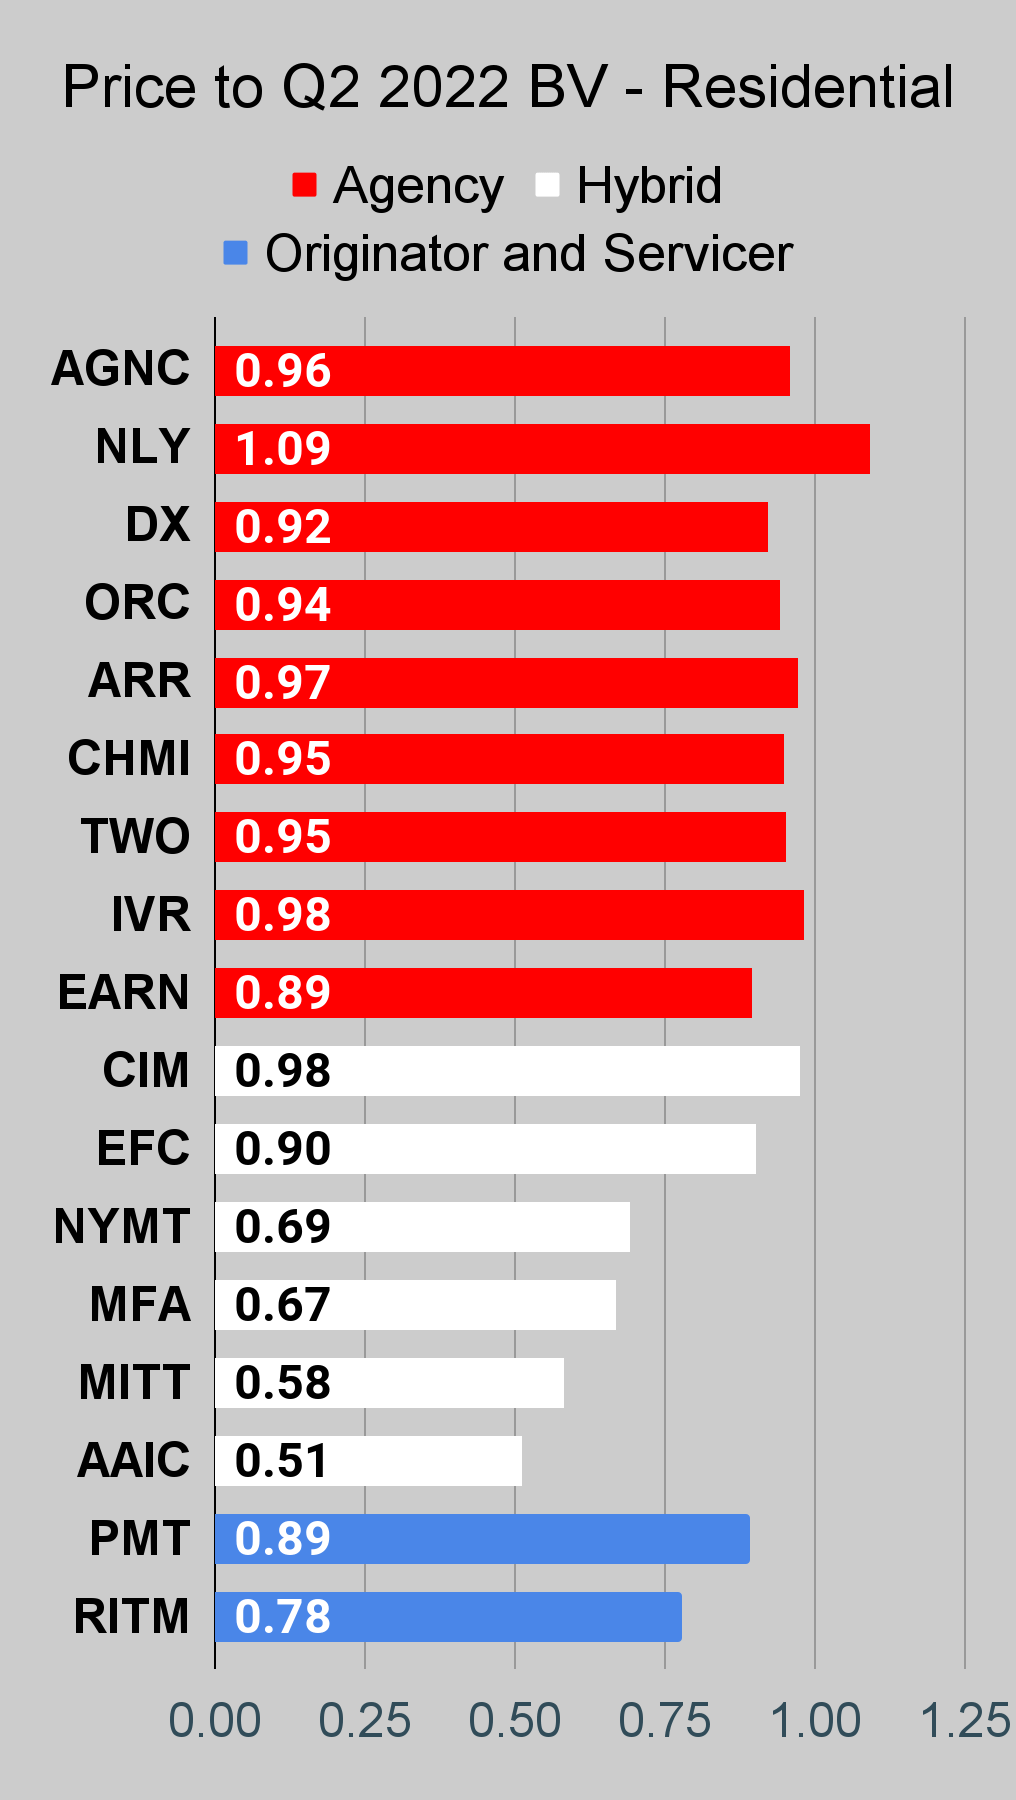
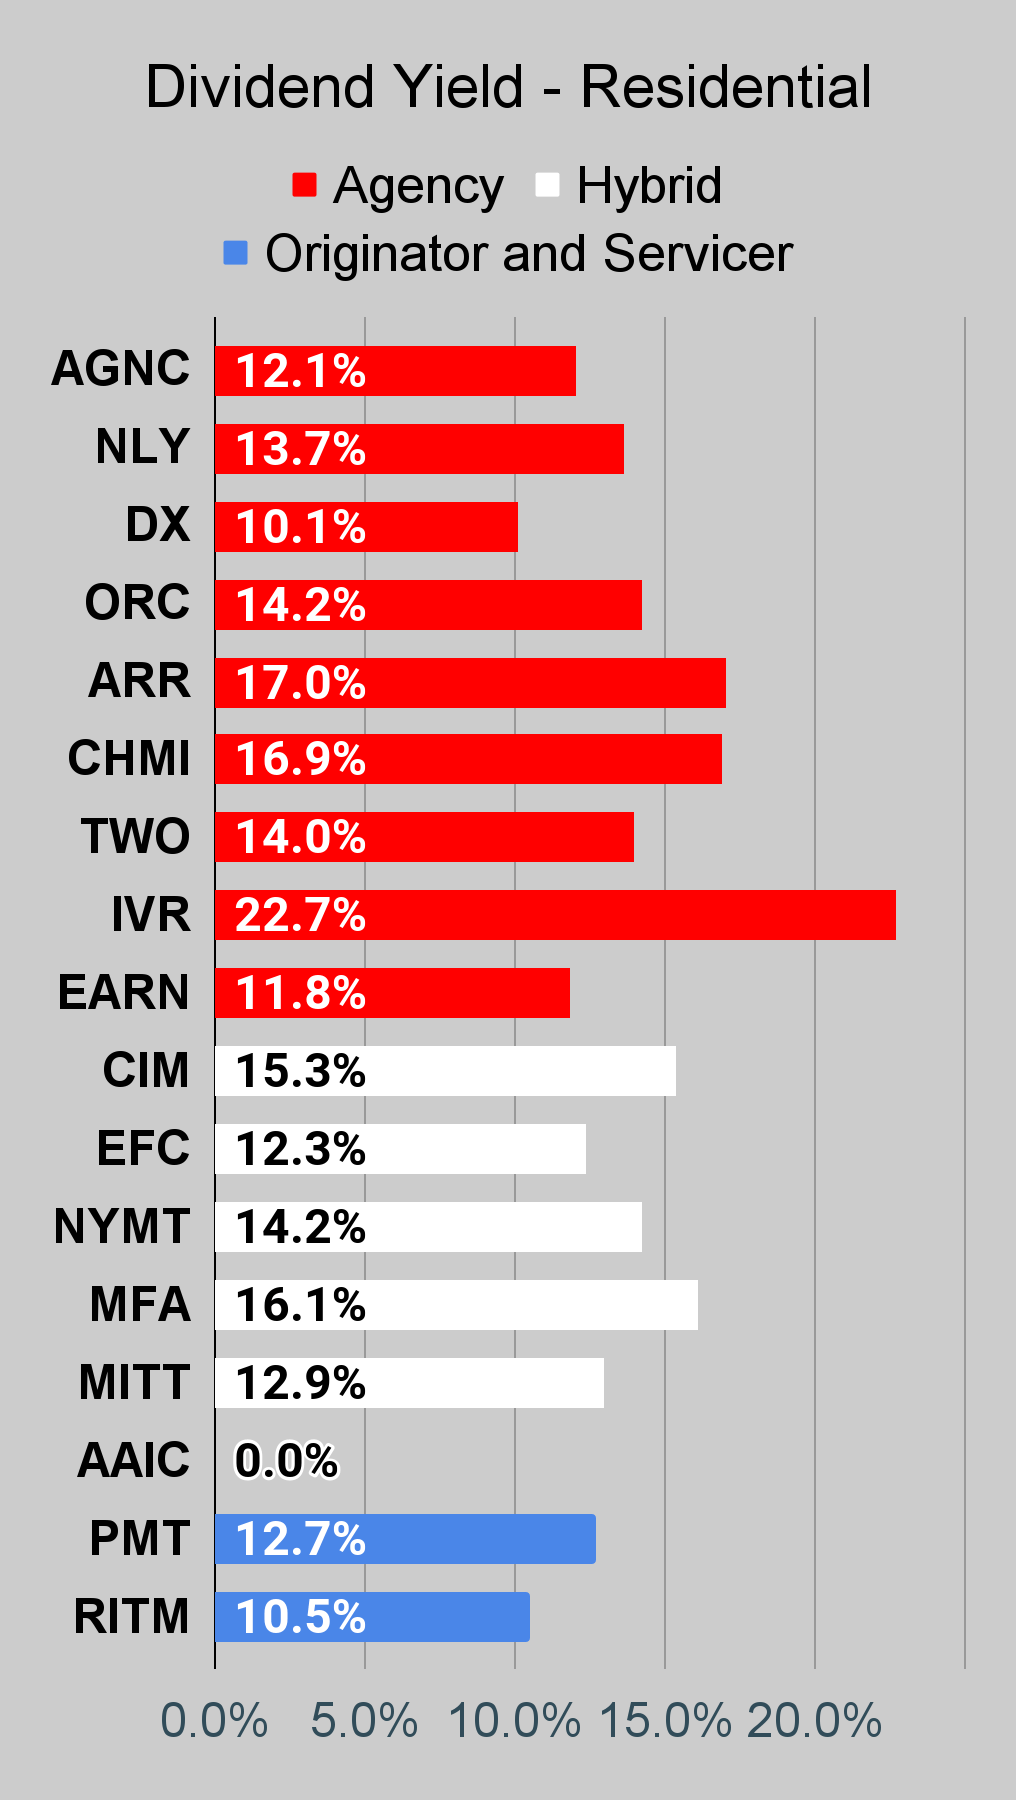
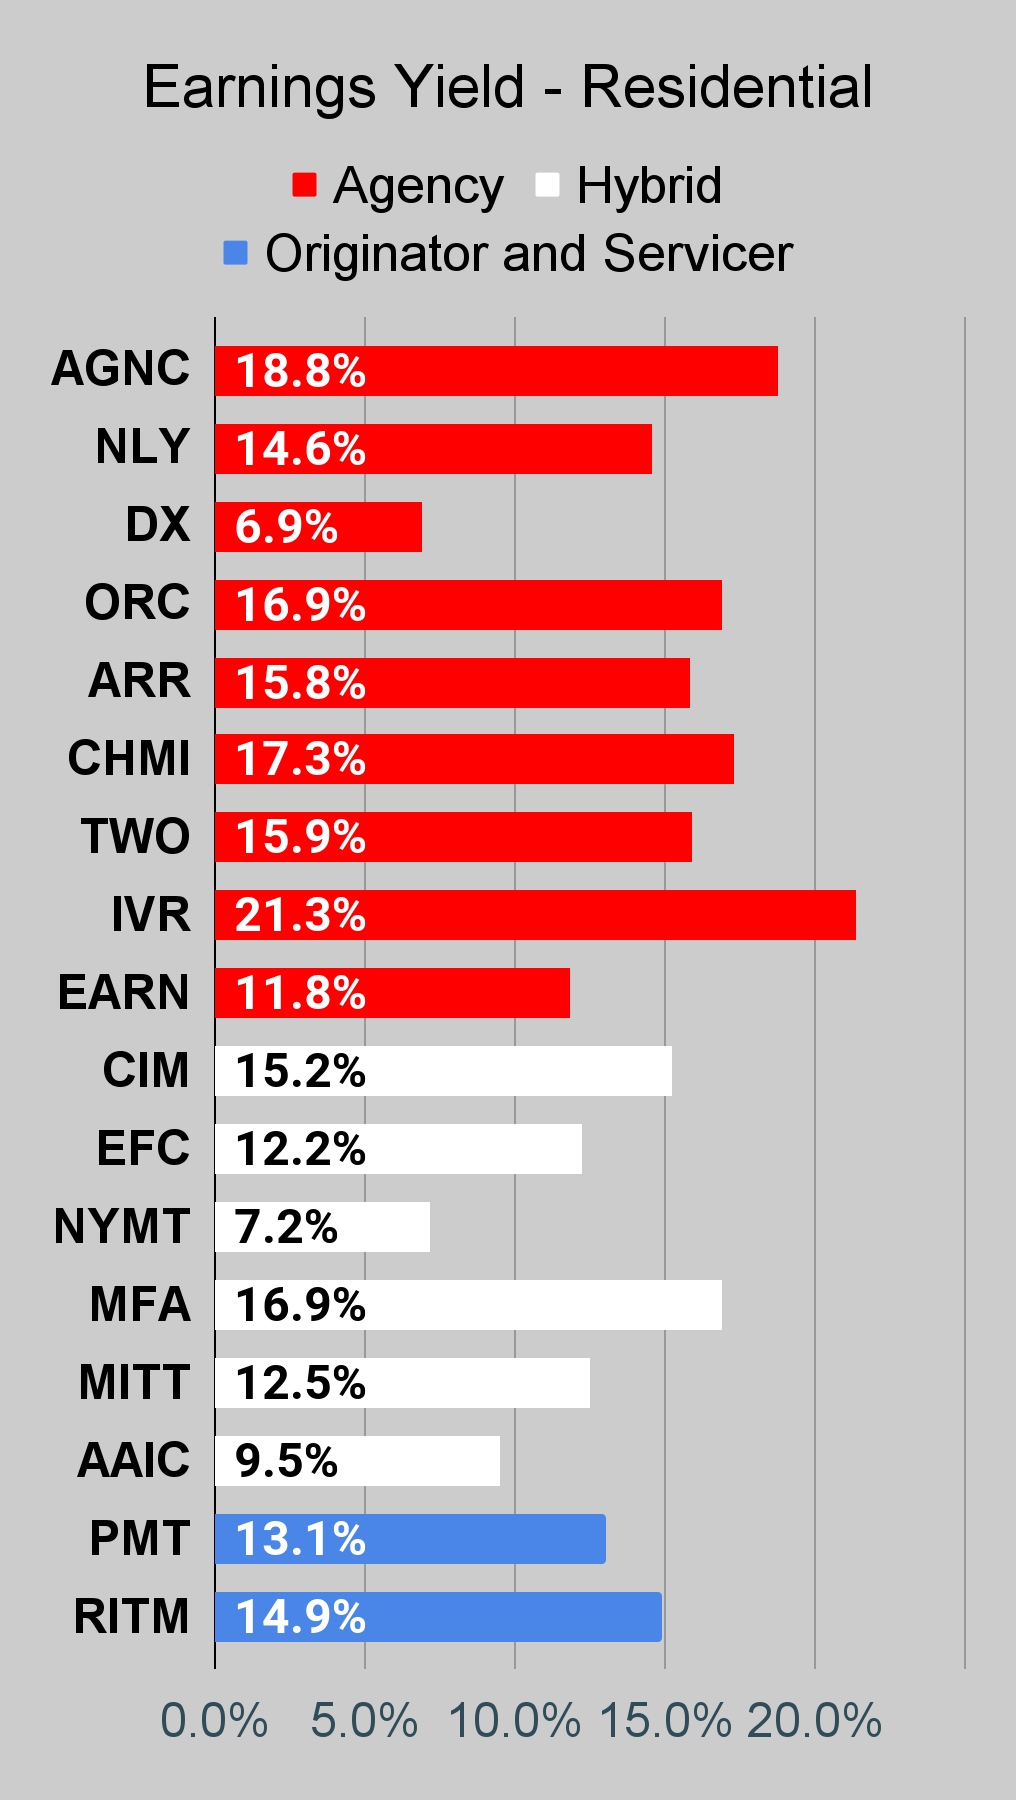
| Residential Agency |
| Residential Hybrid |
| Residential Originator and Servicer |
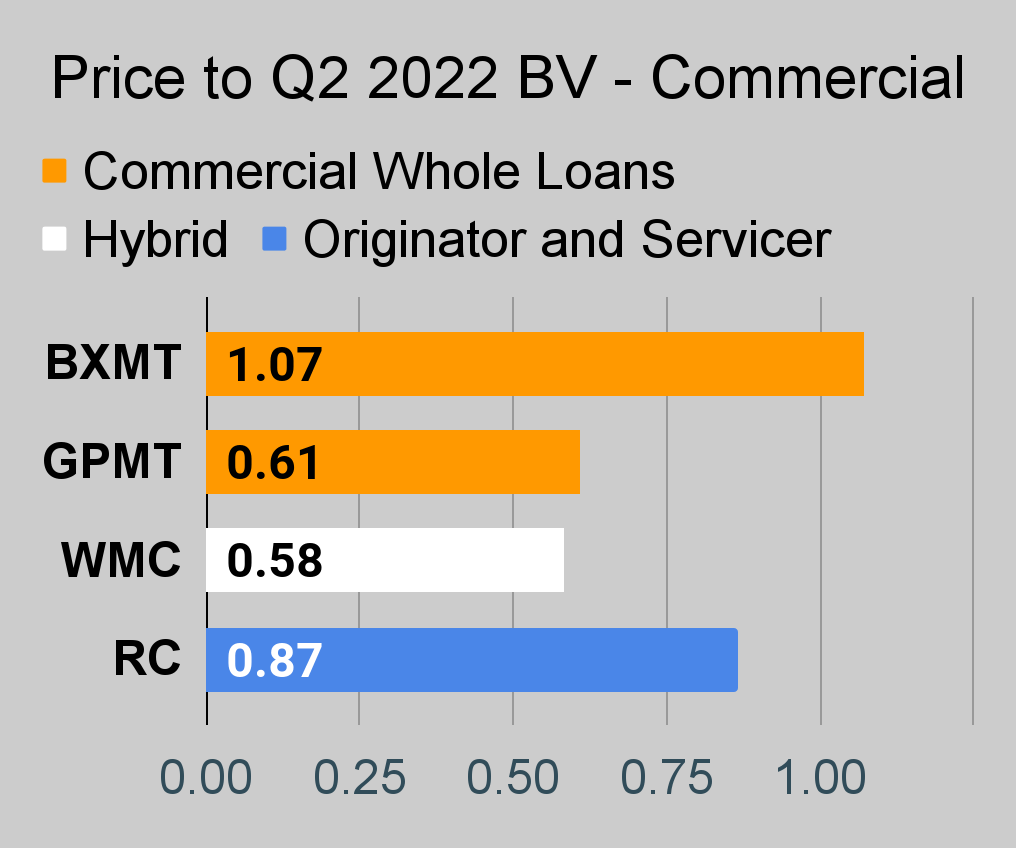
| Commercial |
| BDC |
Let the images begin!
Residential Mortgage REIT Charts
Note: The chart for our public articles uses the book value per share from the latest earnings release. Current estimated book value per share is used in reaching our targets and trading decisions. It is available in our service, but those estimates are not included in the charts below.
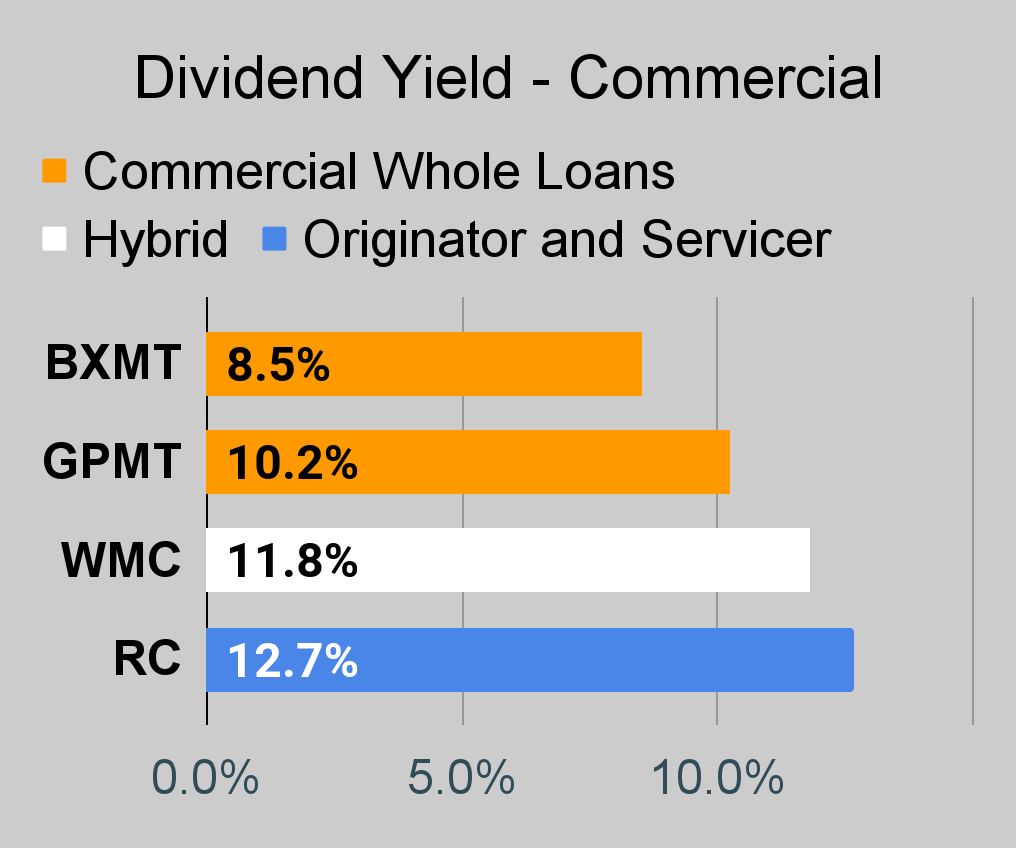
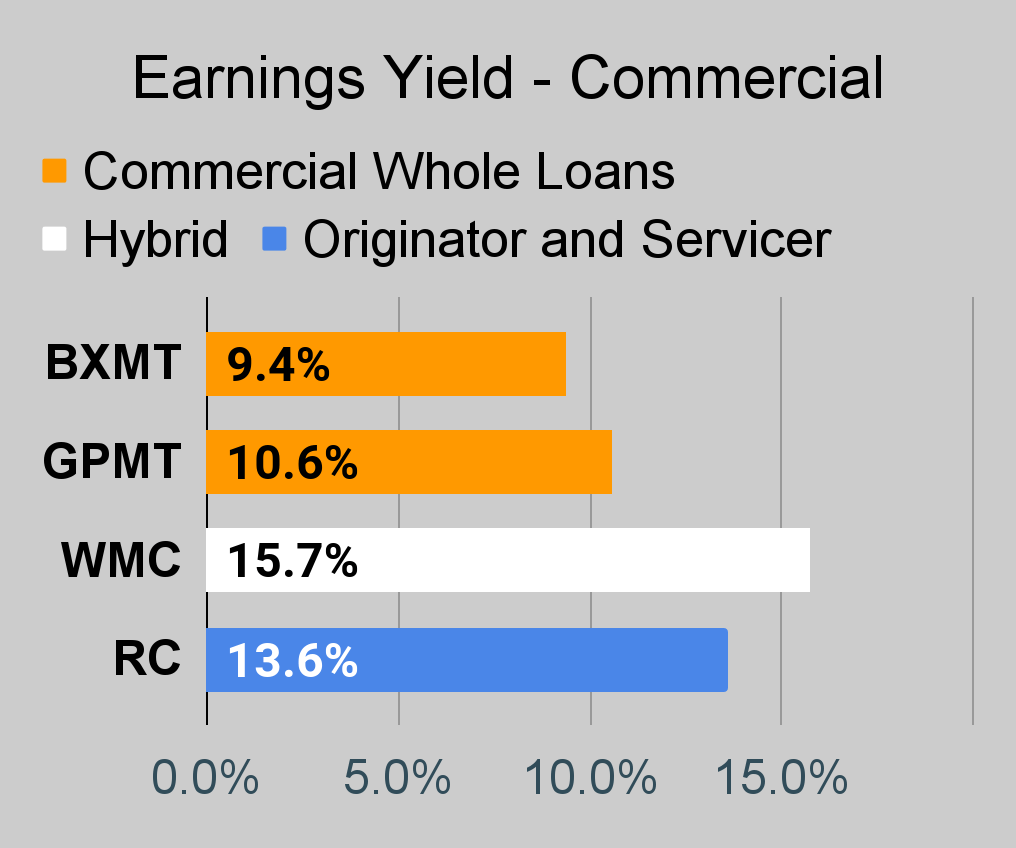
Commercial Mortgage REIT Charts
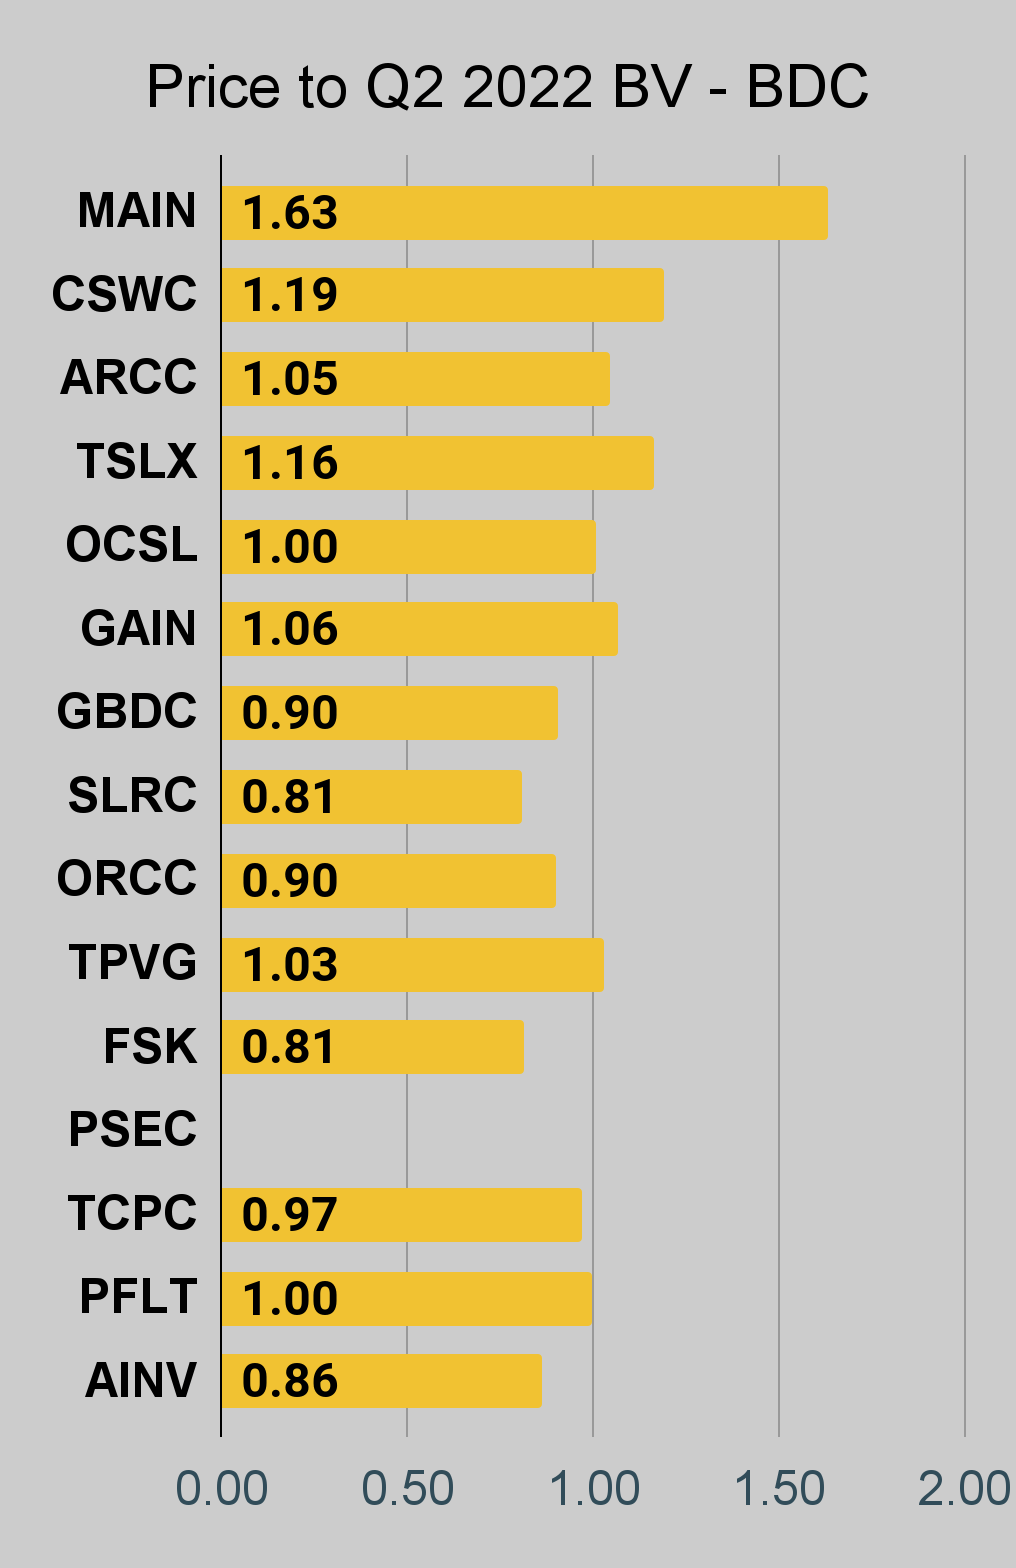
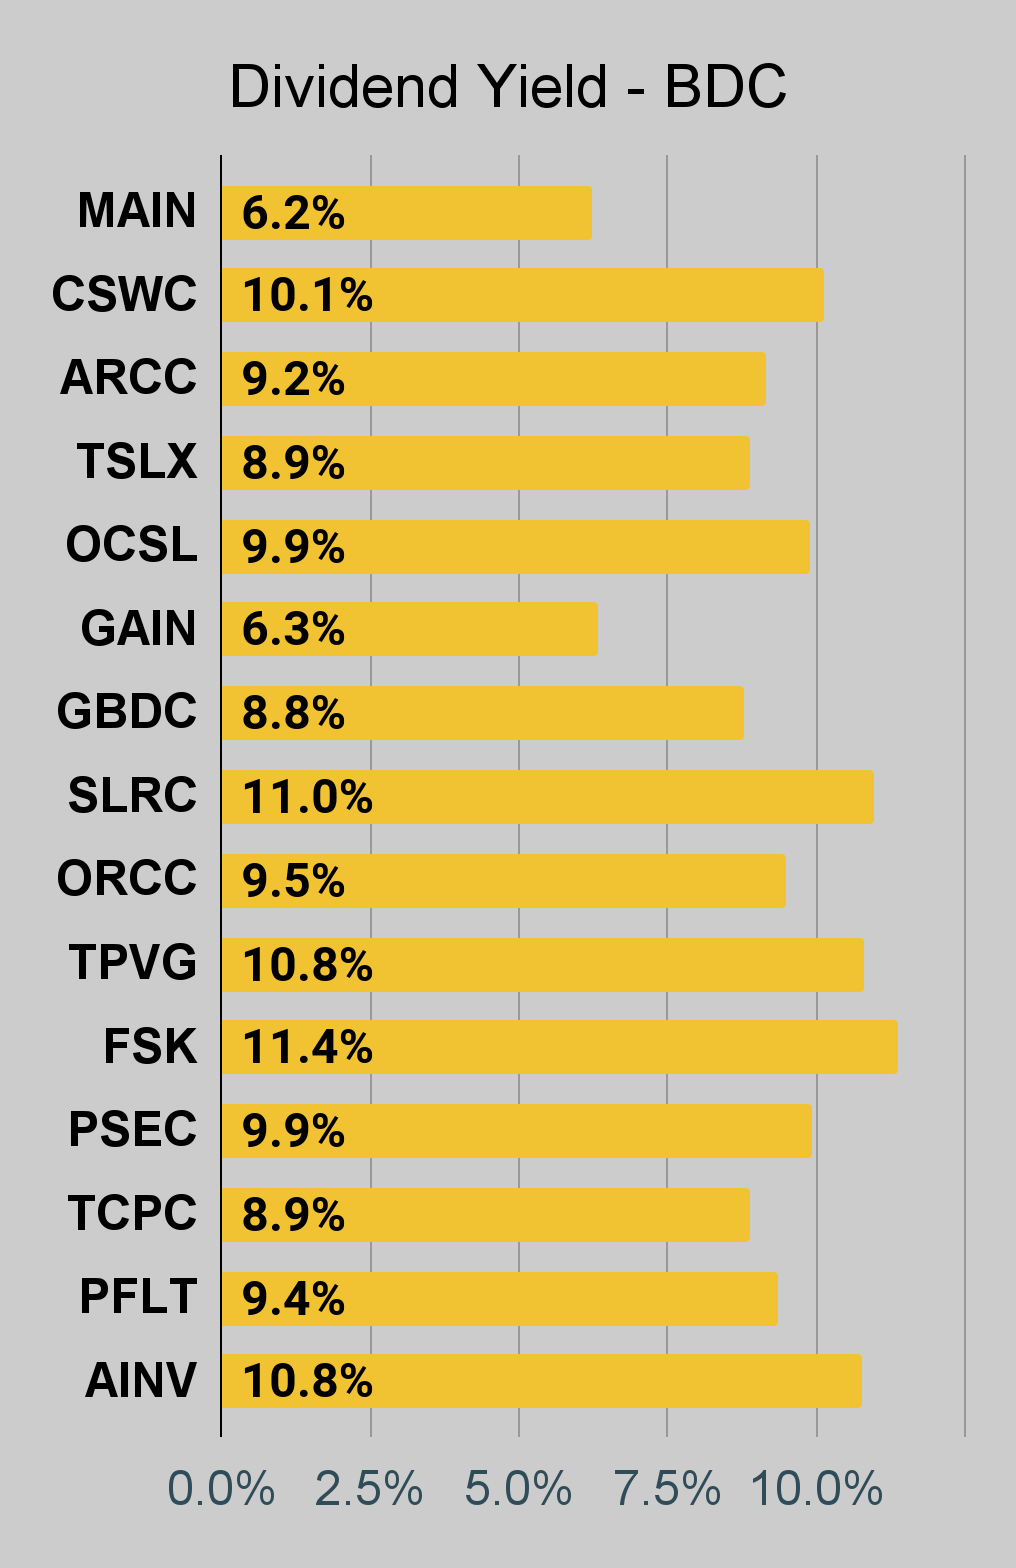
BDC Charts
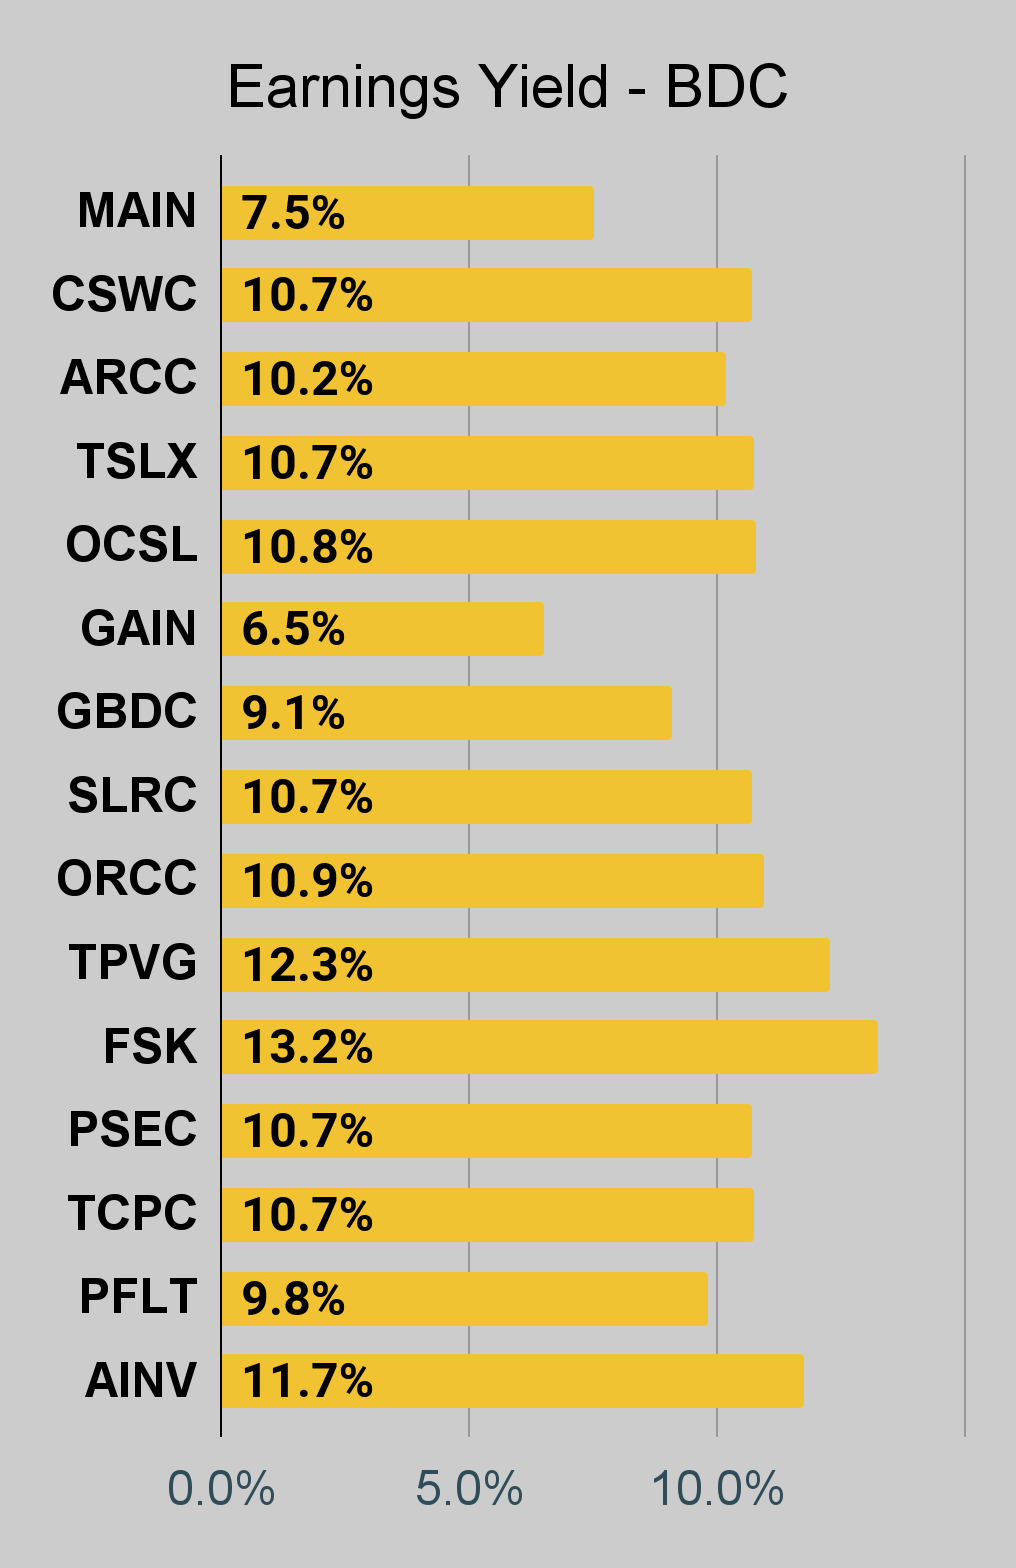
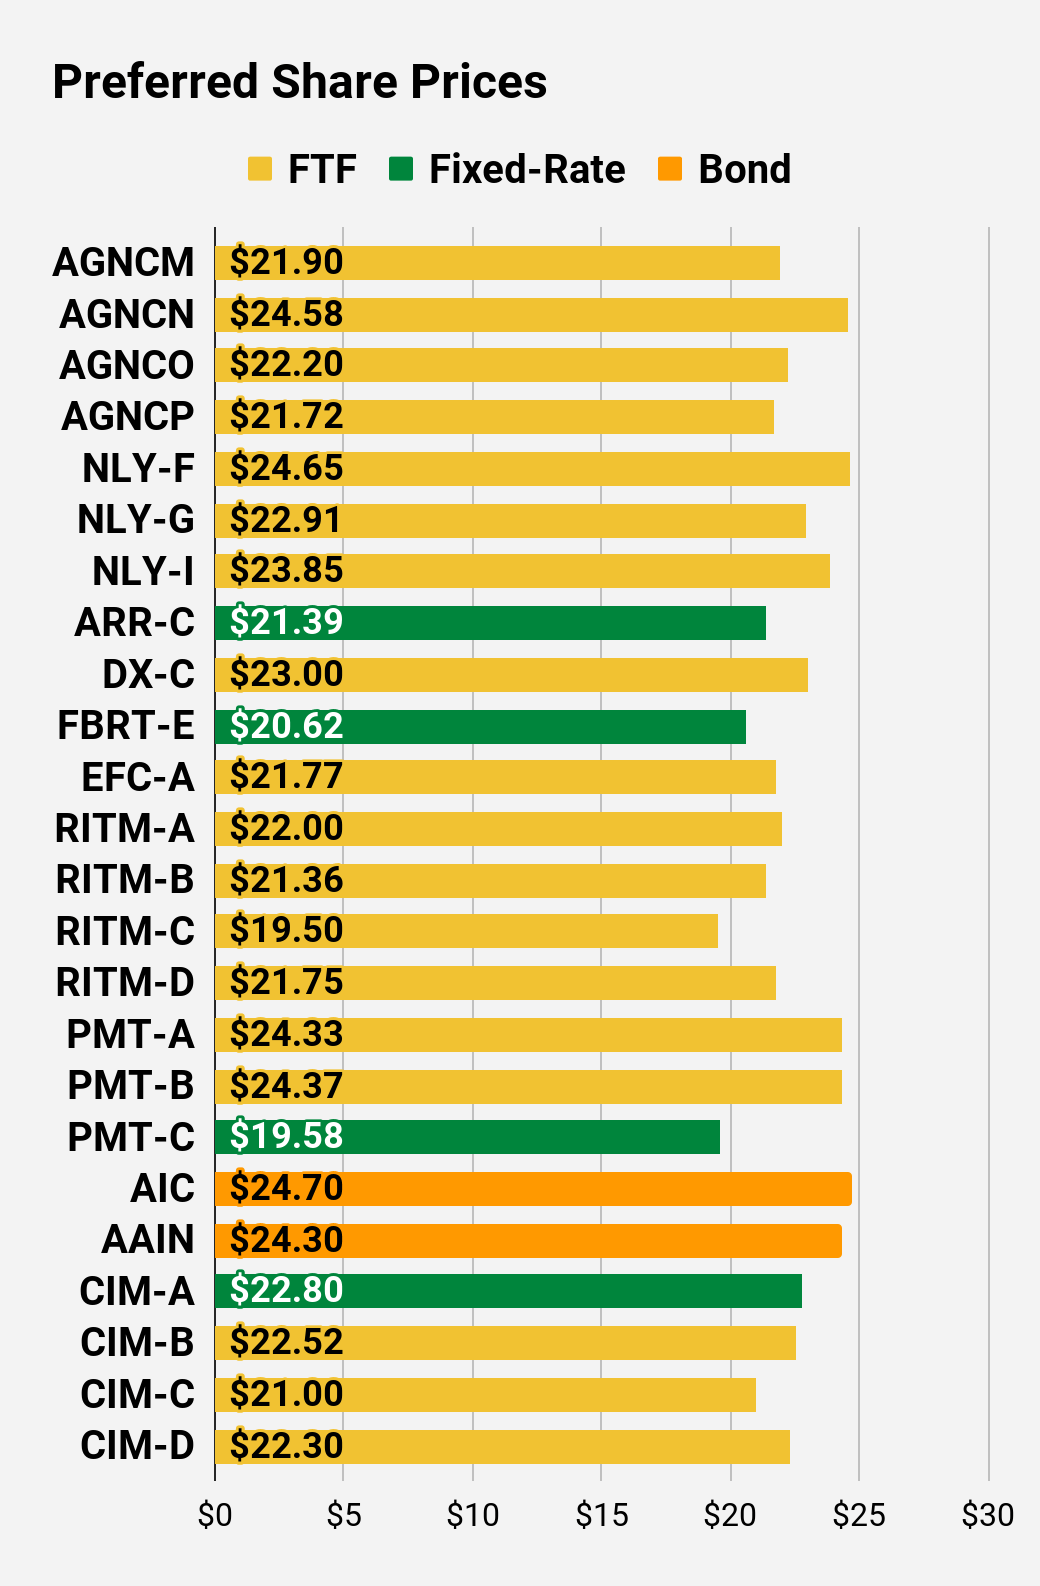
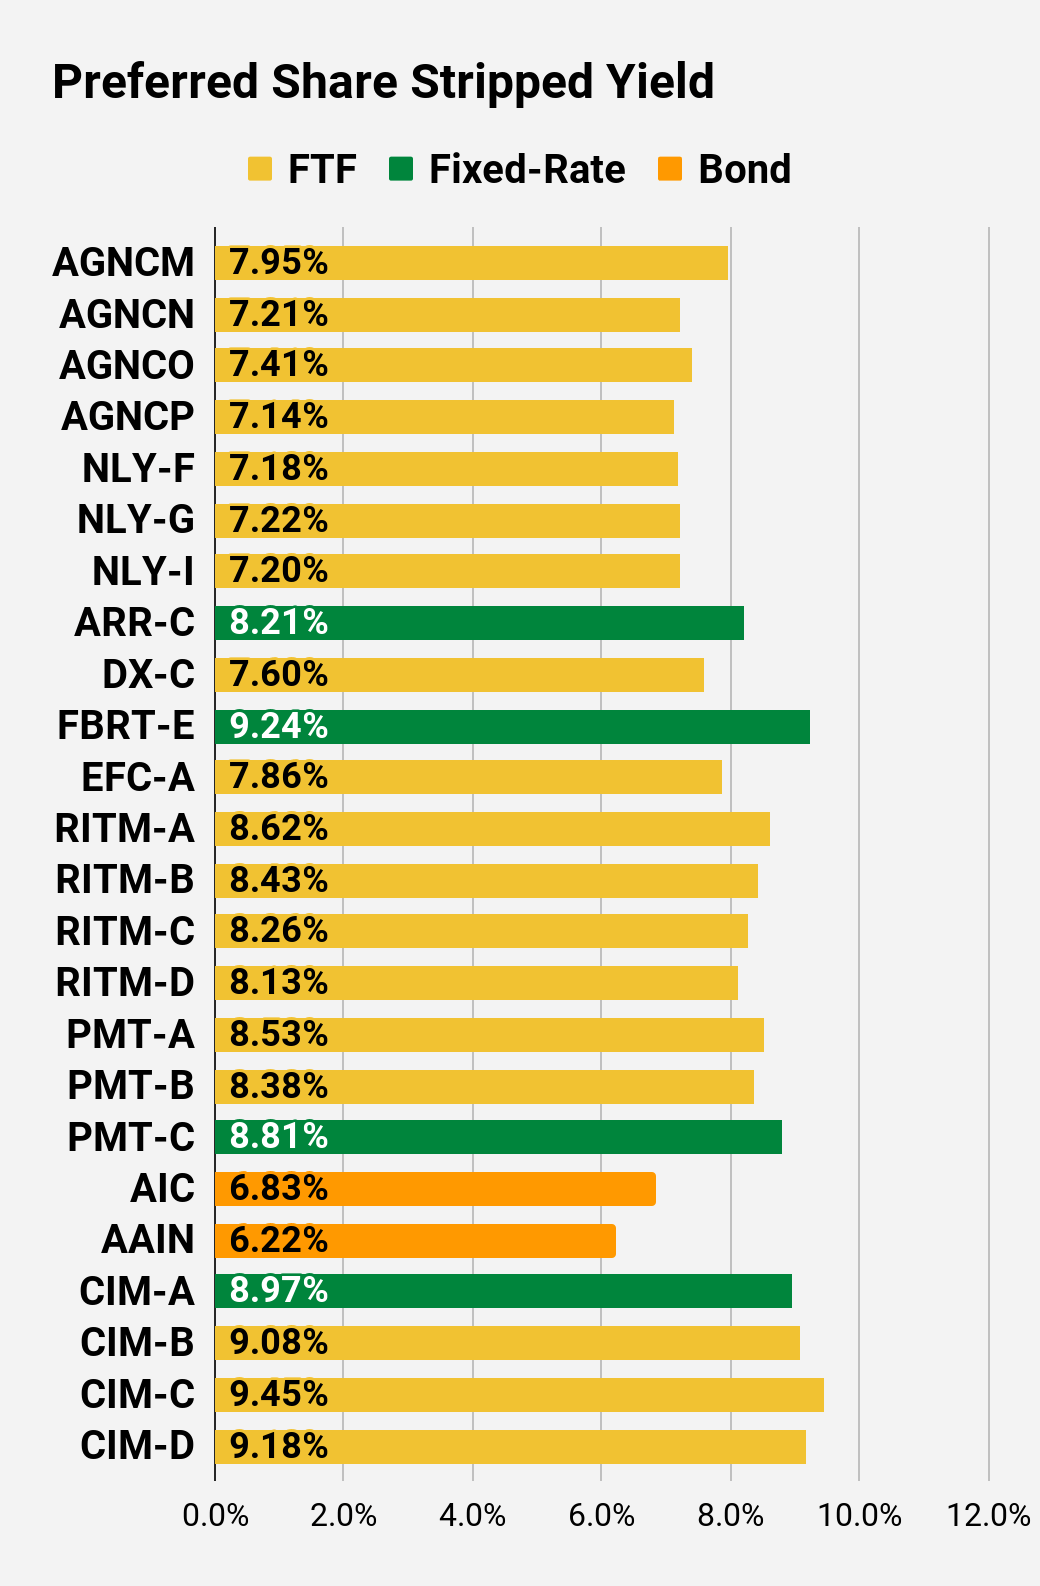
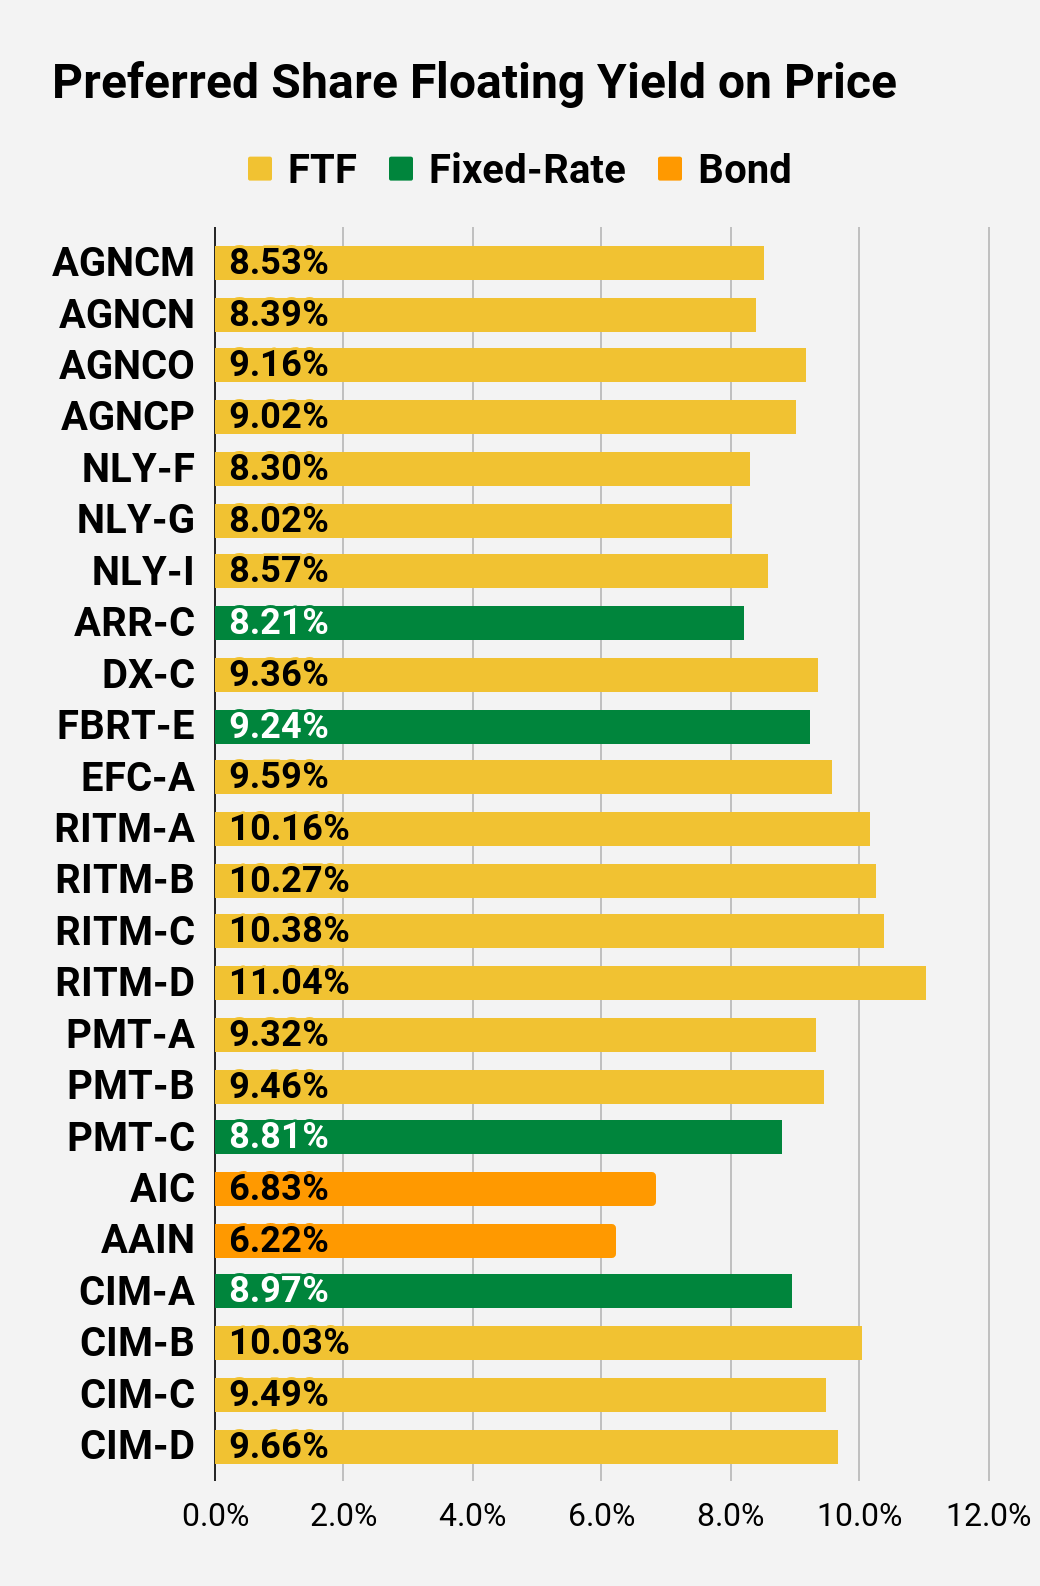
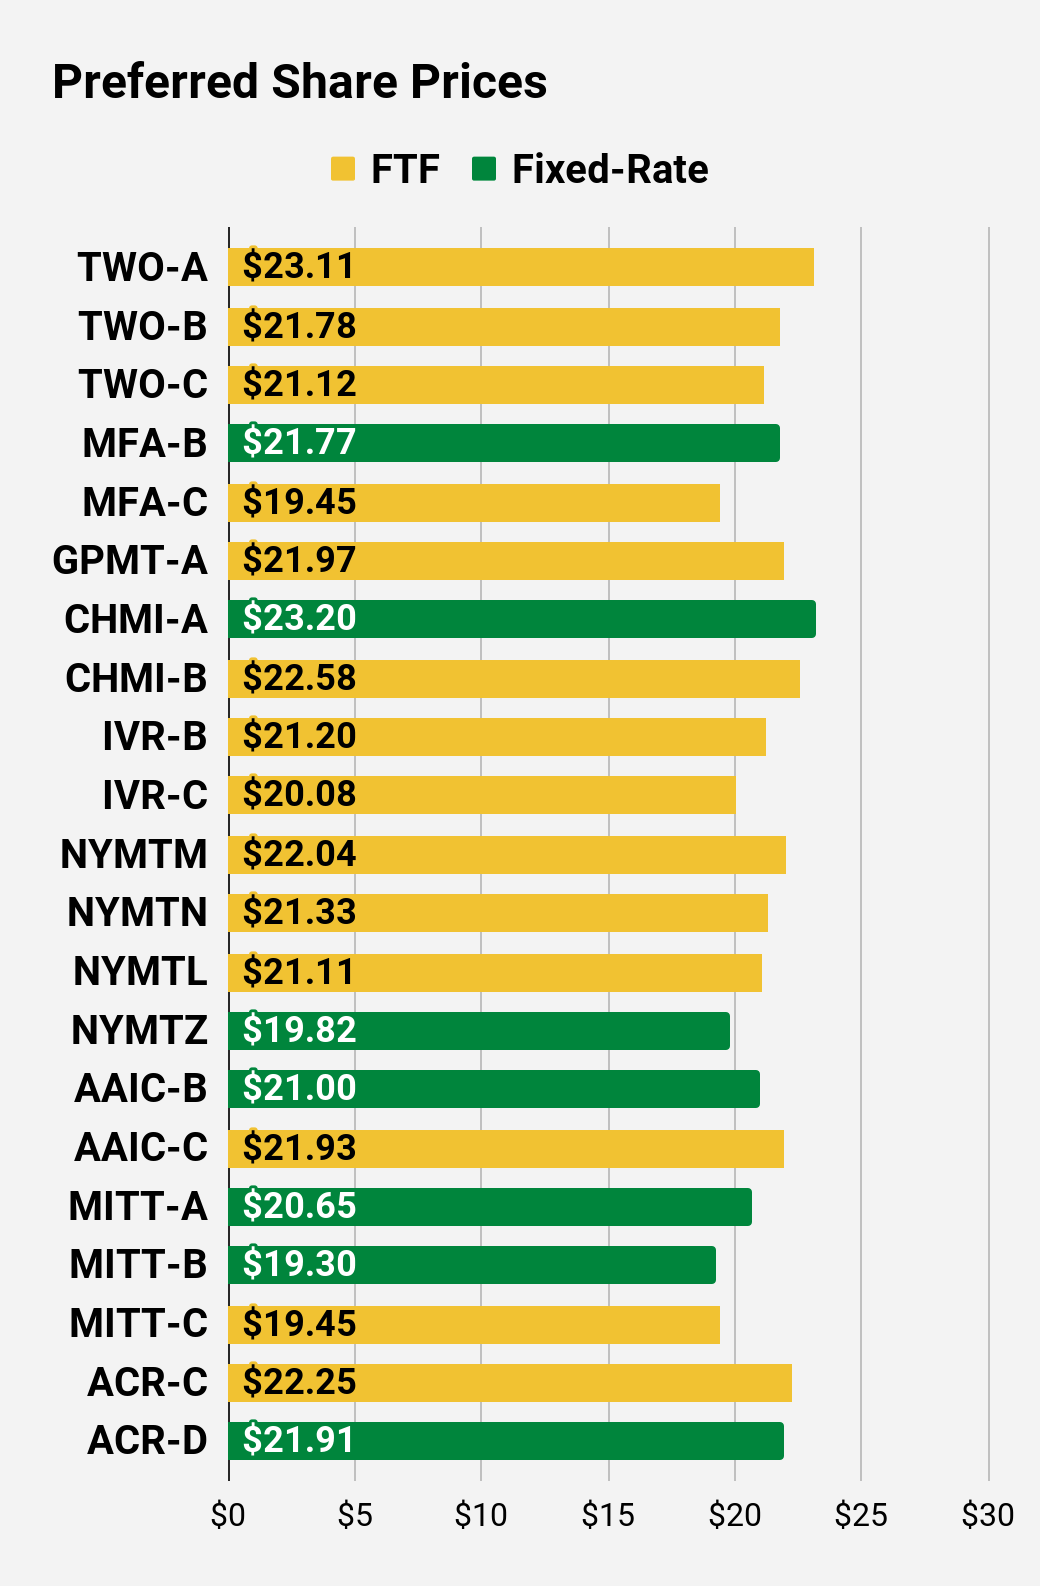
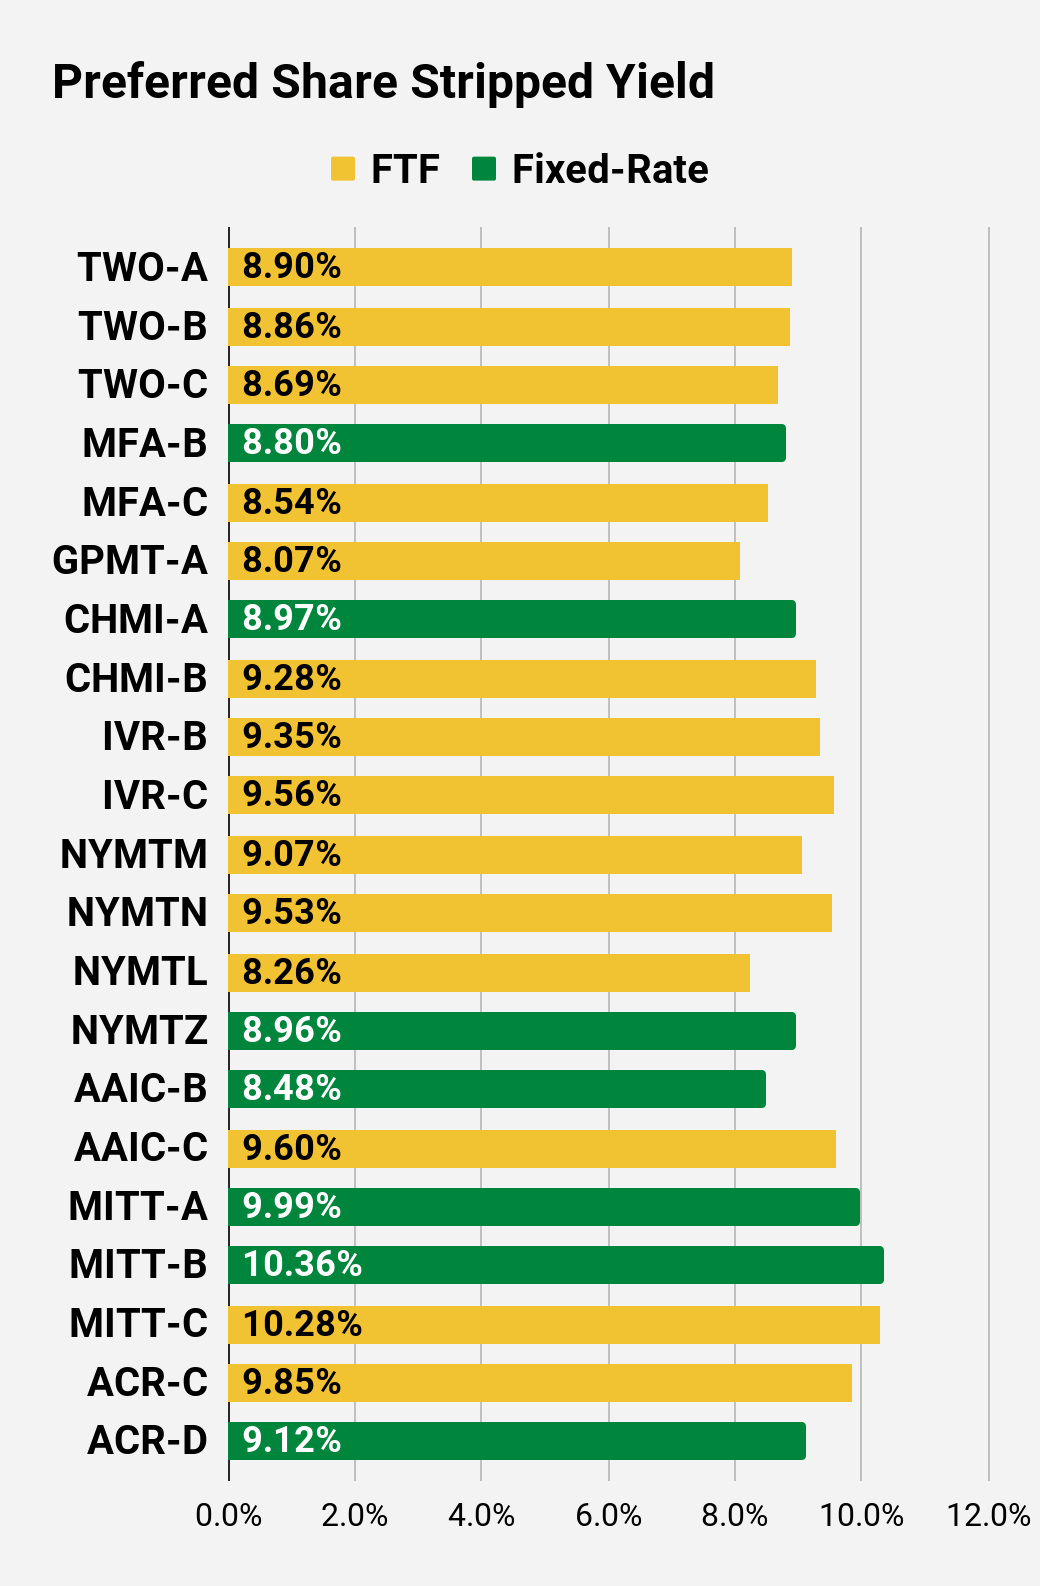
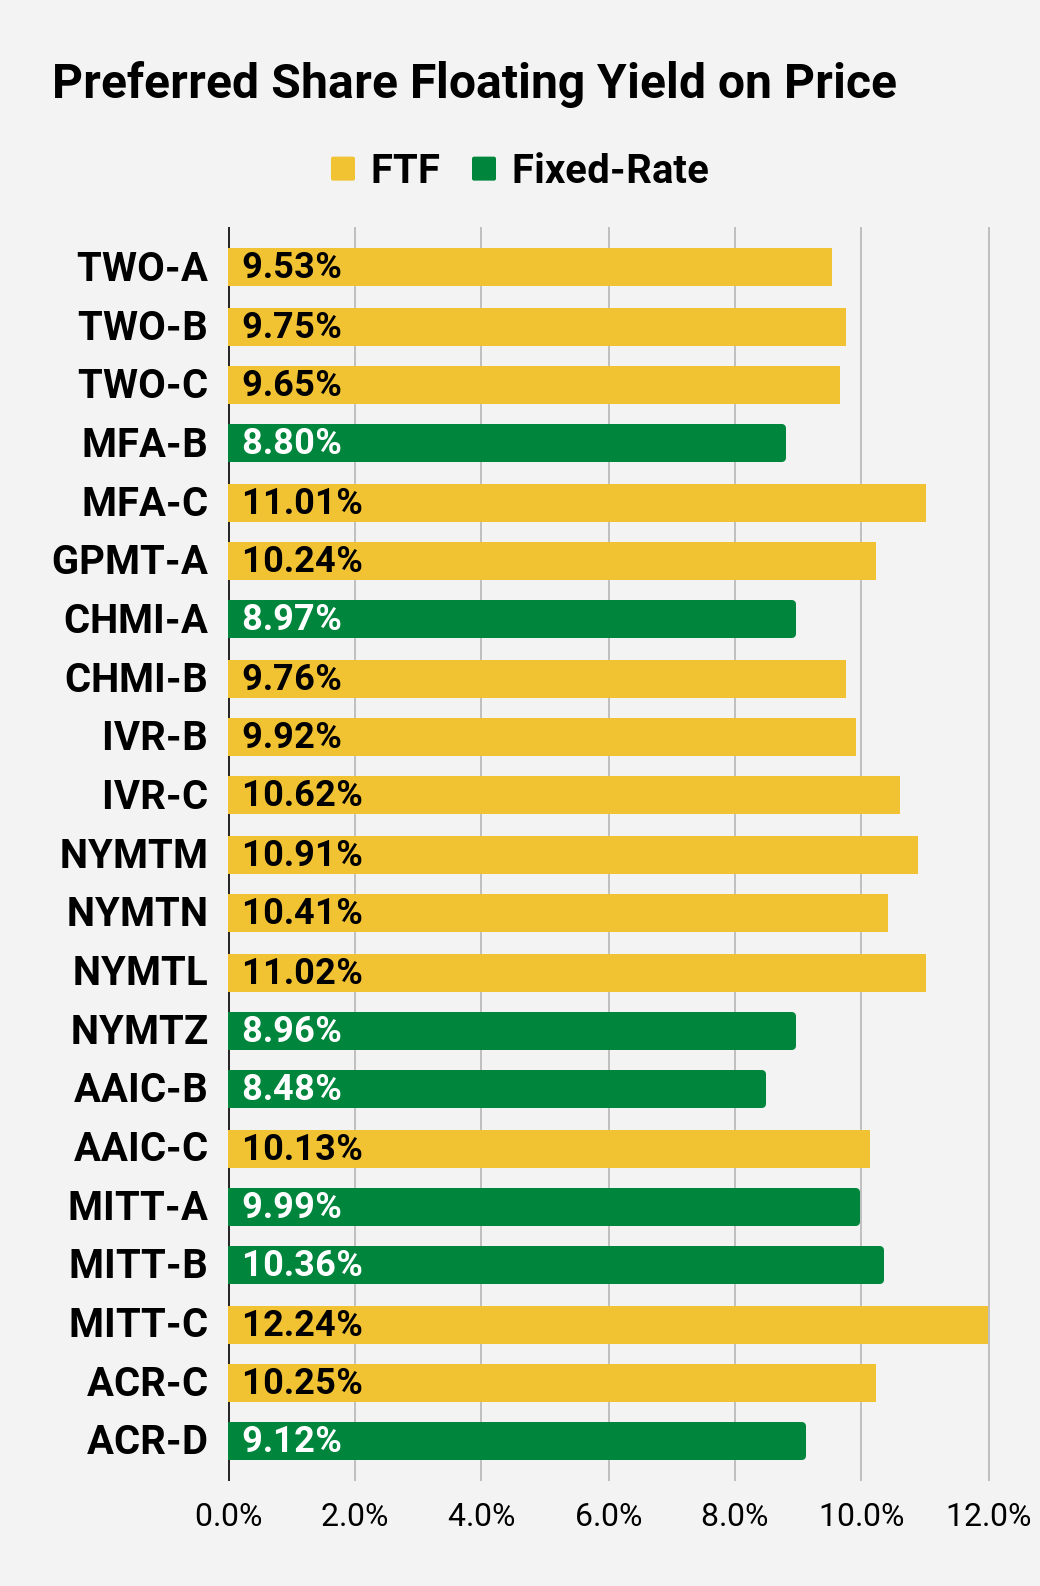
Preferred Share Charts
Preferred Share Data
Beyond the charts, we’re also providing our readers with access to several other metrics for the preferred shares.
After testing out a series on preferred shares, we decided to try merging it into the series on common shares. After all, we are still talking about positions in mortgage REITs. We don’t have any desire to cover preferred shares without cumulative dividends, so any preferred shares you see in our column will have cumulative dividends. You can verify that by using Quantum Online. We’ve included the links in the table below.
To better organize the table, we needed to abbreviate column names as follows:
- Price = Recent Share Price - Shown in Charts
- BoF = Bond or FTF (Fixed-to-Floating)
- S-Yield = Stripped Yield - Shown in Charts
- Coupon = Initial Fixed-Rate Coupon
- FYoP = Floating Yield on Price - Shown in Charts
- NCD = Next Call Date (the soonest shares could be called)
- Note: For all FTF issues, the floating rate would start on NCD.
- WCC = Worst Cash to Call (lowest net cash return possible from a call)
- QO Link = Link to Quantum Online Page
| Ticker |
| Price |
| BoF |
| S-Yield |
| Coupon |
| FYoP |
| NCD |
| WCC |
| QO Link |
| P-Link |
| $21.90 |
| FTF |
| 7.95% |
| 6.88% |
| 8.53% |
| 4/15/2024 |
| $6.12 |
| $24.58 |
| FTF |
| 7.21% |
| 7.00% |
| 8.39% |
| 10/15/2022 |
| $0.86 |
| $22.20 |
| FTF |
| 7.41% |
| 6.50% |
| 9.16% |
| 10/15/2024 |
| $6.47 |
| $21.72 |
| FTF |
| 7.14% |
| 6.13% |
| 9.02% |
| 4/15/2025 |
| $7.50 |
| $24.65 |
| FTF |
| 7.18% |
| 6.95% |
| 8.30% |
| 9/30/2022 |
| $0.79 |
| $22.91 |
| FTF |
| 7.22% |
| 6.50% |
| 8.02% |
| 3/31/2023 |
| $3.31 |
| $23.85 |
| FTF |
| 7.20% |
| 6.75% |
| 8.57% |
| 6/30/2024 |
| $4.53 |
| $21.39 |
| 8.21% |
| 7.00% |
| 8.21% |
| 1/28/2025 |
| $7.85 |
| $23.00 |
| FTF |
| 7.60% |
| 6.90% |
| 9.36% |
| 4/15/2025 |
| $6.74 |
| $20.62 |
| 9.24% |
| 7.50% |
| 9.24% |
| 9/29/2022 |
| $4.77 |
| $21.77 |
| FTF |
| 7.86% |
| 6.75% |
| 9.59% |
| 10/30/2024 |
| $7.11 |
| $22.00 |
| FTF |
| 8.62% |
| 7.50% |
| 10.16% |
| 8/15/2024 |
| $6.77 |
| $21.36 |
| FTF |
| 8.43% |
| 7.13% |
| 10.27% |
| 8/15/2024 |
| $7.22 |
| $19.50 |
| FTF |
| 8.26% |
| 6.38% |
| 10.38% |
| 2/15/2025 |
| $9.51 |
| $21.75 |
| FTF |
| 8.13% |
| 7.00% |
| 11.04% |
| 11/15/2026 |
| $10.71 |
| $24.33 |
| FTF |
| 8.53% |
| 8.13% |
| 9.32% |
| 3/15/2024 |
| $4.23 |
| $24.37 |
| FTF |
| 8.38% |
| 8.00% |
| 9.46% |
| 6/15/2024 |
| $4.64 |
| $19.58 |
| 8.81% |
| 6.75% |
| 8.81% |
| 8/24/2026 |
| $12.50 |
| $24.70 |
| Bond |
| 6.83% |
| 6.75% |
| 6.83% |
| 9/29/2022 |
| $0.35 |
| $24.30 |
| Bond |
| 6.22% |
| 6.00% |
| 6.22% |
| 8/1/2023 |
| $2.20 |
| $22.80 |
| 8.97% |
| 8.00% |
| 8.97% |
| 9/29/2022 |
| $2.79 |
| $22.52 |
| FTF |
| 9.08% |
| 8.00% |
| 10.03% |
| 3/30/2024 |
| $6.07 |
| $21.00 |
| FTF |
| 9.45% |
| 7.75% |
| 9.49% |
| 9/30/2025 |
| $10.39 |
| $22.30 |
| FTF |
| 9.18% |
| 8.00% |
| 9.66% |
| 03/30/2024 |
| $6.29 |
Second Batch:
| Ticker |
| Price |
| BoF |
| S-Yield |
| Coupon |
| FYoP |
| NCD |
| WCC |
| QO Link |
| P-Link |
| $23.11 |
| FTF |
| 8.90% |
| 8.13% |
| 9.53% |
| 04/27/2027 |
| $11.54 |
| $21.78 |
| FTF |
| 8.86% |
| 7.63% |
| 9.75% |
| 07/27/2027 |
| $12.75 |
| $21.12 |
| FTF |
| 8.69% |
| 7.25% |
| 9.65% |
| 1/27/2025 |
| $8.42 |
| $21.77 |
| 8.80% |
| 7.50% |
| 8.80% |
| 9/29/2022 |
| $3.71 |
| $19.45 |
| FTF |
| 8.54% |
| 6.50% |
| 11.01% |
| 3/31/2025 |
| $10.04 |
| $21.97 |
| FTF |
| 8.07% |
| 7.00% |
| 10.24% |
| 11/30/2026 |
| $10.68 |
| $23.20 |
| 8.97% |
| 8.20% |
| 8.97% |
| 9/29/2022 |
| $2.15 |
| $22.58 |
| FTF |
| 9.28% |
| 8.25% |
| 9.76% |
| 4/15/2024 |
| $5.96 |
| $21.20 |
| FTF |
| 9.35% |
| 7.75% |
| 9.92% |
| 12/27/2024 |
| $8.67 |
| $20.08 |
| FTF |
| 9.56% |
| 7.50% |
| 10.62% |
| 9/27/2027 |
| $14.79 |
| $22.04 |
| FTF |
| 9.07% |
| 7.88% |
| 10.91% |
| 1/15/2025 |
| $7.89 |
| $21.33 |
| FTF |
| 9.53% |
| 8.00% |
| 10.41% |
| 10/15/2027 |
| $14.17 |
| $21.11 |
| FTF |
| 8.26% |
| 6.88% |
| 11.02% |
| 10/15/2026 |
| $11.20 |
| $19.82 |
| 8.96% |
| 7.00% |
| 8.96% |
| 1/15/2027 |
| $13.06 |
| $21.00 |
| 8.48% |
| 7.00% |
| 8.48% |
| 9/29/2022 |
| $4.37 |
| $21.93 |
| FTF |
| 9.60% |
| 8.25% |
| 10.13% |
| 3/30/2024 |
| $6.61 |
| $20.65 |
| 9.99% |
| 8.25% |
| 9.99% |
| 9/29/2022 |
| $4.38 |
| $19.30 |
| 10.36% |
| 8.00% |
| 10.36% |
| 9/29/2022 |
| $5.73 |
| $19.45 |
| FTF |
| 10.28% |
| 8.00% |
| 12.24% |
| 9/17/2024 |
| $9.52 |
| $22.25 |
| FTF |
| 9.85% |
| 8.63% |
| 10.25% |
| 7/30/2024 |
| $7.07 |
| $21.91 |
| 9.12% |
| 7.88% |
| 9.12% |
| 5/21/2026 |
| $10.60 |
Strategy
Our goal is to maximize total returns . We achieve those most effectively by including “trading” strategies. We regularly trade positions in the mortgage REIT common shares and BDCs because:
- Prices are inefficient.
- Long-term, share prices generally revolve around book value.
- Short-term, price-to-book ratios can deviate materially.
- Book value isn’t the only step in analysis, but it is the cornerstone.
We also allocate to preferred shares and equity REITs. We encourage buy-and-hold investors to consider using more preferred shares and equity REITs.
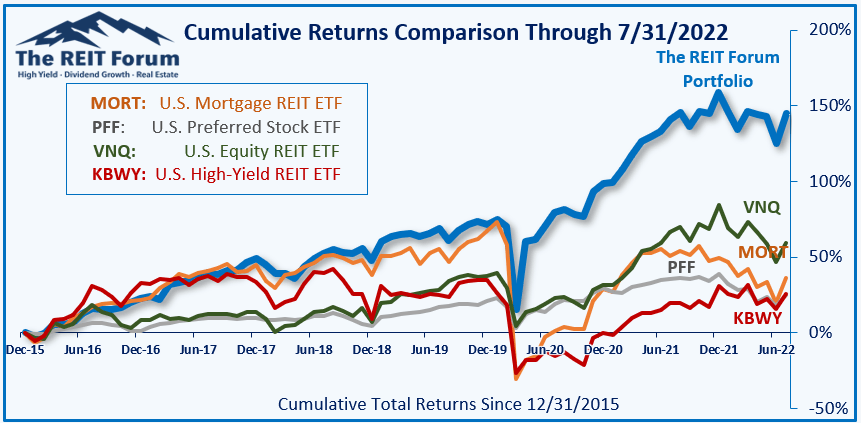
Performance
We compare our performance against 4 ETFs that investors might use for exposure to our sectors:
The REIT Forum
The 4 ETFs we use for comparison are:
| Ticker |
| Exposure |
| One of the largest mortgage REIT ETFs |
| One of the largest preferred share ETFs |
| Largest equity REIT ETF |
| The high-yield equity REIT ETF. Yes, it has been dreadful. |
When investors think it isn’t possible to earn solid returns in preferred shares or mortgage REITs, we politely disagree. The sector has plenty of opportunities, but investors still need to be wary of the risks. We can’t simply reach for yield and hope for the best. When it comes to common shares, we need to be even more vigilant to protect our principal by regularly watching prices and updating estimates for book value and price targets.
- Ratings: Bullish on DX, RITM, AAIC, MITT
For further details see:
4 Fat Yields: 13% To 0%