ASGI - 5 Closed-End Fund Buys In The Month Of August 2023 (Plus 2 I Sold)
2023-09-15 13:31:19 ET
Summary
- This month, I added to 5 different closed-end funds, but it came from the result of selling off 2 for swaps as well.
- Swap opportunities come up as we can exploit the discount/premium mechanics in closed-end funds.
- Overall, I have continued to stick with a low or no-leverage theme in this environment as I look to de-risk my CEF portfolio.
This month, I had a little bit more going on in my closed-end fund portfolio. Besides just putting fresh capital to work, we had a couple of opportunities for swaps between similar funds due to being able to exploit the discount/premium mechanics.
Overall, I still am not looking to add too much leverage to this portfolio in terms of adding leveraged funds. That theme has continued as that's been my focus throughout most of this year. With the current interest rate environment, it makes it more difficult for leveraged funds to perform well. Additionally, by reducing leverage, it's also reducing the overall risk in my portfolio for the next crash. Though admittedly, that could be years away and impossible to predict.
Over time I look for this portfolio to grow my monthly cash flow. This works through putting new capital to work and reinvesting the steady cash that comes in monthly as well. This has a compounding snowball effect over time. The more capital that is put to work, the larger the ball of monthly cash becomes.
Nuveen AMT-Free Municipal Value Fund ( NUW )
To kick off the month, I added to NUW. It's the only and first municipal CEF that I've owned, and it was a new addition earlier this year. Each month I've been buying either NUW or adding to my other new position this year at Western Asset Investment Grade Income Fund ( PAI ). I've added to PAI starting in April, the same as NUW. Then again, I've added to the position in May and July. For NUW, I added the last time in June, and now this will be the third follow-up purchase.
Being that NUW is a muni fund with a long-duration portfolio, it is going to be incredibly sensitive to yields and rising interest rates. This is what the performance has looked like in the last three years in terms of the fund's price and NAV relative to the 10-year Treasury Rate.
YCharts
One of the ideas behind adding NUW (and PAI) is not only to add more quality to my portfolio that was lacking previously with only primarily high yield and equity exposure but also to take advantage of when rates fall. The FOMC expects that they'll see lower interest rates in 2024 and 2025 relative to where they are now. Of course, that's always going to be subject to change as things play out in the world economy and how data comes in through this time. If the Fed cuts rates, yields should follow lower as well.
Additionally, the discount is quite attractive relative to its history for this fund. That could be another potential catalyst for further upside over the next few years in combination with potential future rate cuts. This was one of the key factors for why I went with NUW over other muni funds that are invested similarly from Nuveen. Further, this fund is also AMT-free, as its name would imply.
YCharts
Swapped PIMCO Dynamic Income Fund ( PDI ) For PIMCO Income Strategy Fund II ( PFN )
With the addition of PFN to my portfolio, it came from the liquidation of my PDI position. So, while this is breaking my theme of no or low-leveraged funds, it was simply swapping one leveraged fund for another. In fact, if we want to get technical, it did reduce my overall leverage exposure because PFN is currently looking at a 23.11% effective leverage ratio.
PFN Leverage Stats (PIMCO)
PDI, on the other hand, is still running a high leverage ratio of 42.47% as of July 31, 2023.
This swap came thanks to Stanford Chemist sharing his trade alert in August, highlighting the opportunity here. The idea was that the premium for PDI was becoming quite stretched as it pushed over 13%. PFN's premium was lower at less than 6%. The PIMCO funds regularly trade at premiums, so this really isn't anything new.
Since then, both have seen their premiums fall even further over the course of August.
YCharts
However, we've already seen that the swap meant a lower drop for PFN over PDI. Now, this is an incredibly short time frame to start trying to compare the funds, but it is also a good example of how it can work. As we saw the nearly identical total NAV performance in this period, it was simply by PDI's premium coming down further than PFN's that the loss was slightly reduced. Though the funds still produced a loss in this short period of time greater than their NAV results as premiums for both came down.
Over the last decade, the performance of the funds has resulted in different outcomes, meaning that they aren't necessarily the perfect swap pair. Ideally, we'd like to see the correlation closer, but it was still a worthwhile swap, as shorter periods of time should see less of a divergence in results.
YCharts
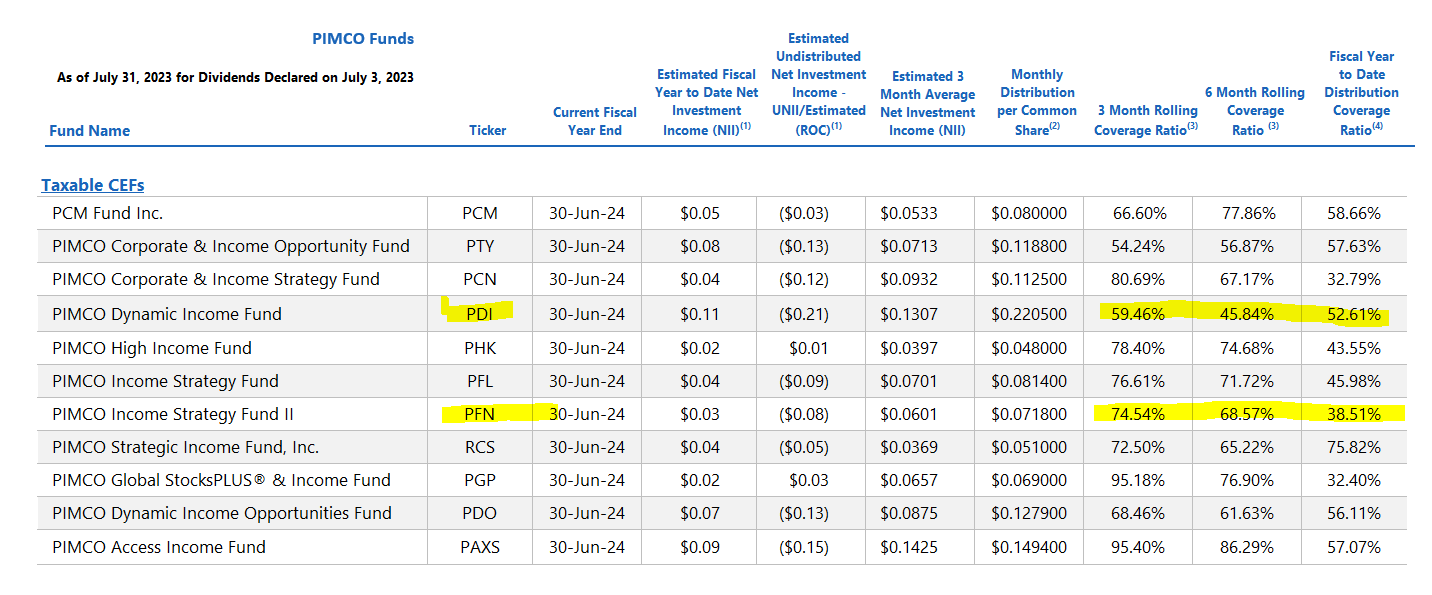
Another potential bonus here is that despite neither fund showing envious distribution coverage, PFN has been a bit stronger in the 3-month and 6-month periods.
PIMCO UNII Report (PIMCO (highlights from author))
Of course, as long as it is under 100%, it isn't ideal and leaves them susceptible to distribution cuts in any of their funds. The general idea here is that PFN is no better or worse off than PDI in this case, which is what can make exploiting discounts/premiums between funds possible.
NXG NextGen Infrastructure Income Fund ( NXG ) And abrdn Global Infrastructure Income Fund ( ASGI )
I'm pairing these funds up because they have some significant overlap. They are both infrastructure funds, and I've been adding to ASGI quite aggressively this year as it is a non-leveraged fund, which brings up another point: ASGI is a non-leveraged fund, and NXG is leveraged. Sticking with my theme of not adding substantial leverage to my CEF portfolio is another reason why I've added to these funds at the same time.
NXG isn't too aggressively leveraged, with a leverage ratio of 26.08%. Still, by adding nearly equal amounts of each fund, this leverage exposure was, in theory, cut in half as well. I cover both of these funds regularly, and while they are both infrastructure funds, they have some serious differences as well. This can be reflected in the fact that the funds experienced vastly different performance. The below comparison is for the last year alone.
YCharts
On a total NAV return basis, the differences were even larger than the total share price results. ASGI was clearly the winner here, and one of the high-level differences between the funds here is that ASGI is heavily weighted towards global and industrial stocks. In fact, industrial positions make up the largest weighting of this fund at 34.4%, and utilities trail at a weighting of 30.9%.
ASGI Top Ten And Sector Allocation (ASGI Fact Sheet)
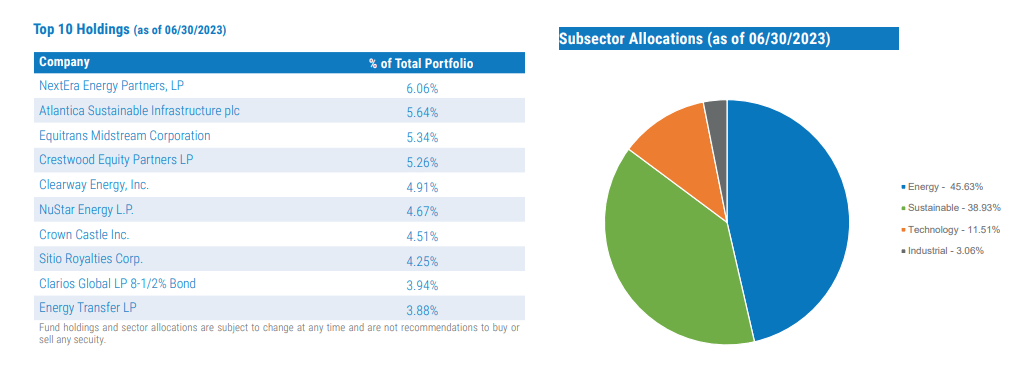
For NXG, we see that energy makes up the largest slice of the pie by a wide margin. This is then followed by "sustainable" companies in the renewable space that have been absolutely hammered.
NXG Top Holdings And Sector Allocation (NXG Fact Sheet)
I'm a big fan of infrastructure and utilities in general, so having exposure to a diversified pool of these companies between two different funds is something I'm comfortable with. In fact, I hold several other infrastructure-related funds as well - with another one that we'll be touching on in this list as well!
Both NXG and ASGI are trading at attractive discounts, which is part of their appeal at this time. Both are also trading at wider discounts than they've historically traded at. Albeit ASGI's history isn't that long as it was launched near the end of 2020. NXG also transitioned from a pure-play energy fund in 2020 to the more hybrid infrastructure fund we have today.
Even more recently, NXG doubled their distribution and that has led to a sharp reduction in the fund's discount since I originally bought it. The fund's discount was originally over 21% at the time I bought it, and it's now reduced to around 8.3% based on the September 13, 2023 data. (The chart below for NXG reflects the closing price of the 14th but the NAV of the 13th. Due to going ex-div, the NAV would have been adjusted by $0.54 per share plus any valuation changes for the day.)
Swapped John Hancock Tax-Advantaged Dividend Income Fund ( HTD ) For John Hancock Premium Dividend Fund ( PDT )
As mentioned, here is the other utility-related fund we will be talking about. However, this fund mixes utilities with a sleeve of preferred and corporate bonds as well. I already touched on this opportunity in a PDT-specific article earlier in the month, but this is the skinny version.
At one point in my life, I had owned both PDT and HTD. Interestingly, it was PDT that started flirting with a premium and then ultimately started trading at a premium regularly. That originally made me sell off my PDT position, but I retained my HTD position.
YCharts
We can see that the discount/premium between these funds diverged significantly, which presented the opportunity for the swap to PDT from HTD. The catalyst for this event was that PDT reduced its distribution from $0.0975 per month to $0.0825. This was after many years of only increasing the distribution since the GFC.
PDT Distribution History (CEFConnect)
Investors despise distribution cuts, which we've seen play out this year with PDT, Duff & Phelps Utility and Infrastructure Fund ( DPG ) and now, more recently, Brookfield Real Assets Income Fund ( RA ). They saw their share prices collapse dramatically, and that's often when the best opportunity is to scoop up a position in the aftermath.
The reduction was a result of realigning the payout of the fund. It still has a distribution NAV rate of 8.62%, which is still higher than HTD's at 8.01%. On top of this, since the discount is deeper, the distribution yield on the share price is also going to favor PDT at 9.71% compared to 8.61% for HTD. With a cut out of the way, I would suspect that PDT will - barring a black swan event - try to maintain the distribution at this level for several years.
Over the very long term, these funds have performed incredibly similarly. PDT came out slightly on top, but not by anything dramatic, considering this is nearly 20 years of history. It is limited by HTD's launch in 2004, as PDT is the older sister that was launched back in 1989.
YCharts
Both of these funds take a hybrid approach. PDT is currently leaning towards a relatively larger fixed-income approach. PDT's last report shows that they are 46.4% allocated to equities, with 27.1% in corporate bonds and 23.5% in preferred. HTD's last report shows a 60.8% weighting to equities, with 19.3% in corporate bonds and preferred securities exposure of 17.7%.
Both funds also favor the utilities sector by a fairly wide margin. PDT is at a 47.2% allocation to utilities, and HTD is at 59%. This goes back to the equity/bond/preferred exposure of each fund. PDT carries a higher allocation to financials relative to utilities when compared to HTD because the fund favors more fixed-income and preferred. That's where each of these funds primarily gets their financial exposure, while the utility sleeve is mostly the common stock of each fund.
For further details see:
5 Closed-End Fund Buys In The Month Of August 2023 (Plus 2 I Sold)