RCA - 5 Double-Digit Dividend Previews Or Reviews
2023-07-26 08:06:20 ET
Summary
- We’re checking in on the early earnings results or projections for upcoming earnings from 5 double-digit yielding REITs.
- So far earnings season is going pretty well for the sector. More positive surprises than negative.
- We’re including our projections for Annaly Capital Management.
- I also picked up a very short-duration bond as a temporary place to store some cash.
Get ready for charts, images, and tables because they are better than words. The ratings and outlooks we highlight here come after Scott Kennedy’s weekly updates . Your continued feedback is greatly appreciated, so please leave a comment with suggestions.
Earnings season is already underway and it’s moving fast.
We’re going to check in 5 shares with double-digit dividend yields:
DX, ORC, AGNC, NLY, and RITM.
After that, we’ll touch on a baby bond I purchased recently.
These are going to be pretty brief. I think you'll still find these very helpful though.
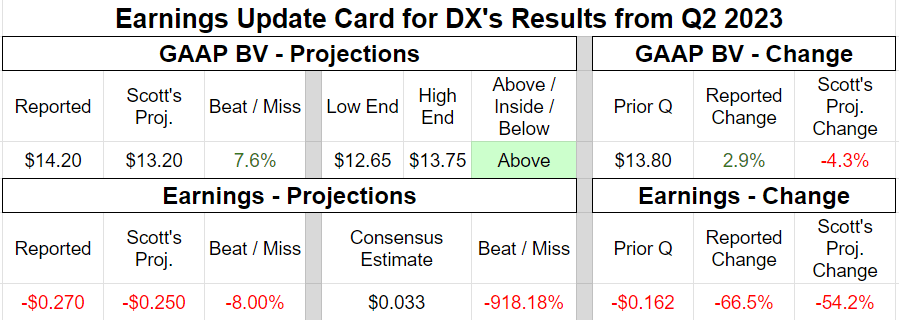
Dynex Capital ( DX ) had a monster earnings performance:
We were correct in predicting that the earnings metric would plunge and be far below consensus estimates. However, DX created a substantial positive surprise for shareholders with a healthy book value gain. That drove share prices up despite the earnings metric. That book value gain was pretty impressive given the environment during Q2 2023. It wasn’t an easy time for bond traders.
The typical earnings metric, generally referred to as “Core EPS” or “Earnings Available for Distribution” doesn’t play well with the results for DX. However, management has been getting good at describing the differences. From the DX Q2 2023 transcript :
For the second quarter, we recognized $21 million of hedge gain amortization for tax purposes or approximately $0.38. Since these hedge gains are a component of REIT taxable income, they will be part of our distribution requirements along with other ordinary gains and losses.
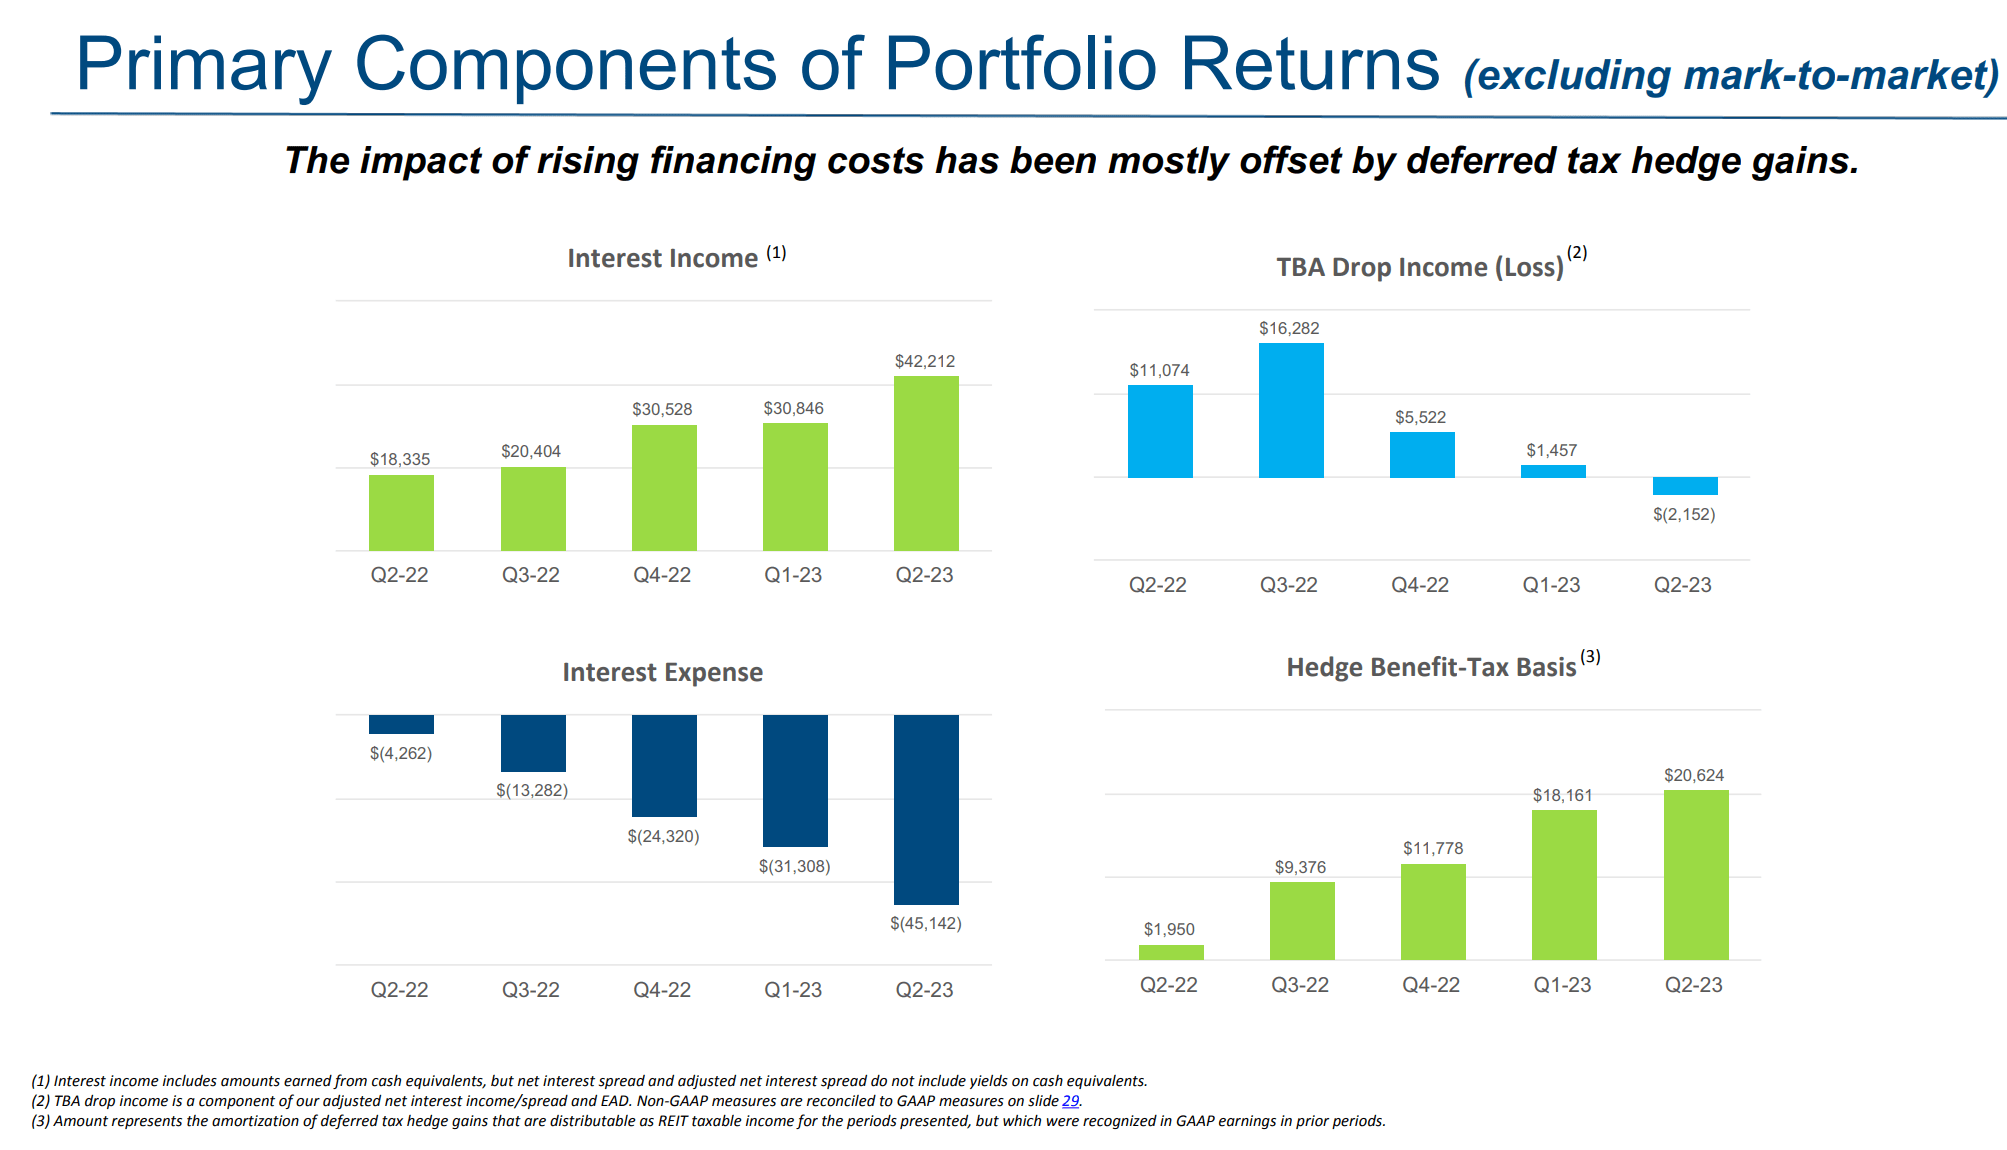
The hedge gains are shown in this slide from their presentation:
You can clearly see that while interest expense was getting worse, both interest income and hedge benefits were getting better. That’s how it should work. The DX strategy still hedges effectively, just doesn’t flow through earnings in the same manner as other hedging techniques.
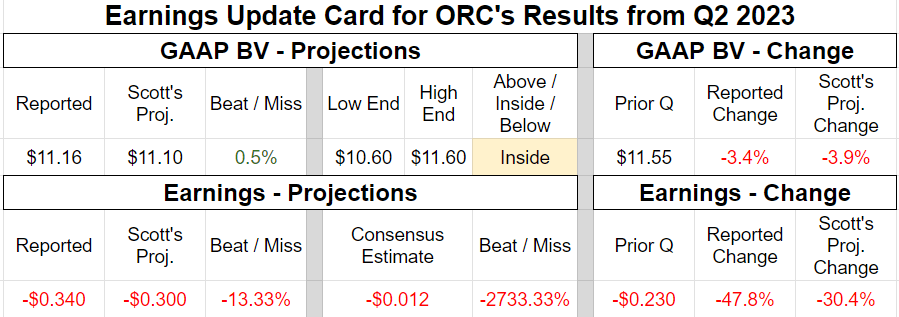
We’ve seen consensus estimates being pretty bad lately. Consensus estimates for Orchid Island Capital ( ORC ) were way off as well:
While the consensus was way off, results came in very close to our predictions.
However, I want to mention another share.
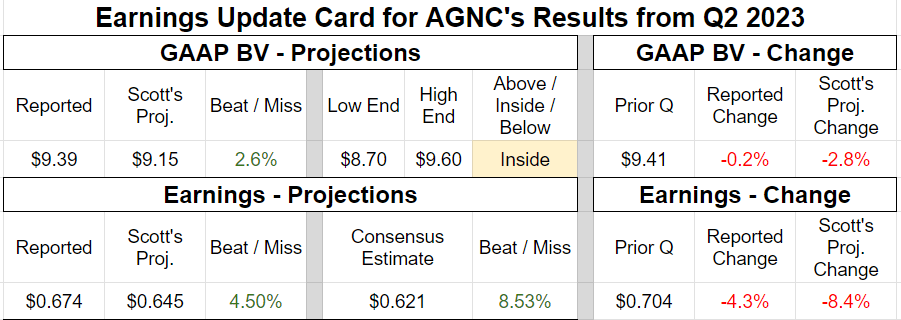
How about AGNC Investment Corp. ( AGNC ) ? After the strong increase to book value for DX, many investors were hoping for AGNC to deliver a big result:
AGNC posted a slight loss in tangible book value, but it was a bit smaller than we expected. Consequently, it was a positive surprise but not as positive as the results for DX. AGNC also had a beat on earnings. It was a pretty good beat on the consensus estimate, but only a modest beat on our estimates.
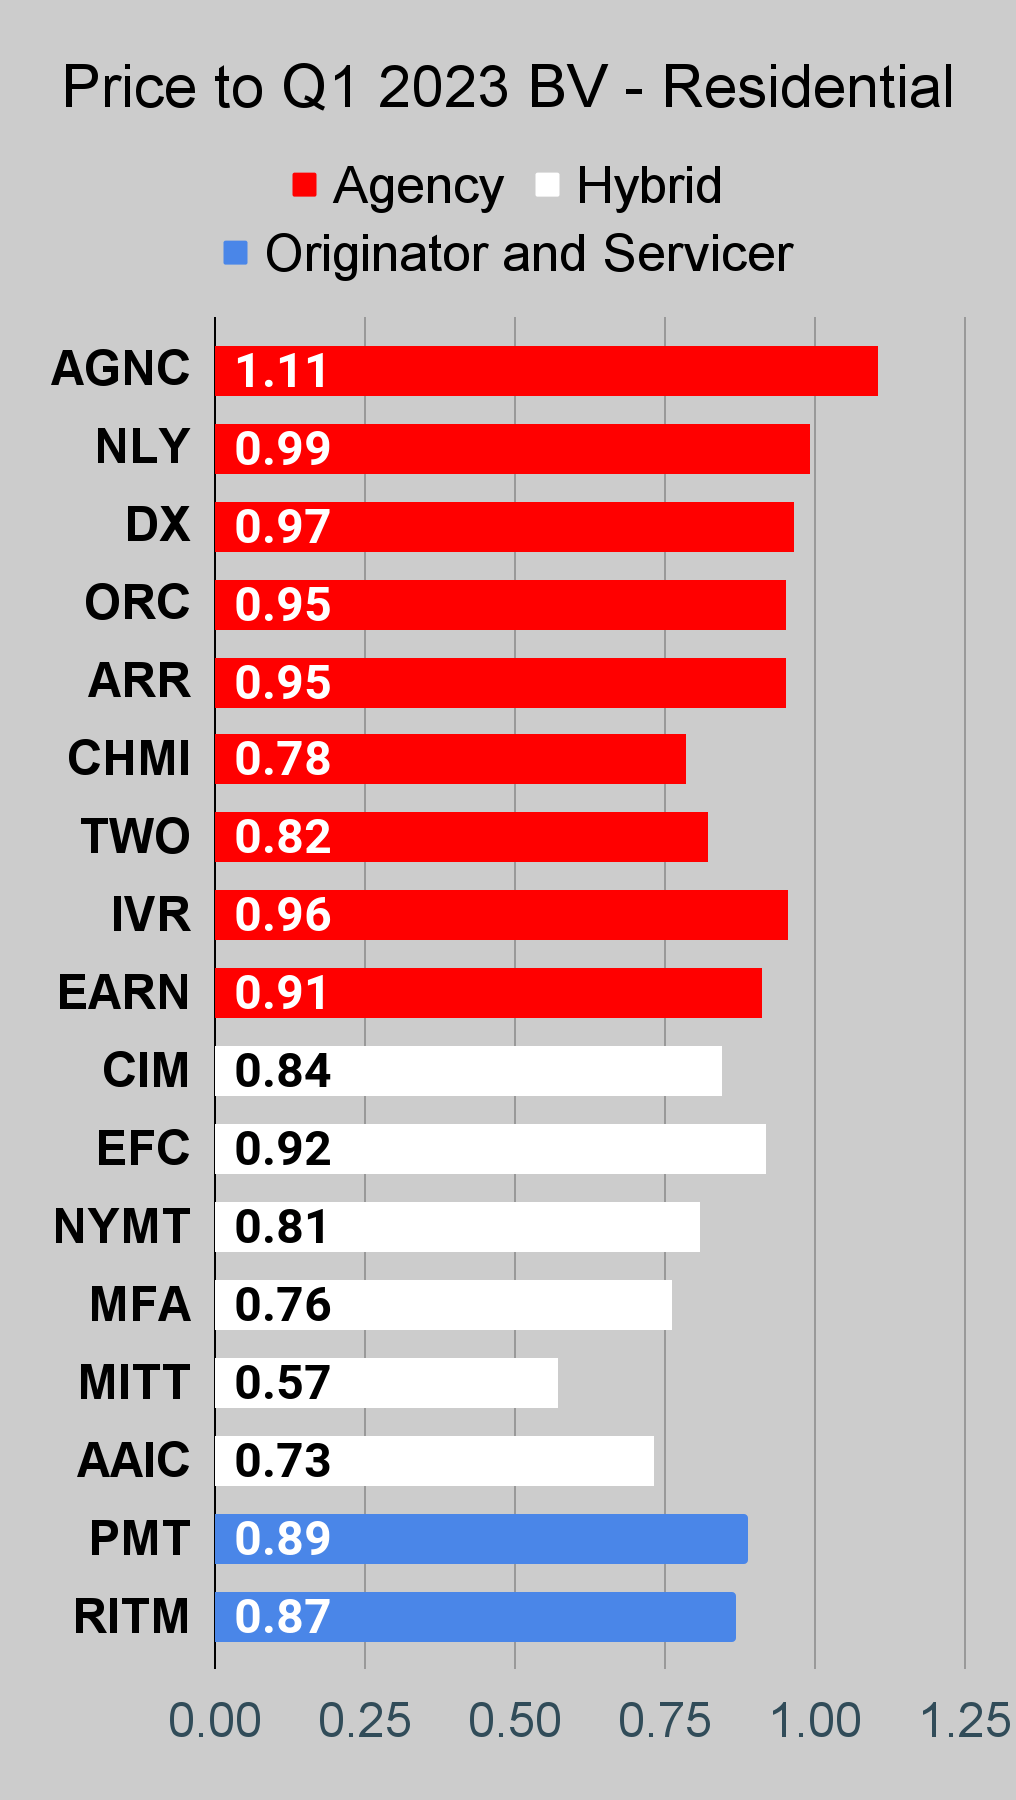
When it comes to valuation, I think AGNC is materially too high. Using bond prices through last weekend and today’s share price, we’re projecting the current price-to-book (estimated) is around 1.10. That’s right around the top end of AGNC’s range from the last several years. I think AGNC would be wise to issue a huge secondary offering.
Here’s the price-to-trailing-book chart:
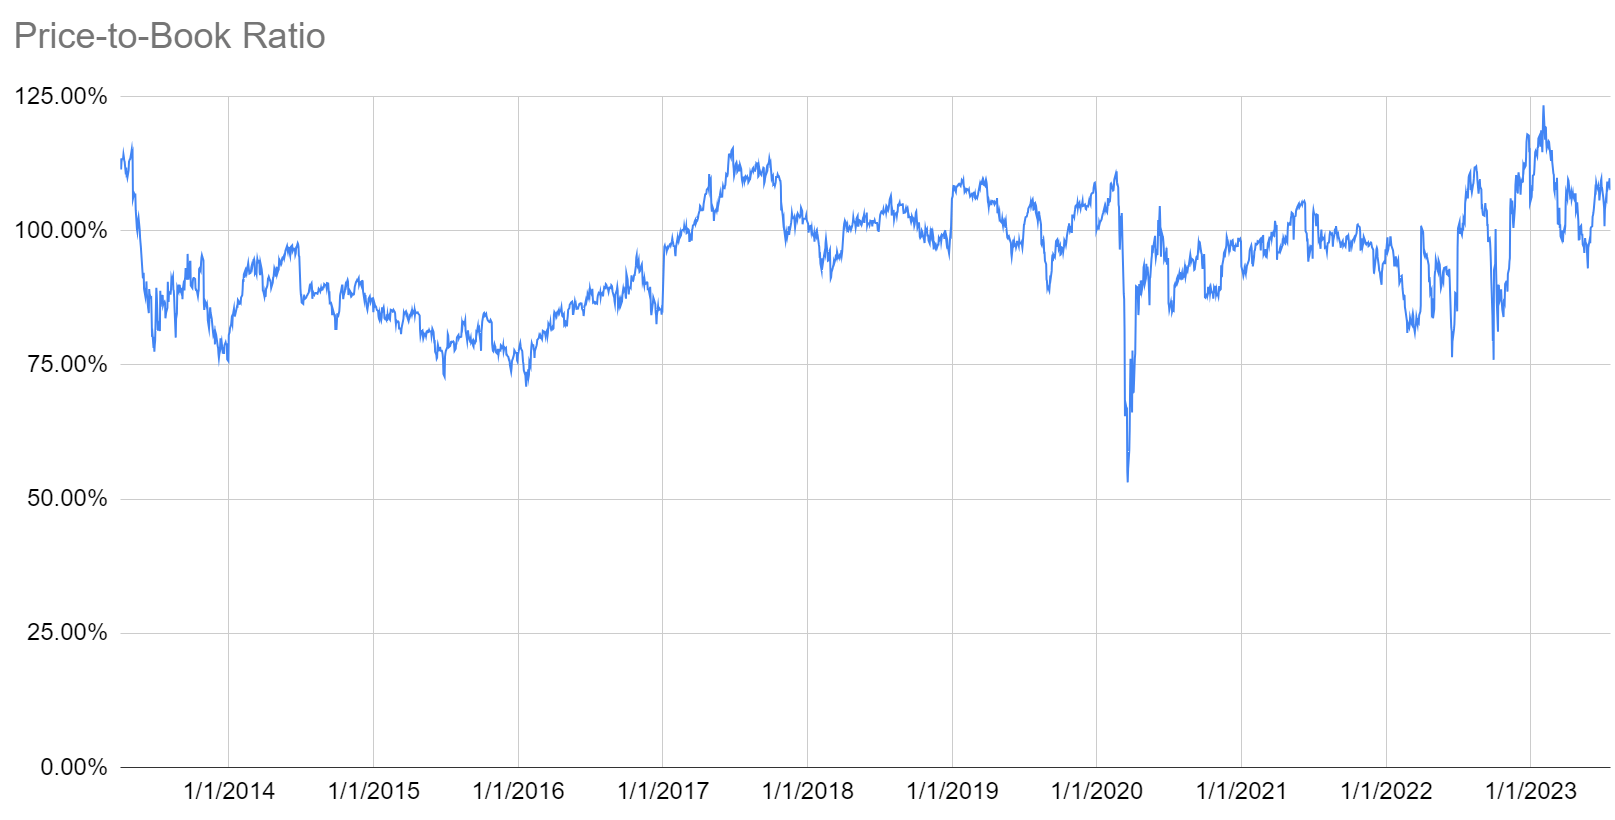
That’s unusually high.
To draw that, I use the price and the trailing book value. If you wanted those raw numbers, see them below:
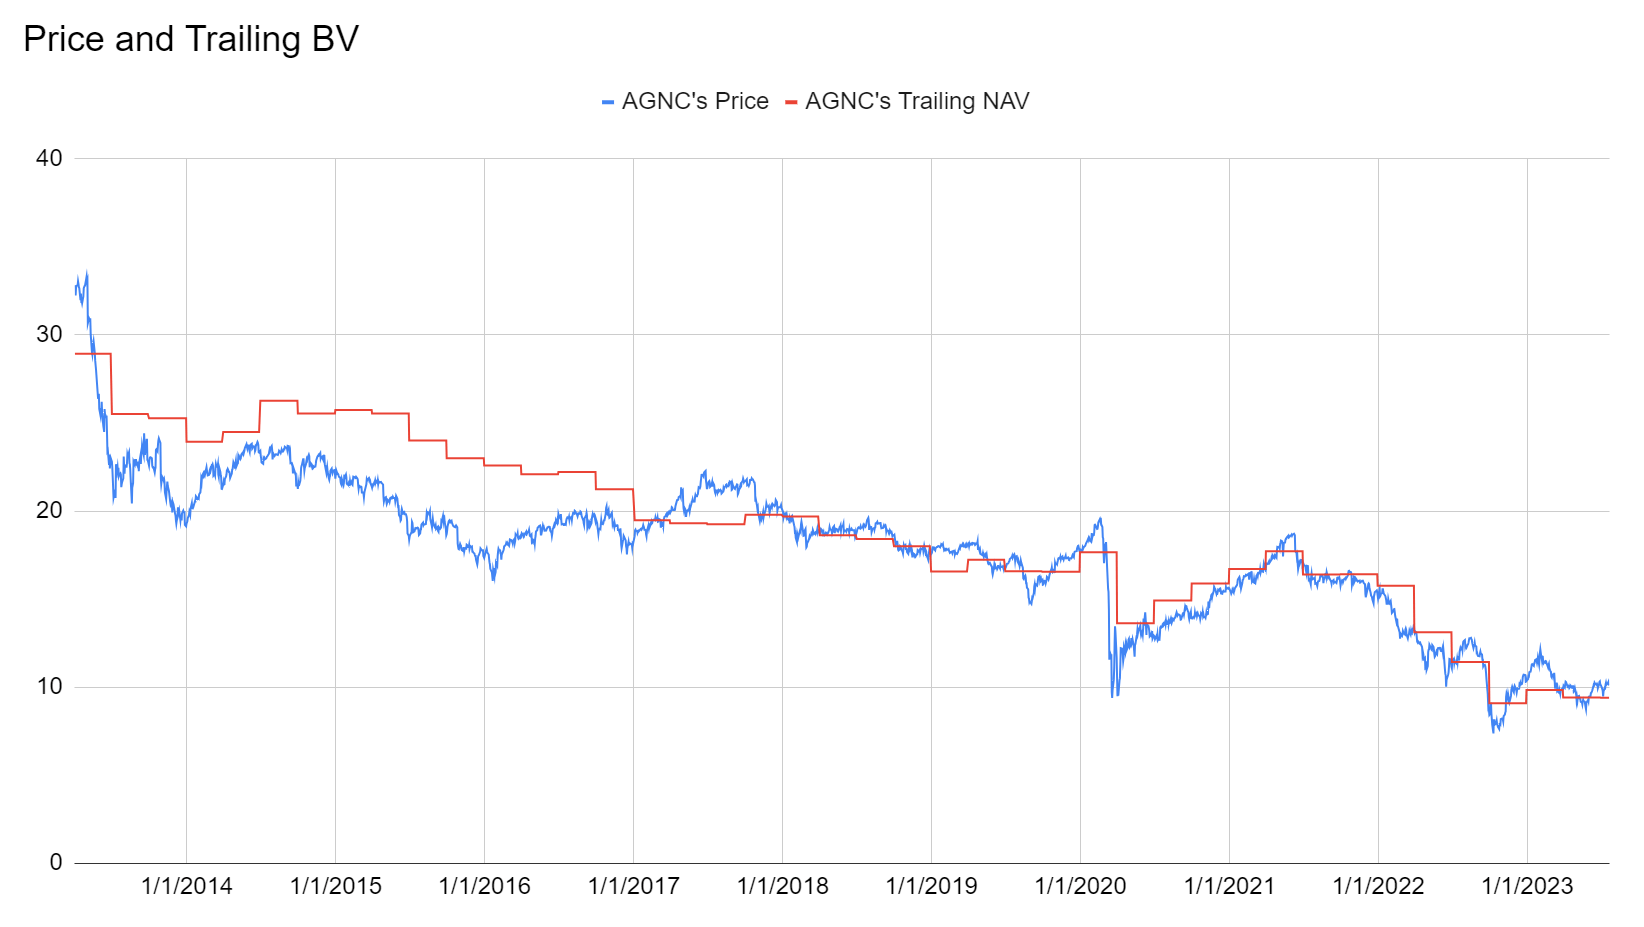
Book value is up moderately from the lowest levels, but share prices are still up quite substantially. The one downside with this chart is that as numbers trend lower, the gap between the bars shrinks even if the ratio is the same. I can reduce the impact by using a charter with a lower maximum value. To do that we simply shrink the time period:
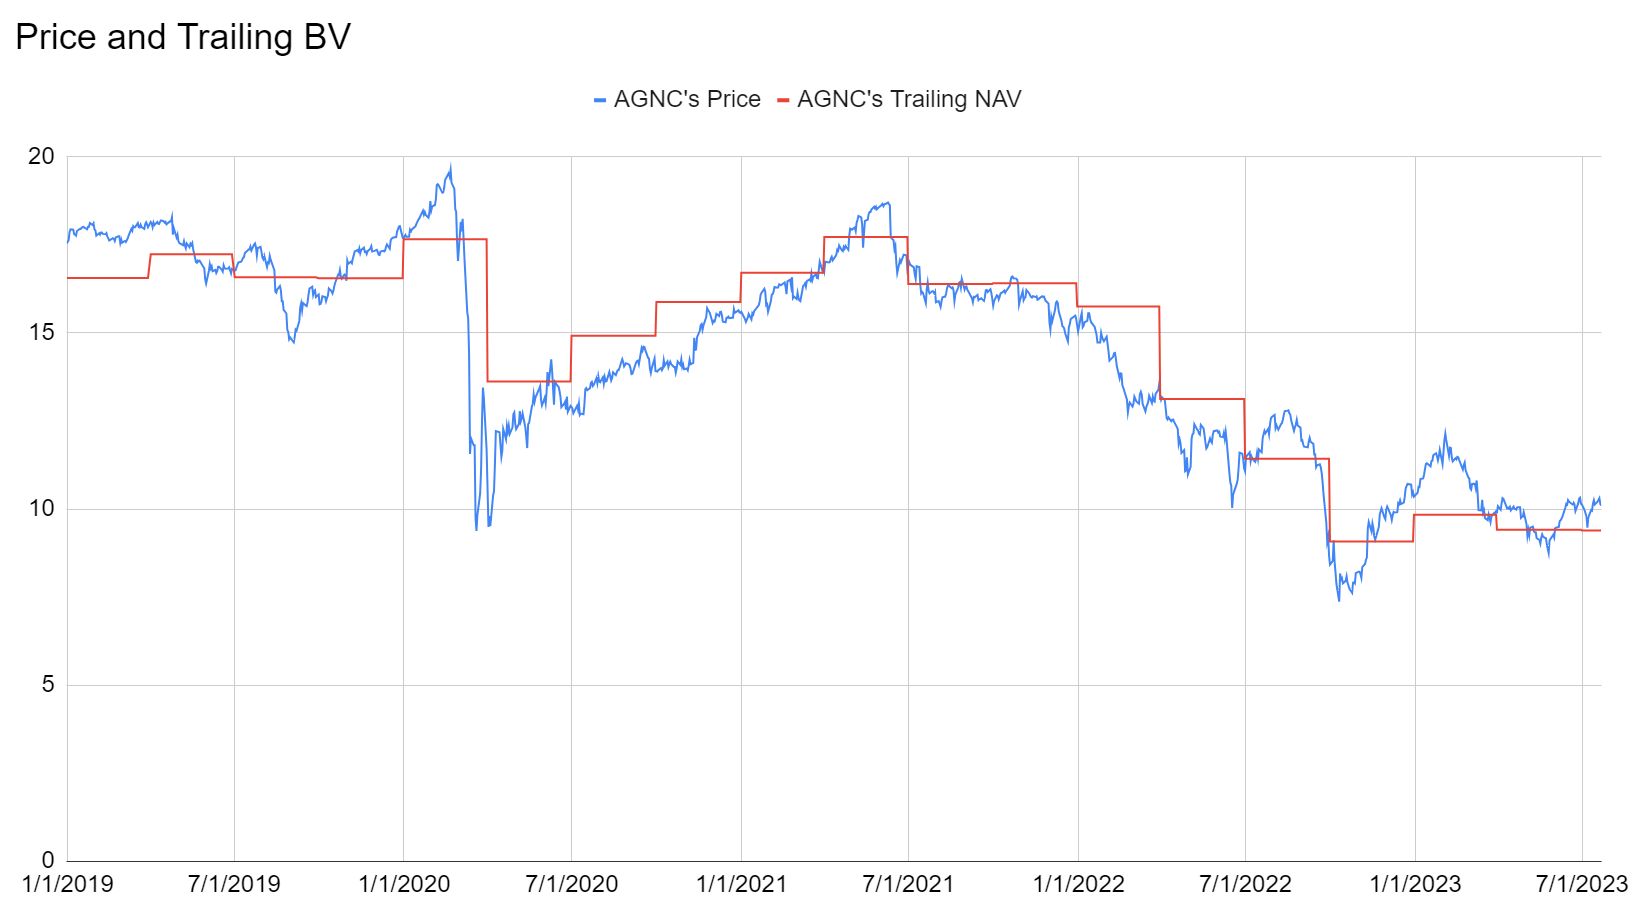
In my view, AGNC should do a secondary right away. As of uploading this, there has been no announcement to that effect.
I’m not going into a detailed description of any of the earnings here, though we do look through results very carefully to see which factors were contributing to better or worse performance.
So far it’s a good quarter for results with more positive surprises than negative surprises. Well, at least for these sectors.
We track the results across the sector in a larger image. I’ve edited this one to remove projections for most of the REITs that have not declared or previewed earnings yet:
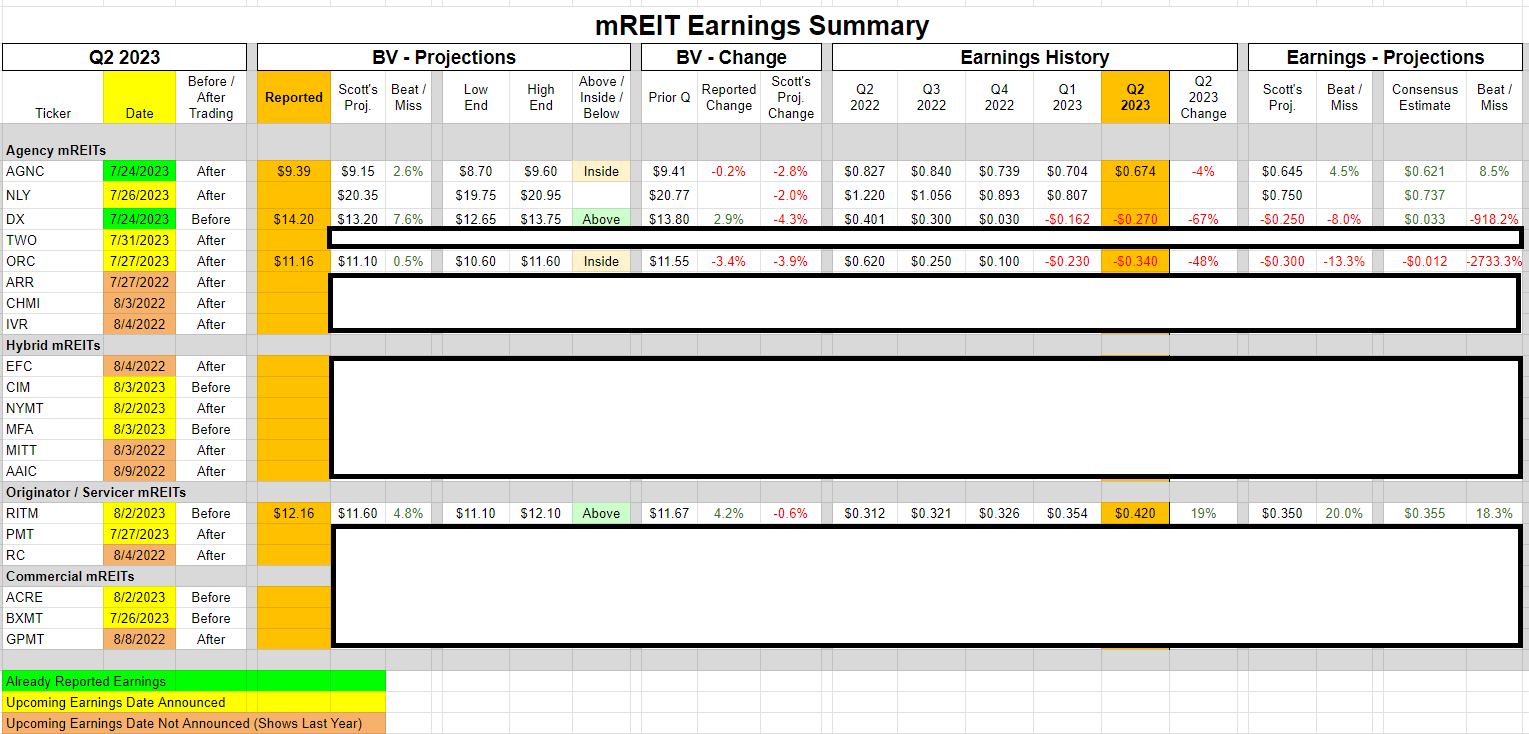
It’s a quick view for the expected upcoming announcements and a way to compare results throughout the sector. I kept the Annaly Capital Management ( NLY ) projections in for investors who are interested in NLY.
The midpoint of our range calls for a slight decline in BV. The top end would allow for a slight gain. We projected Core EPS at $.75, which is a bit higher than the consensus estimate at $.737.
I also left in the results for Rithm Capital ( RITM ) as they posted a preview of their earnings. Great results. Drove the share price higher.
Baby Bond
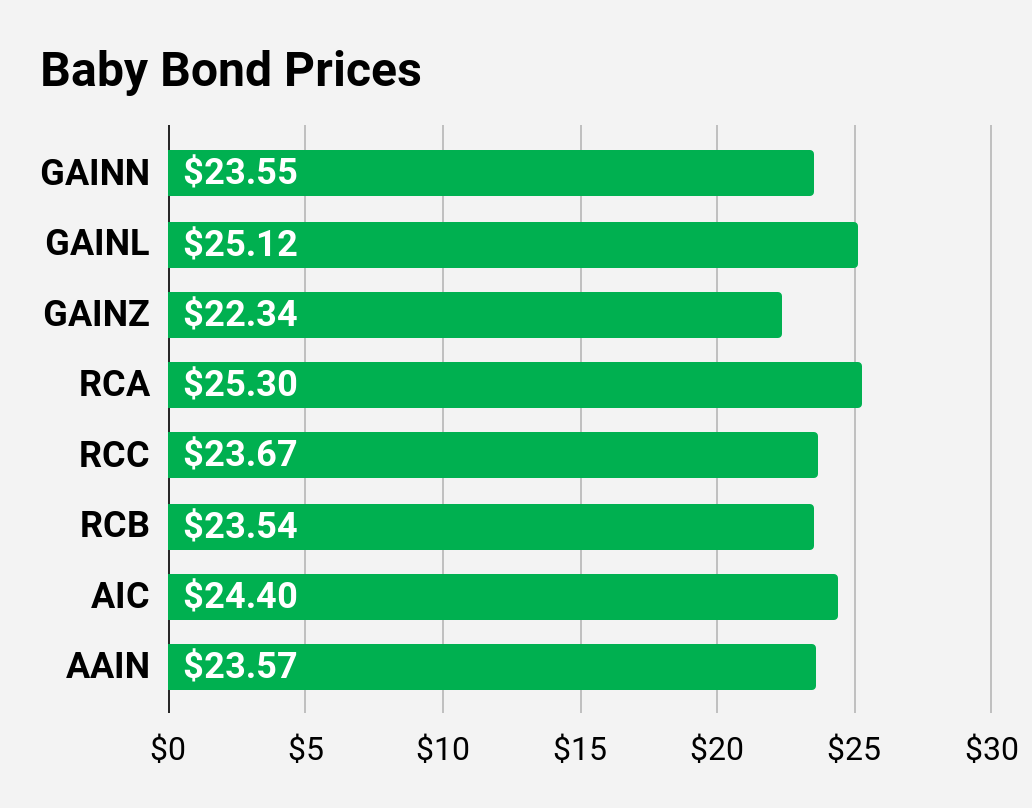
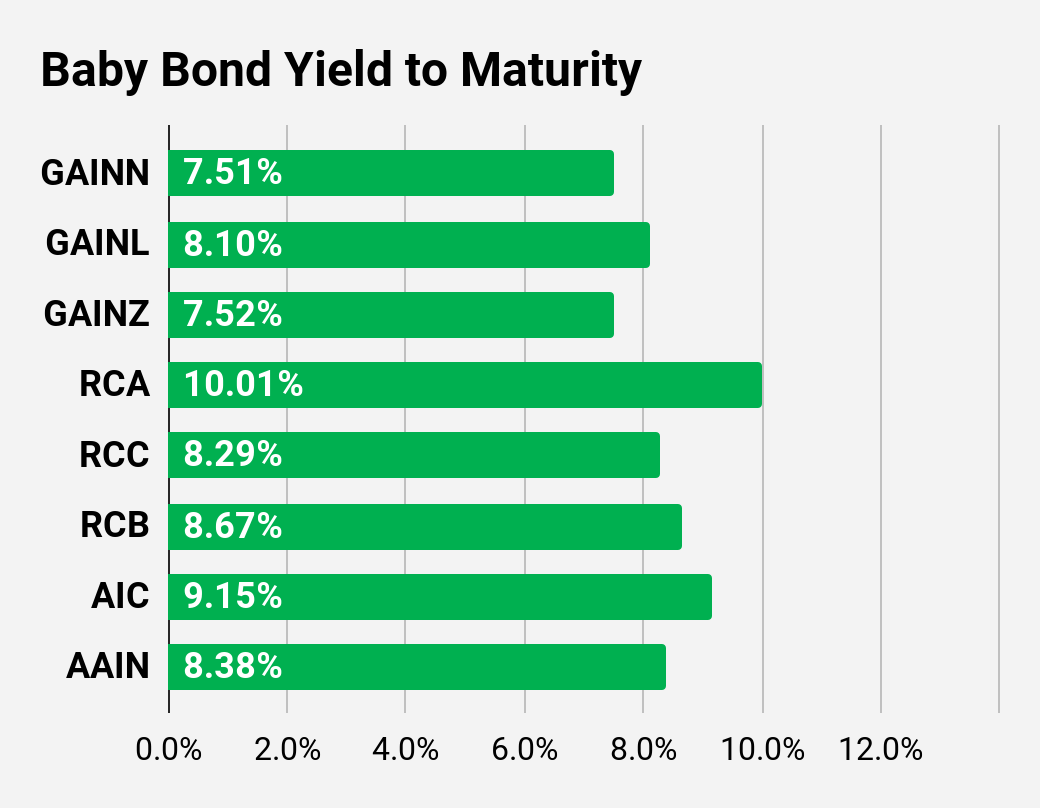
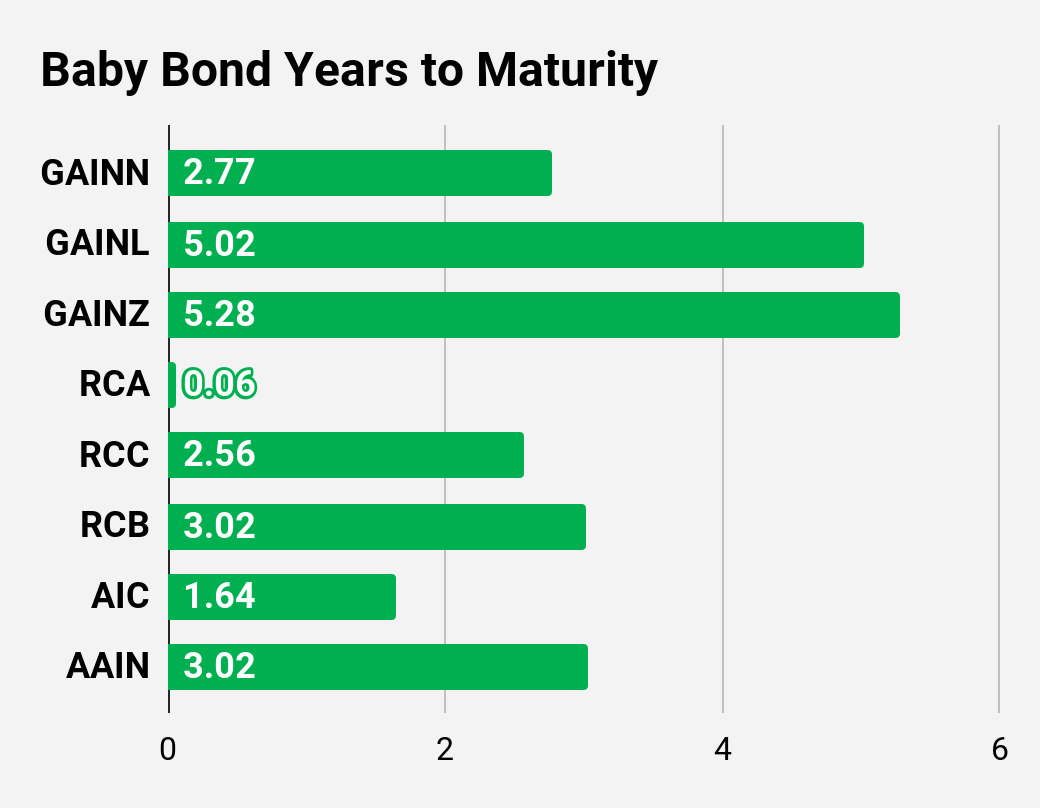
RCA ( RCA ) caught our attention as an alluring baby bond offering a compelling yield and a remarkably short time to maturity. Its shares will reach maturity on 8/15/2023, meaning our position will last just over 3 weeks. Anticipating the final interest payment along with maturity, we project a per-share return of approximately $25.4375. Mark your calendar for 7/31/2023, we expect that to be the ex-dividend date for the last interest payment.
While it lacks a substantial deviation from target prices, even if acquired at $25.28 (the price I initially intended to invest), it would have still yielded nearly 11% annually. A crucial factor enabling this move is the absence of trading commissions. Keep in mind, our gain amounts to a modest $0.16 per share.
As of 7/25/2023, RCA is at $25.31. Yield to maturity at that price is $9.25%. Each day we move closer increases the yield, but each penny higher in the price decreases it. This is really just for investors looking to park a bit of cash for a few weeks, or investors who want to cross “hold a bond to maturity” off their bucket list.
Stock Table
We will close out the rest of the article with the tables and charts we provide for readers to help them track the sector for both common shares and preferred shares.
We’re including a quick table for the common shares that will be shown in our tables:
| Type of REIT or BDC |
| Residential Agency |
| Residential Hybrid |
| Residential Originator and Servicer |
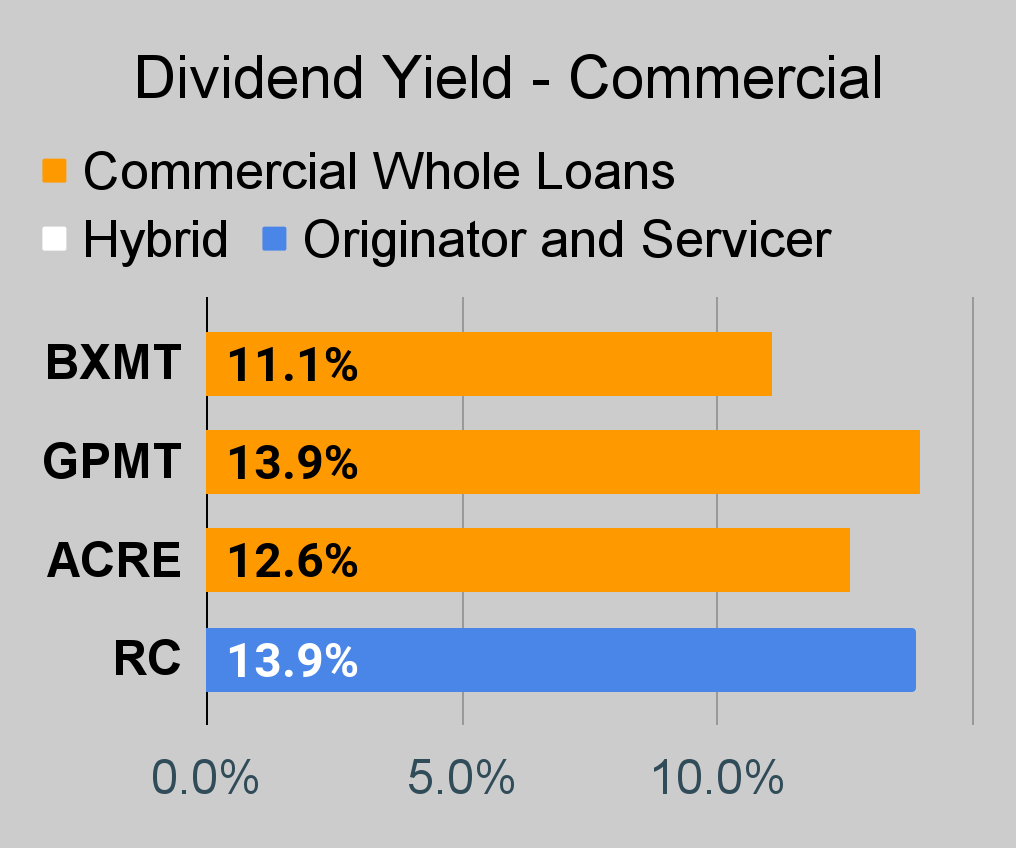
| Commercial |
| BDC |
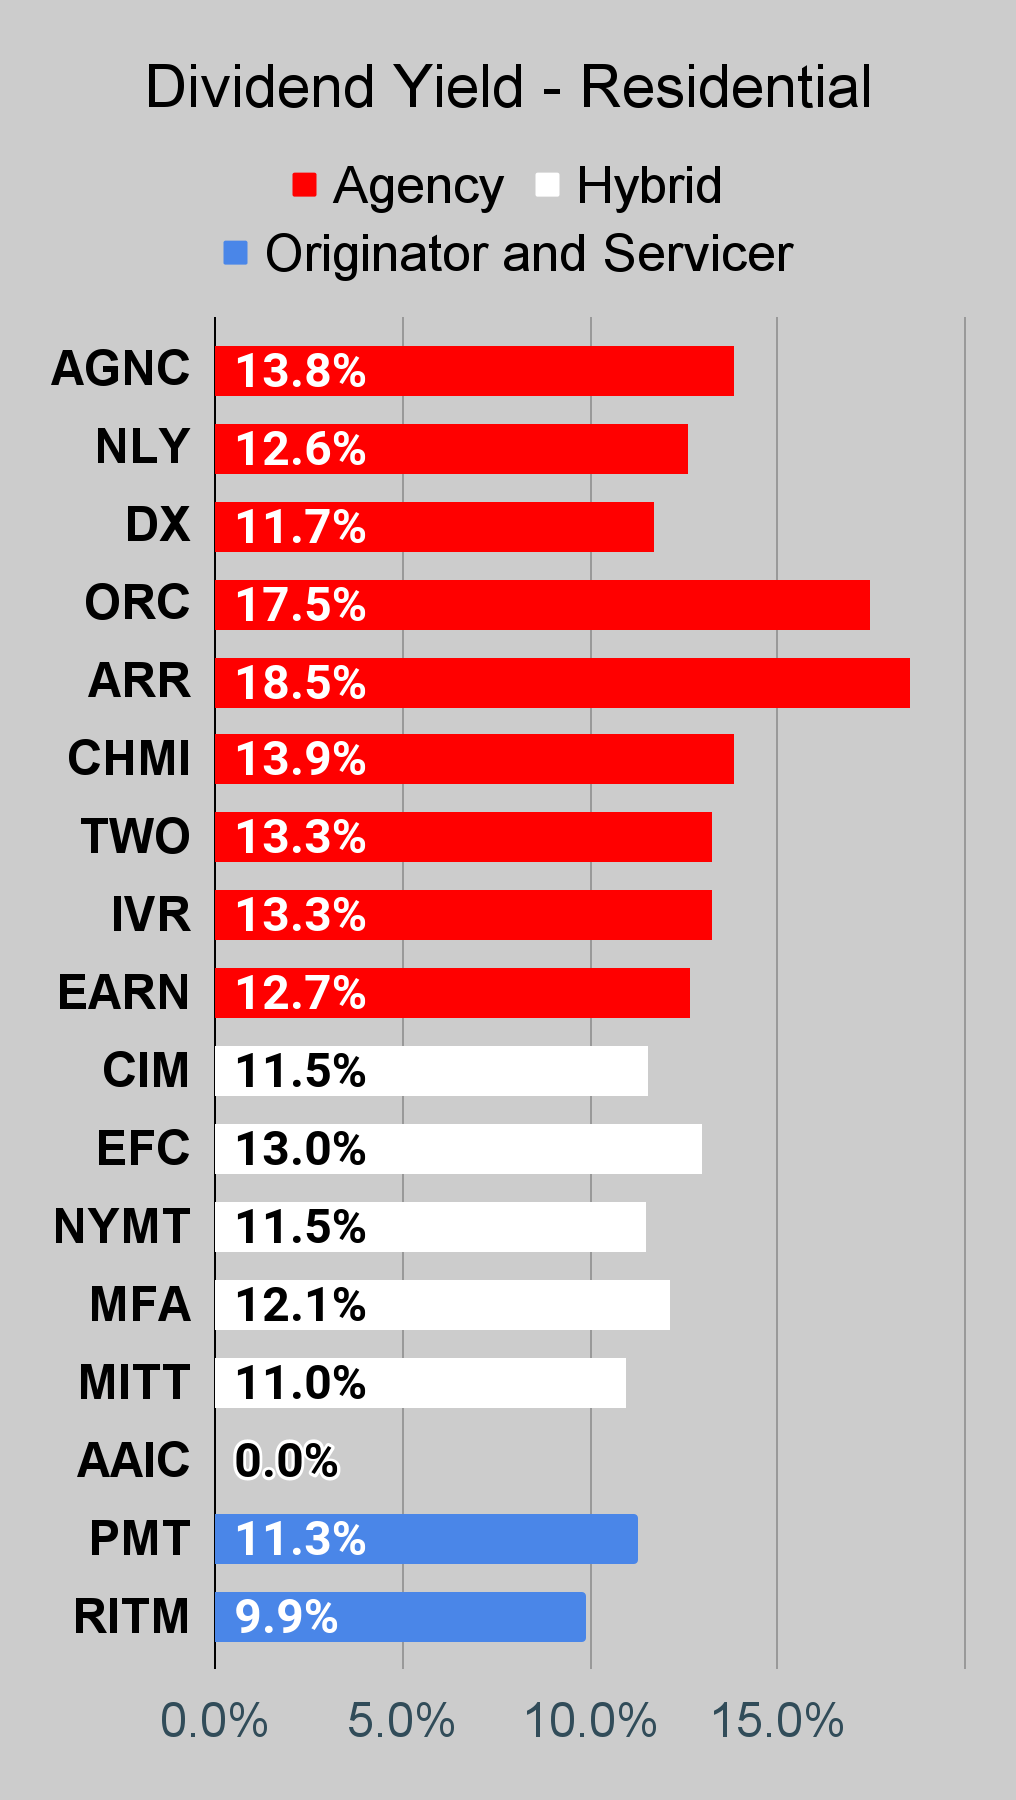
If you’re looking for a stock and I haven’t mentioned it yet, you’ll still find it in the charts below. The charts contain comparisons based on price-to-book value, dividend yields, and earnings yield. You won’t find these tables anywhere else.
For mortgage REITs, please look at the charts for AGNC, NLY, DX, ORC, ARR, CHMI, TWO, IVR, EARN, CIM, EFC, NYMT, MFA, MITT, AAIC, PMT, RITM, BXMT, GPMT, WMC, and RC.
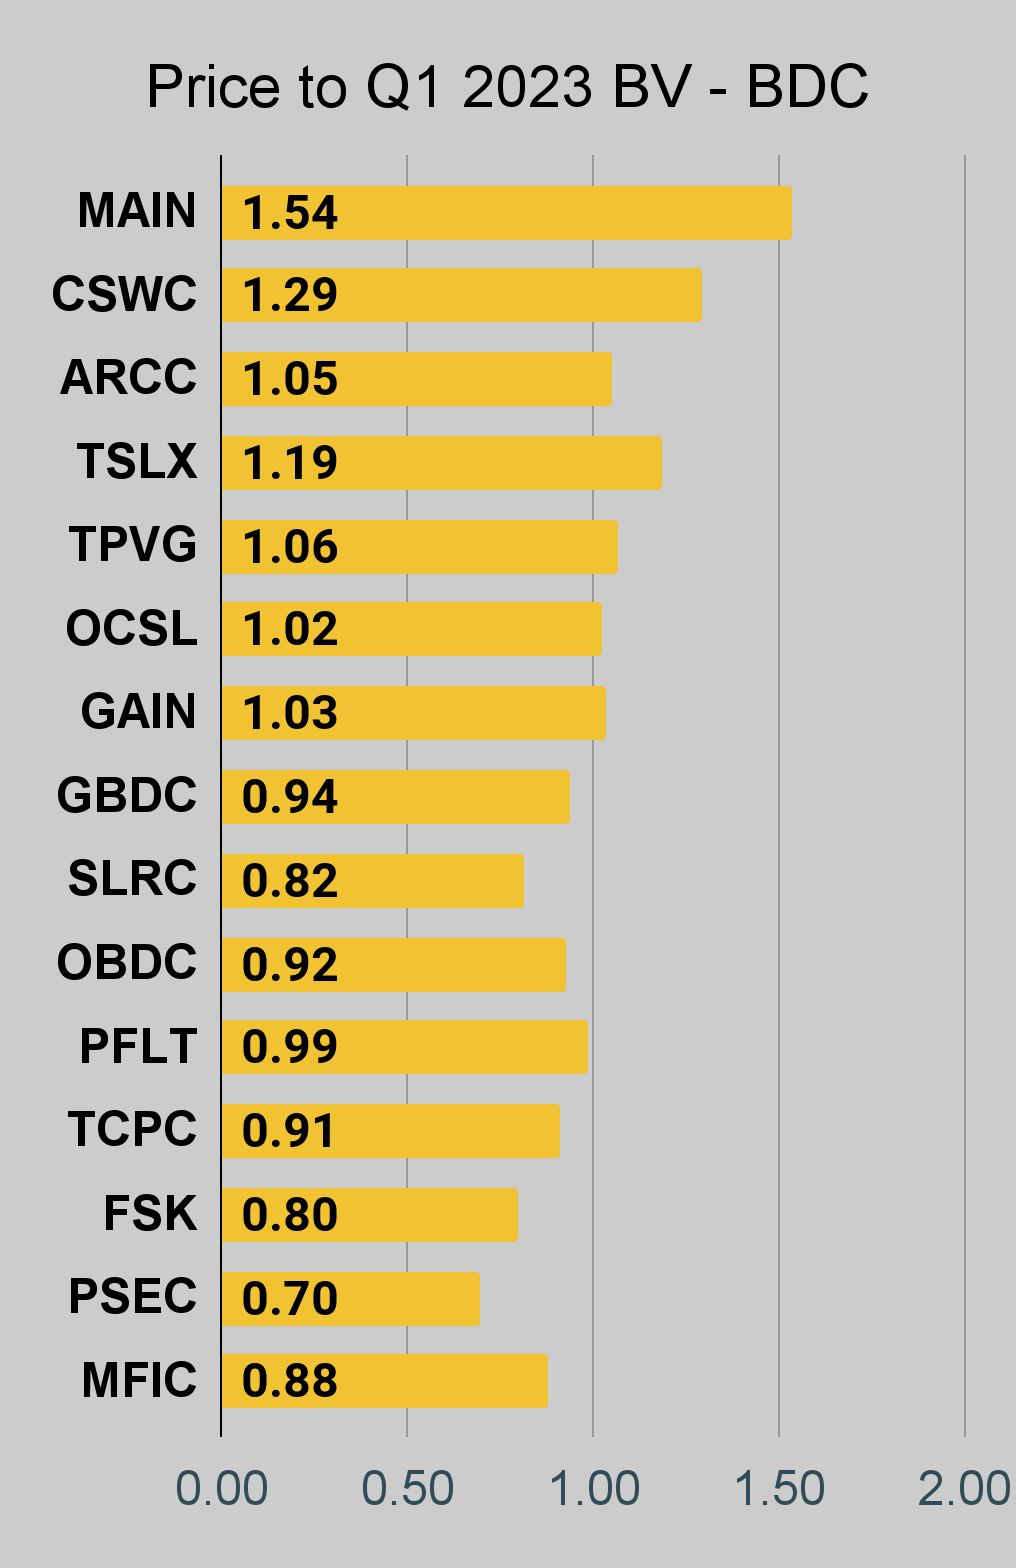
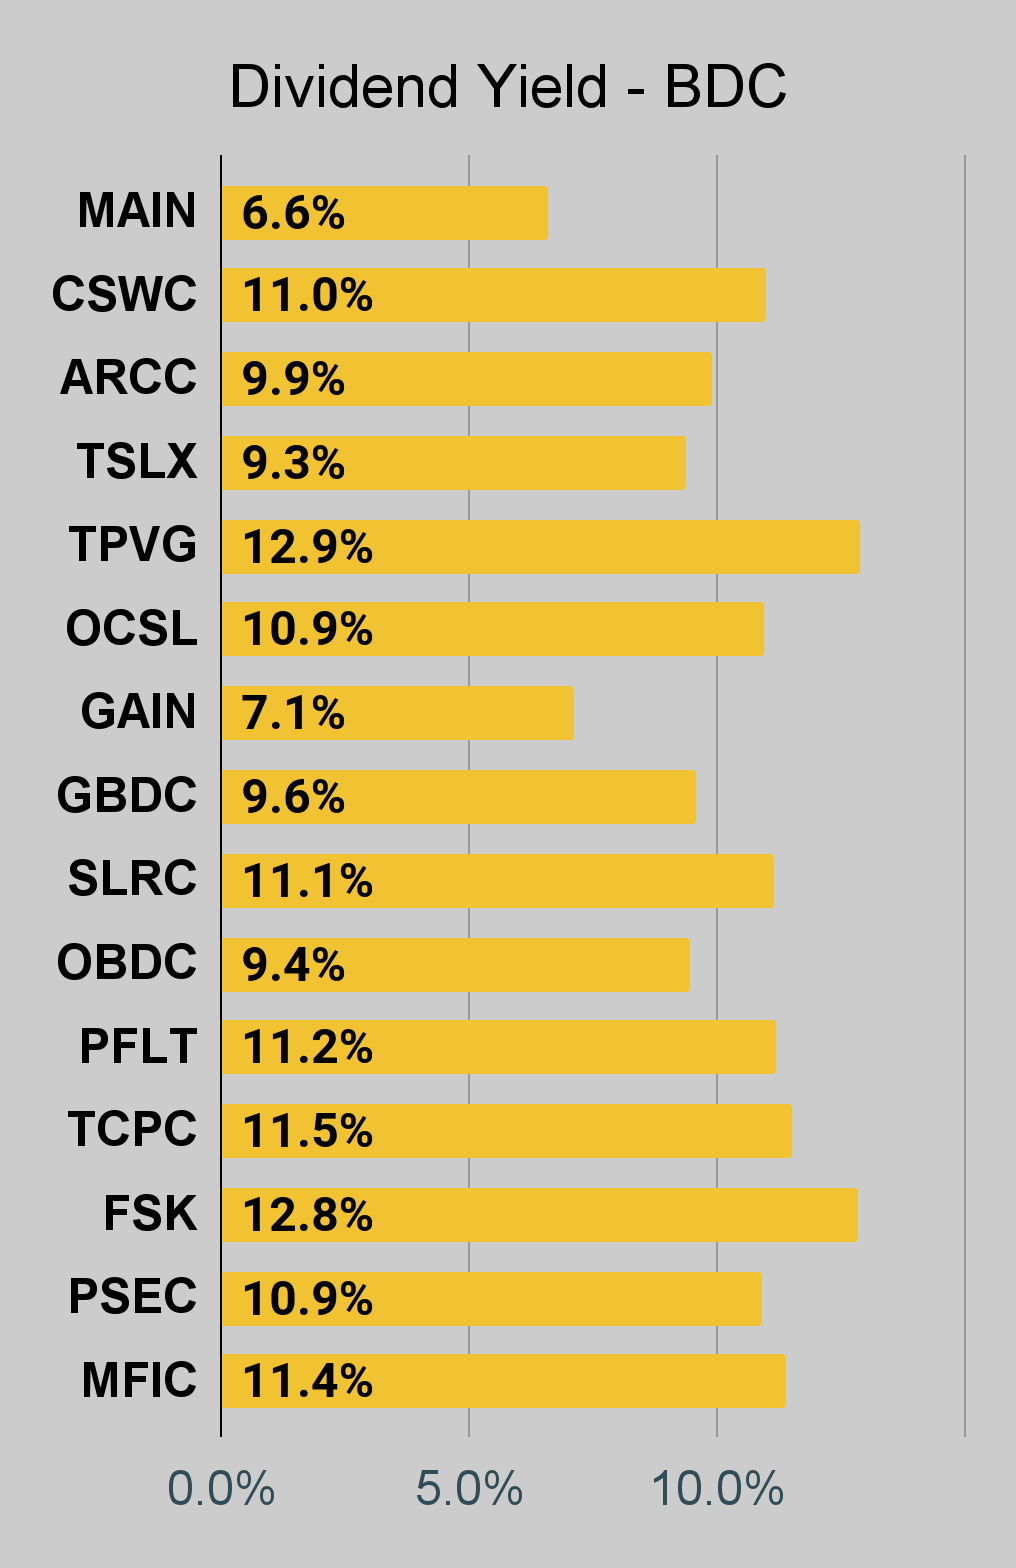
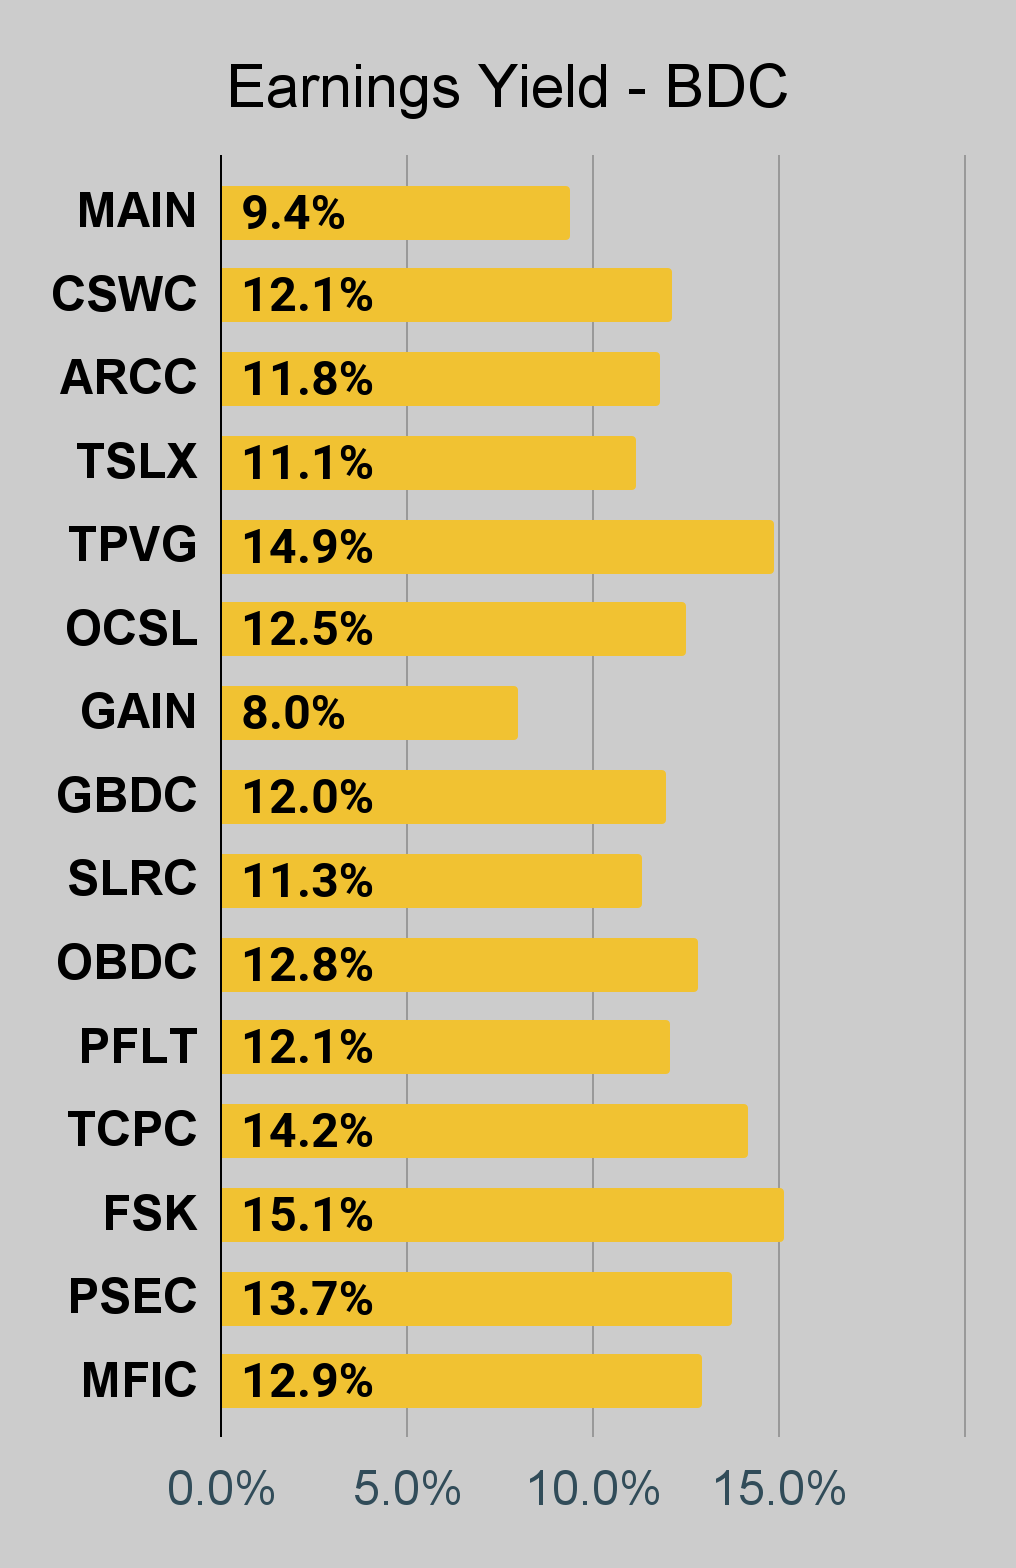
For BDCs, please look at the charts for MAIN, CSWC, ARCC, TSLX, TPVG, OCSL, GAIN, GBDC, SLRC, ORCC, PFLT, TCPC, FSK, PSEC, and MFIC.
This series is the easiest place to find charts providing up-to-date comparisons across the sector.
Residential Mortgage REIT Charts
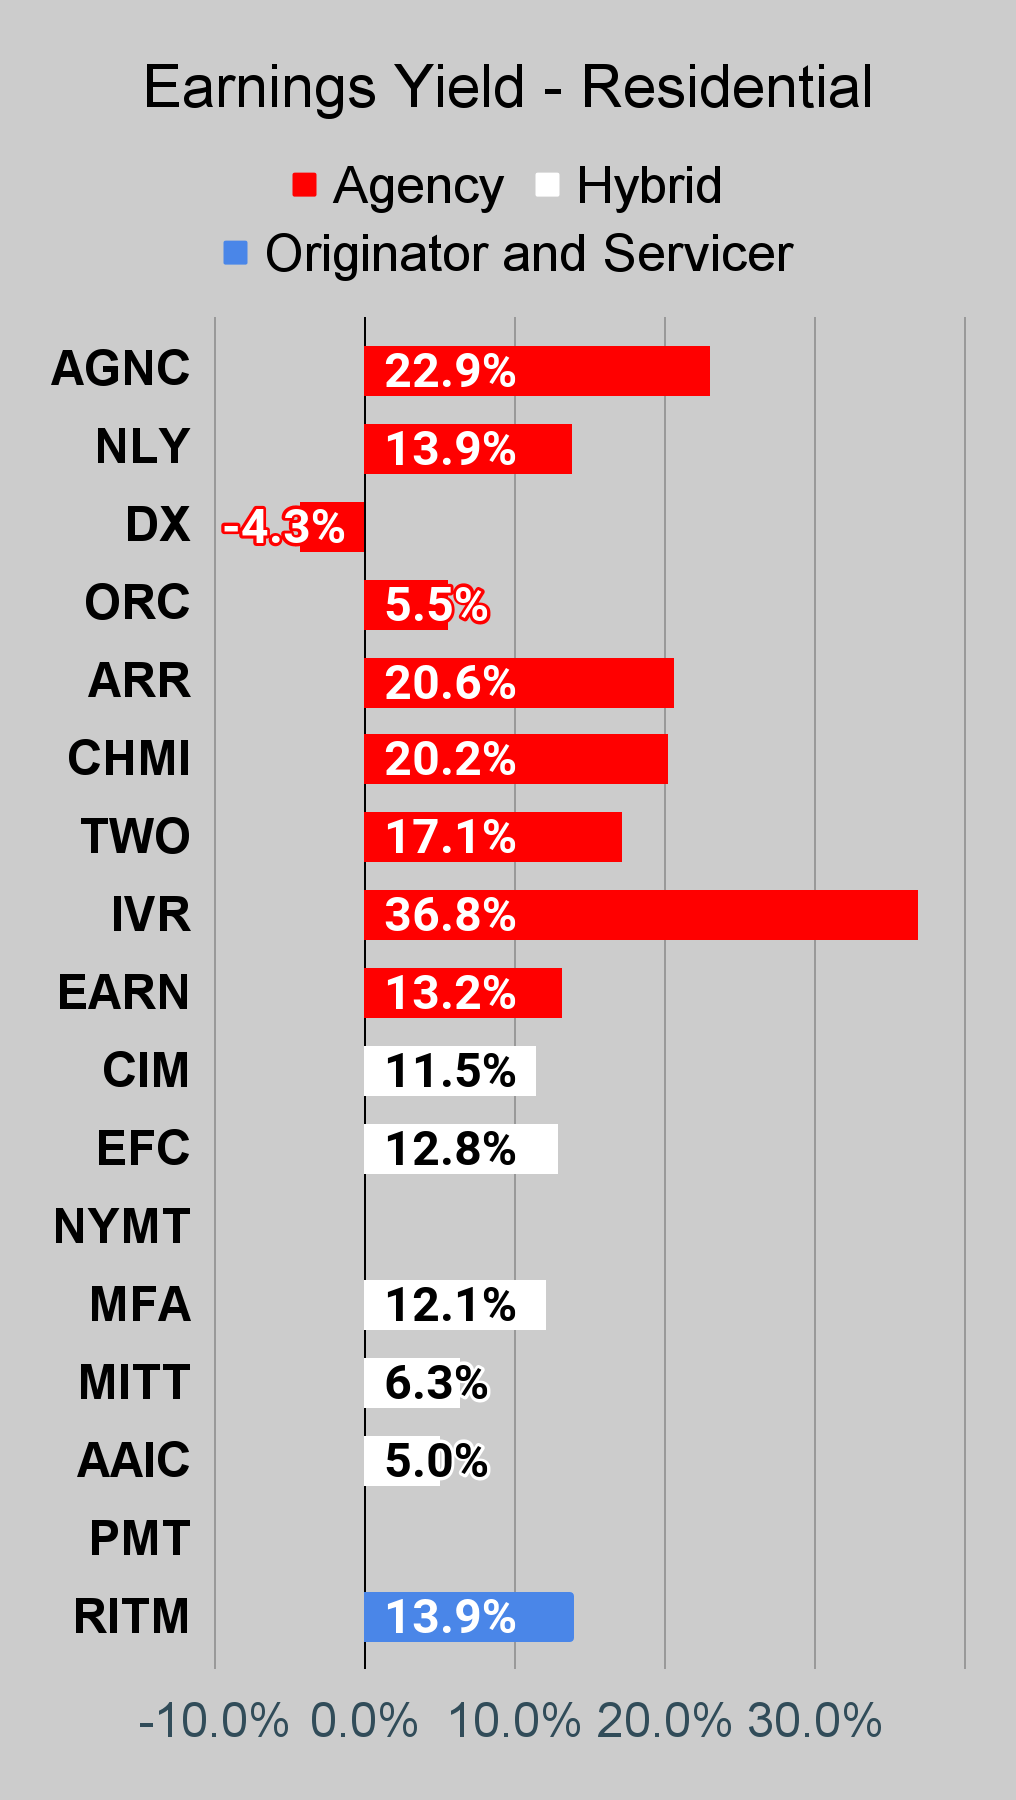
Note: The chart for our public articles uses the book value per share from the latest earnings release. Current estimated book value per share is used in reaching our targets and trading decisions. It is available in our service, but those estimates are not included in the charts below. PMT and NYMT are not showing an earnings yield metric as neither REIT provides a quarterly “Core EPS” metric. Presently, a few other REITs also have no consensus estimate.
Second Note: Due to the way historical amortized cost and hedging is factored into the earnings metrics, it is possible for two mortgage REITs with similar portfolios to post materially different metrics for earnings. I would be very cautious about putting much emphasis on the consensus analyst estimate (which is used to determine the earnings yield). In particular, throughout late 2022 the earnings metric became less comparable for many REITs.
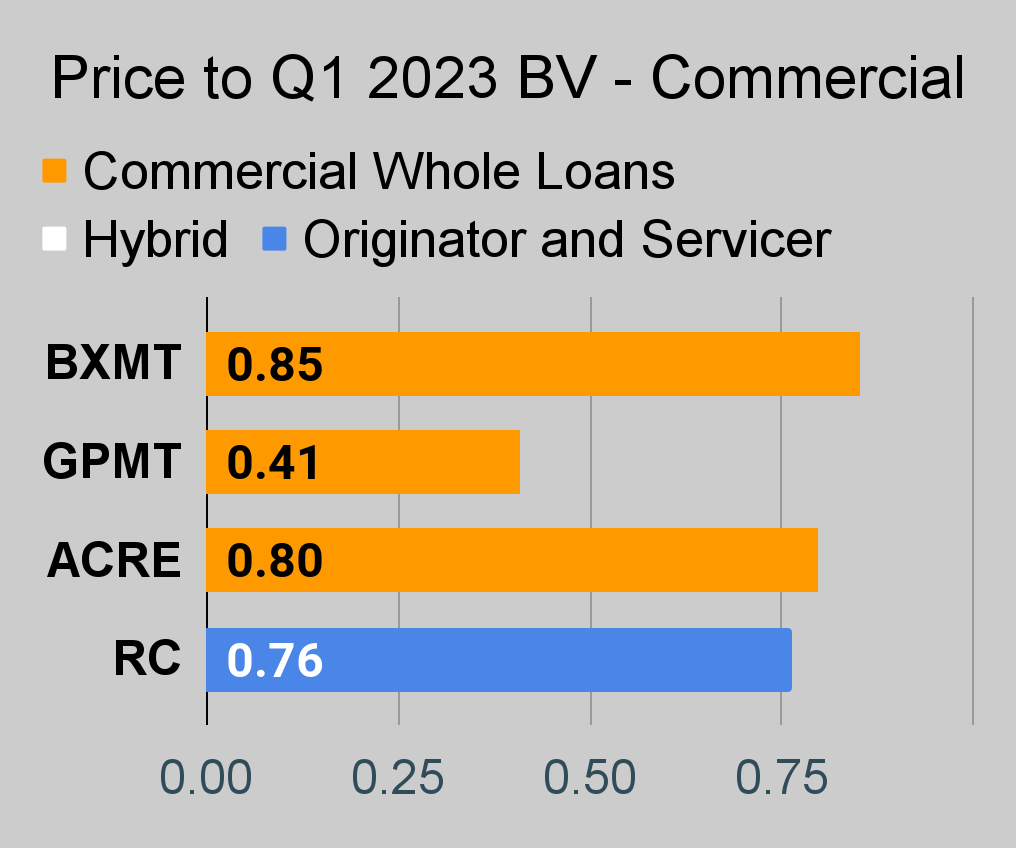
Commercial Mortgage REIT Charts
BDC Charts
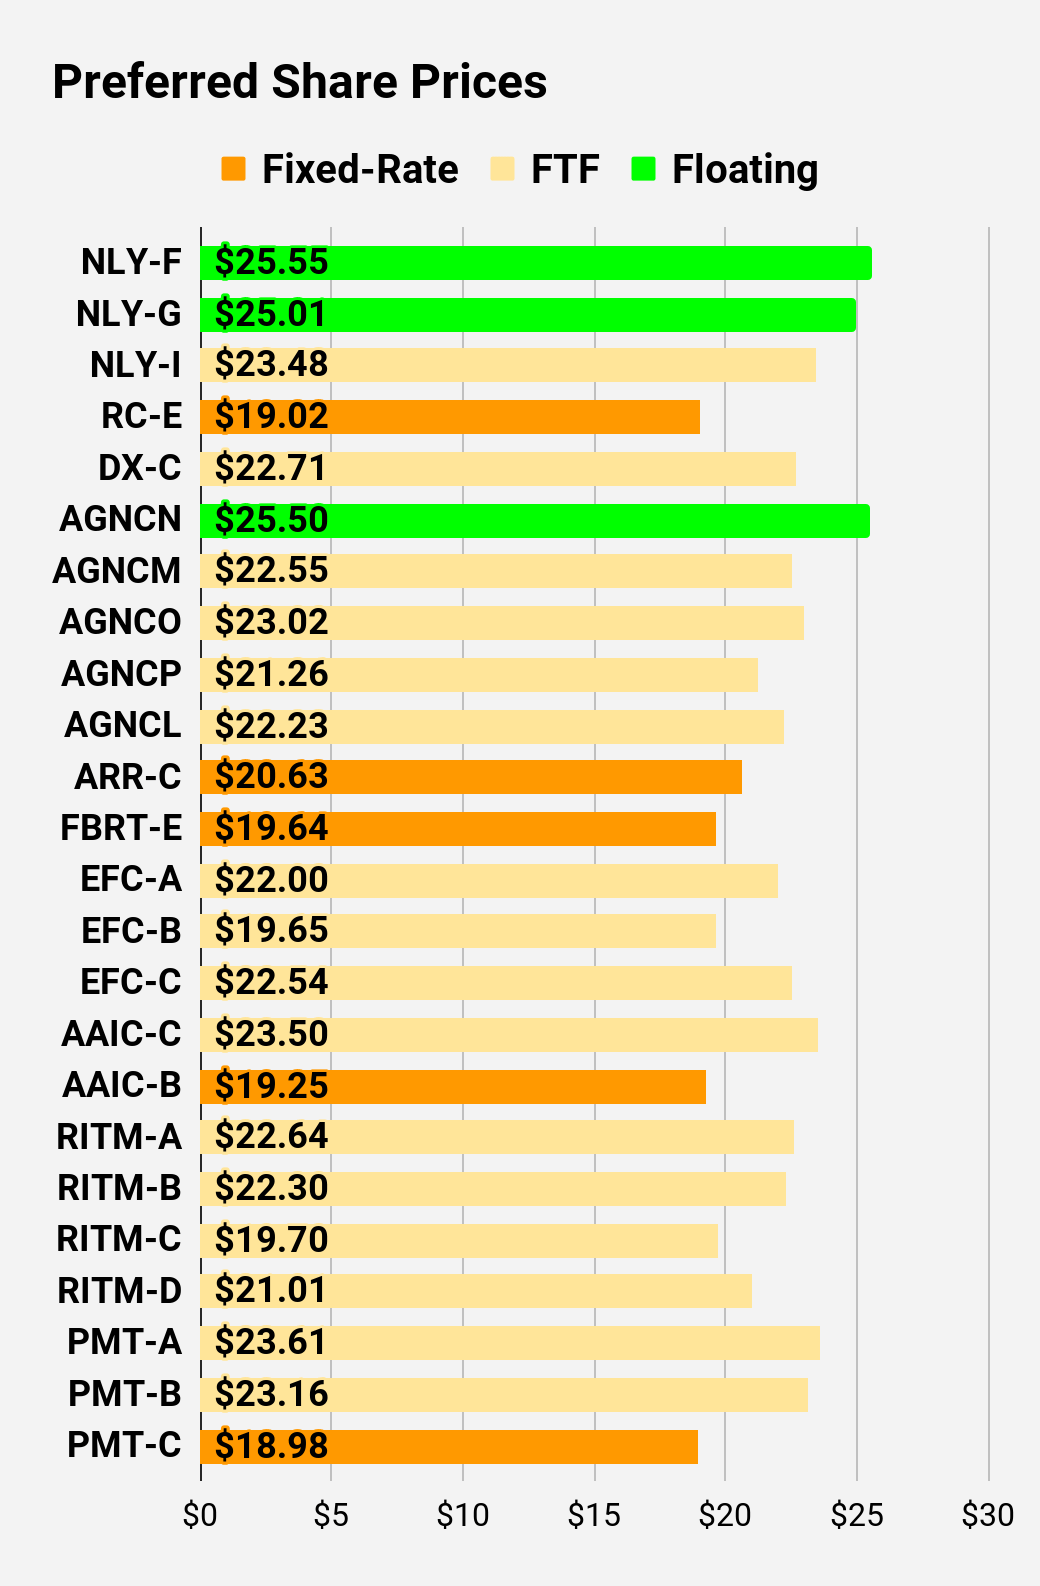
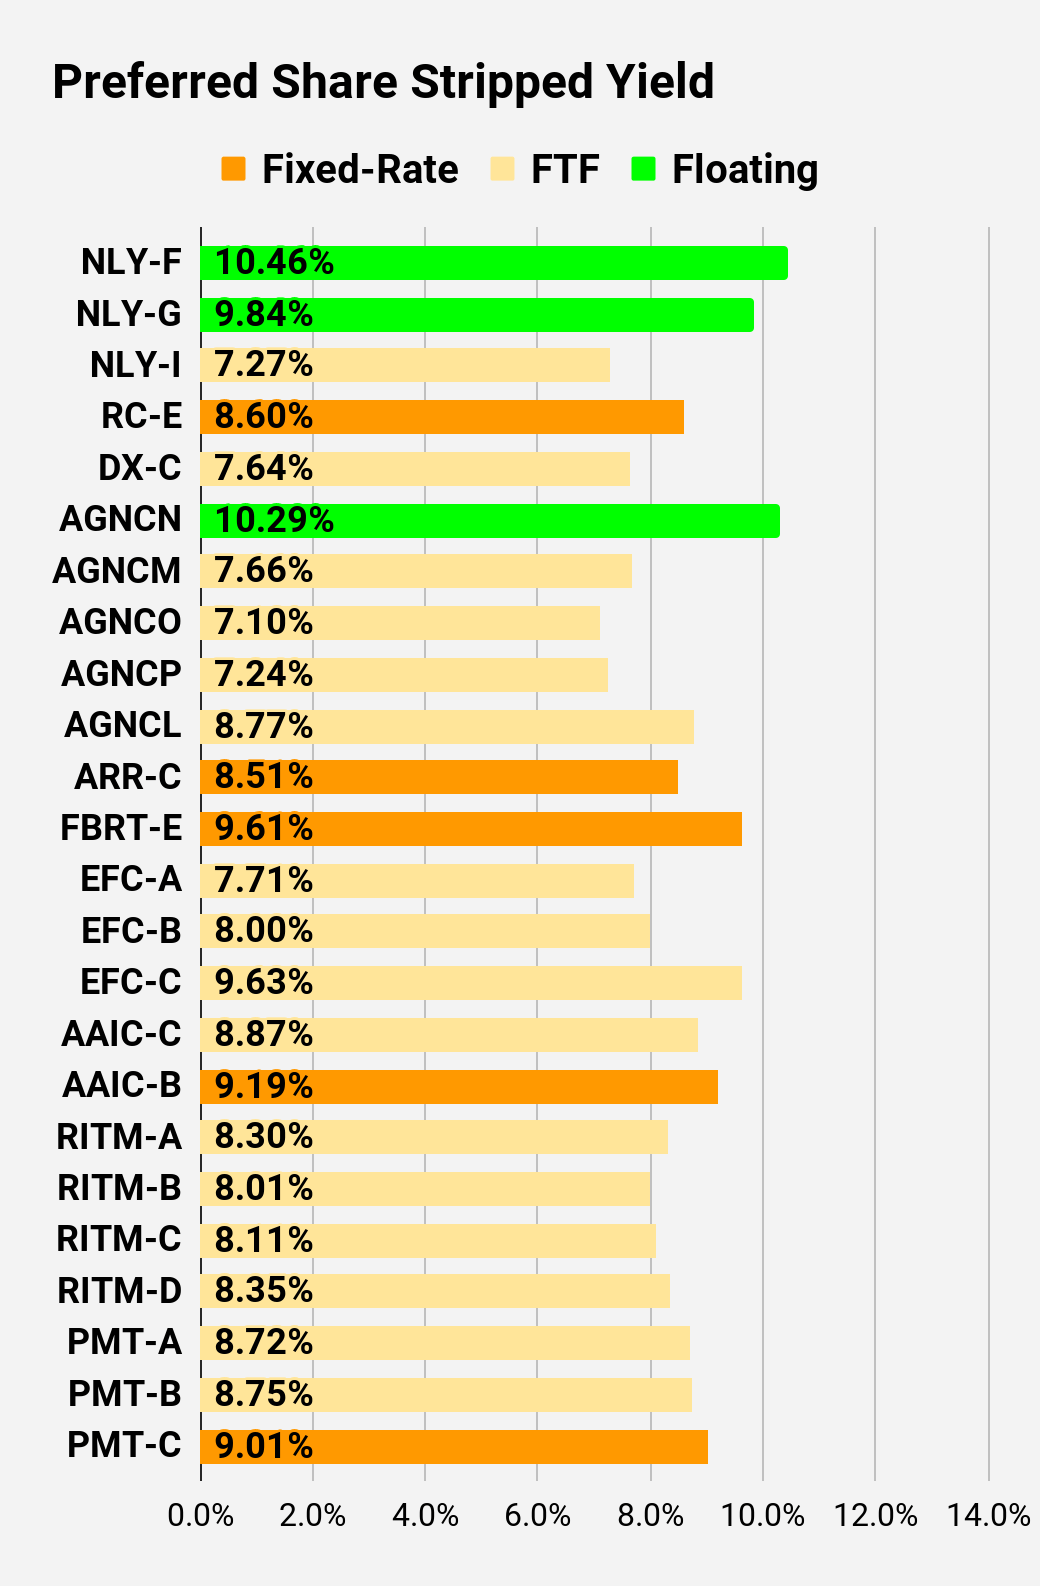
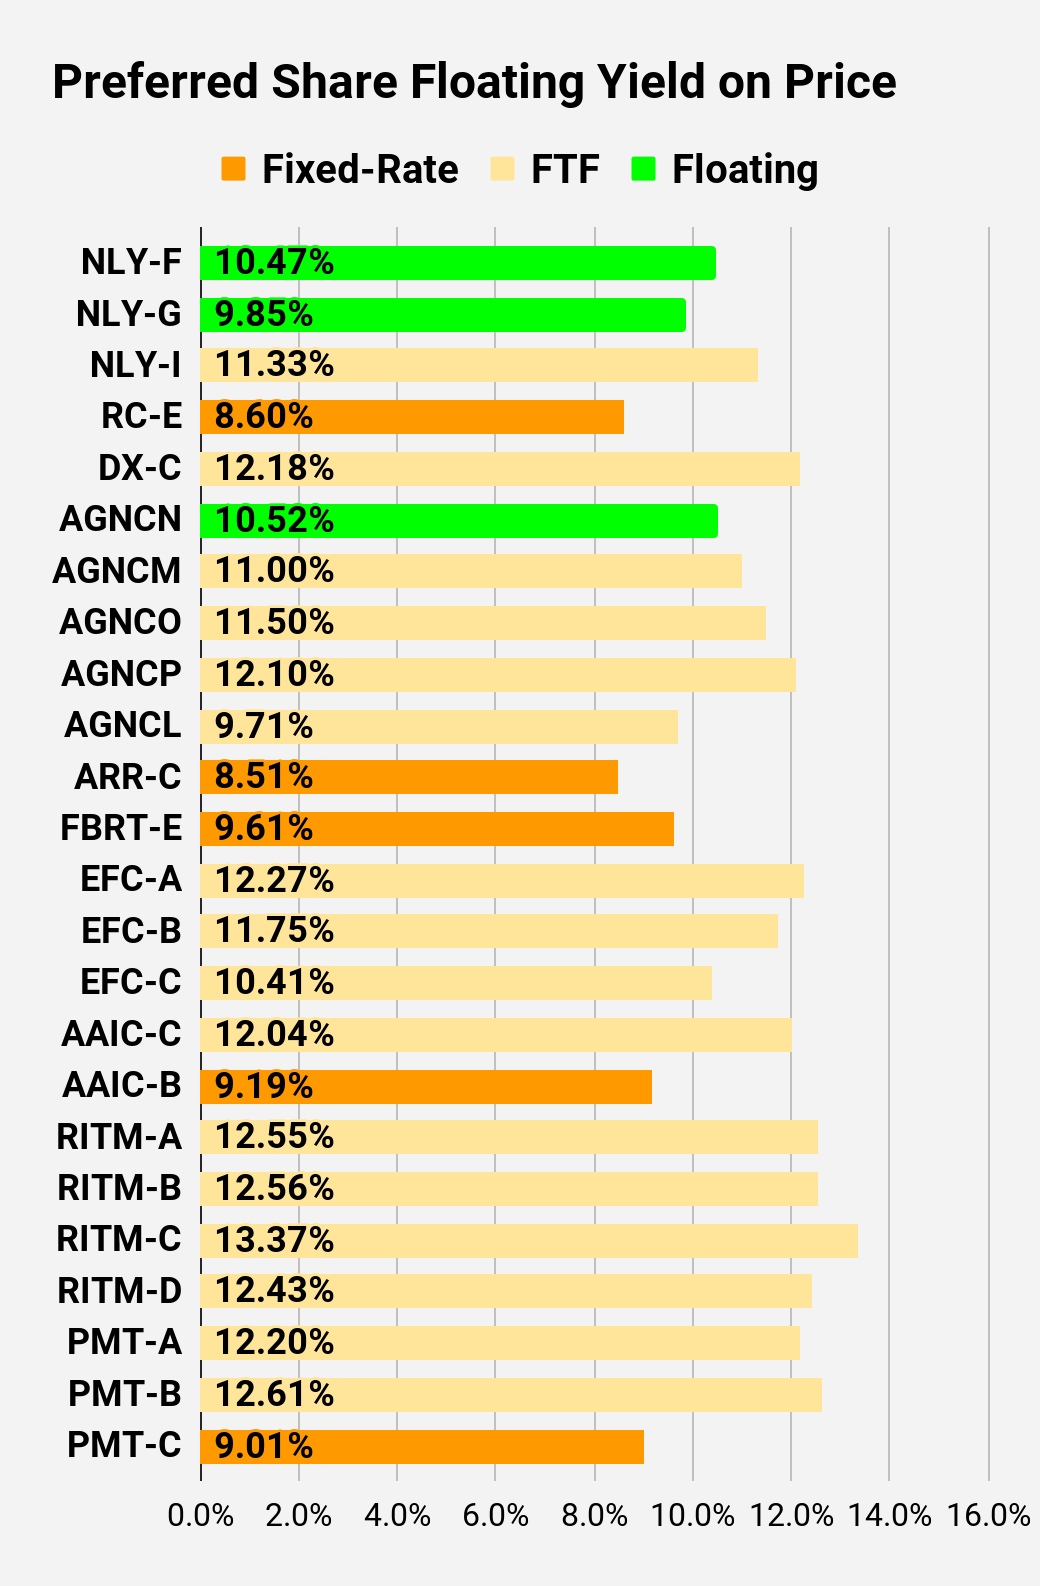
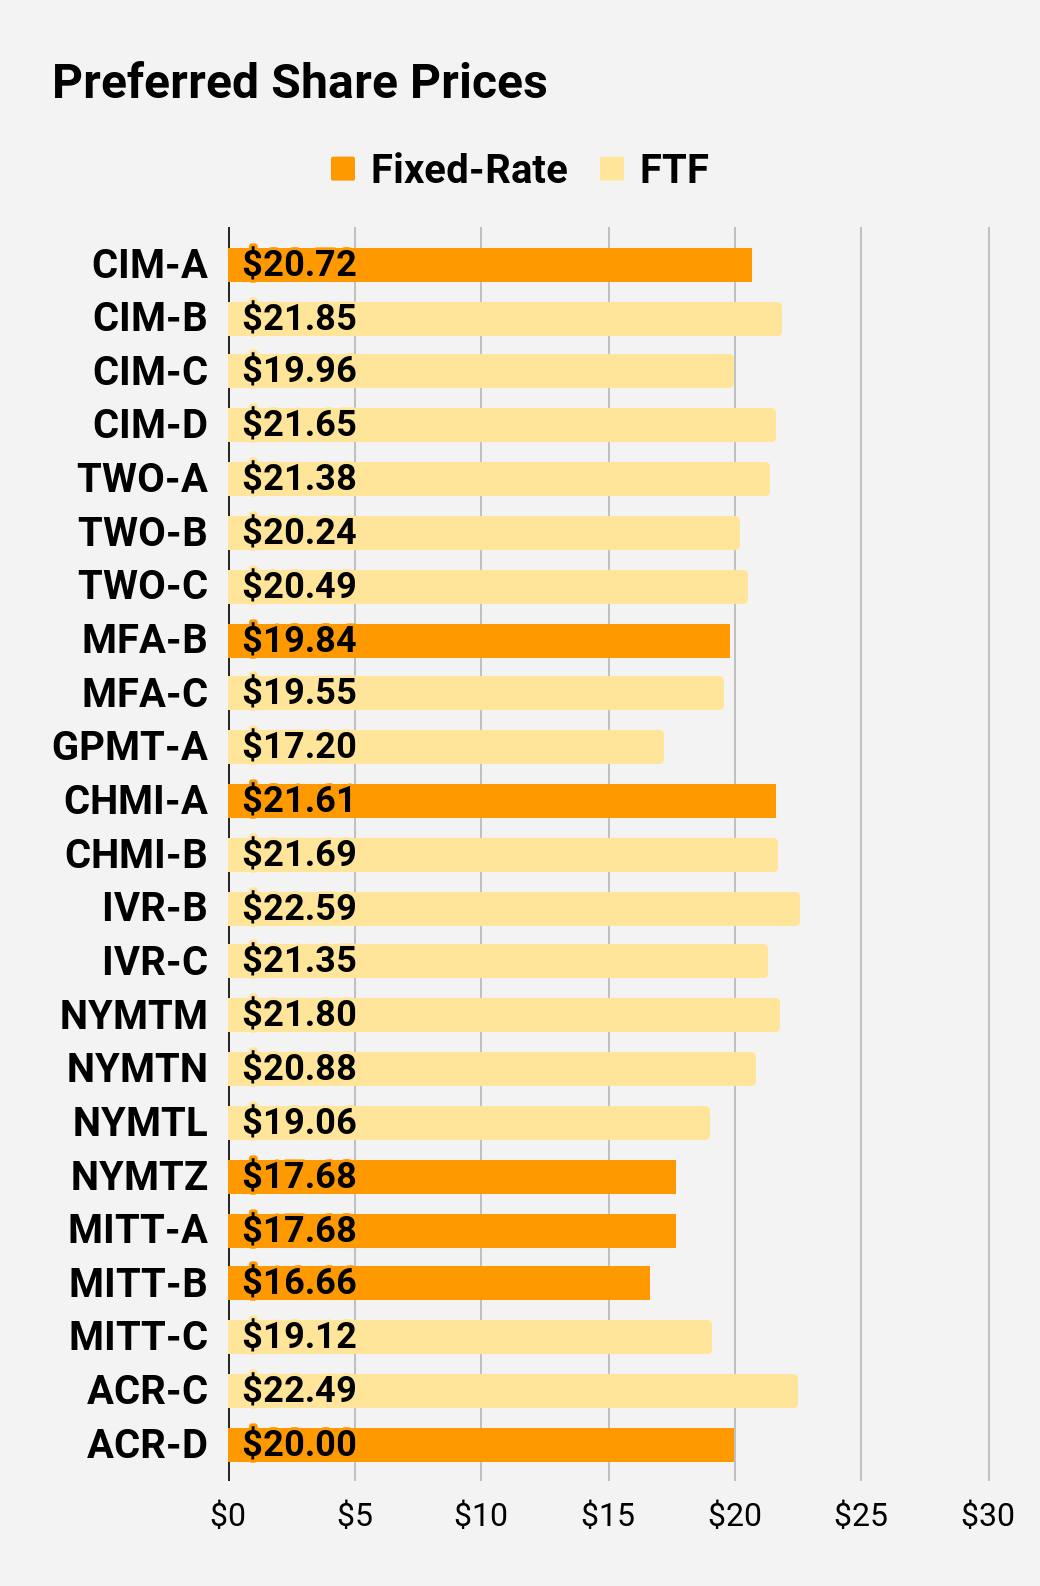
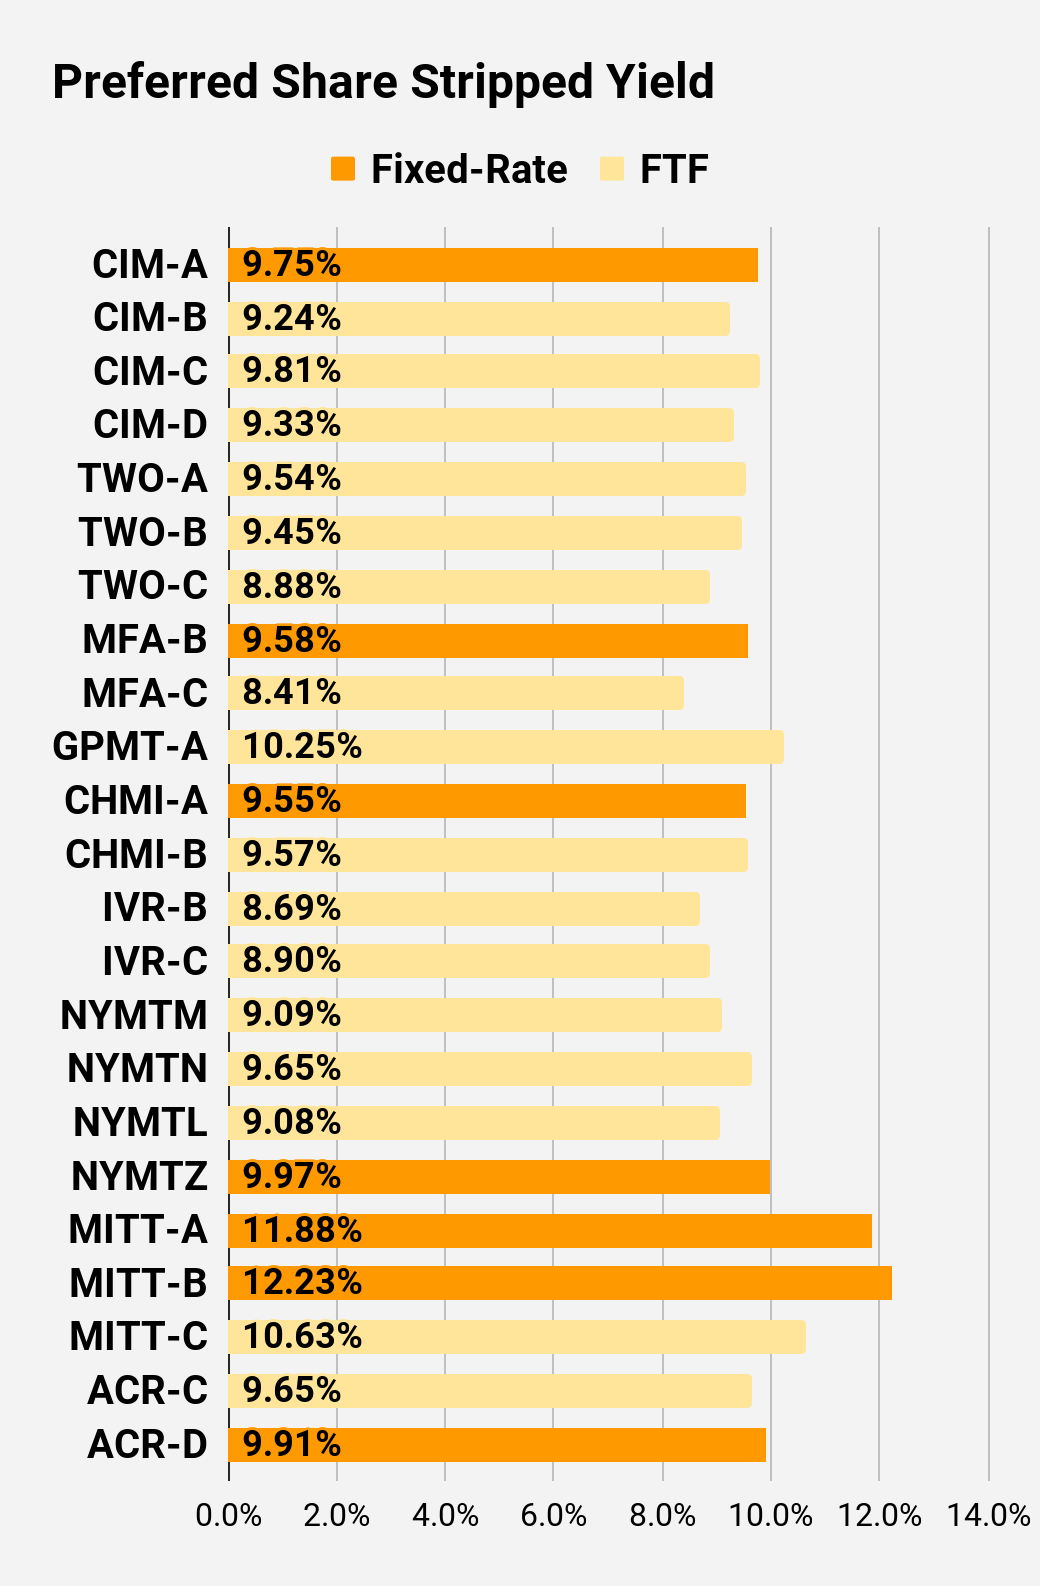
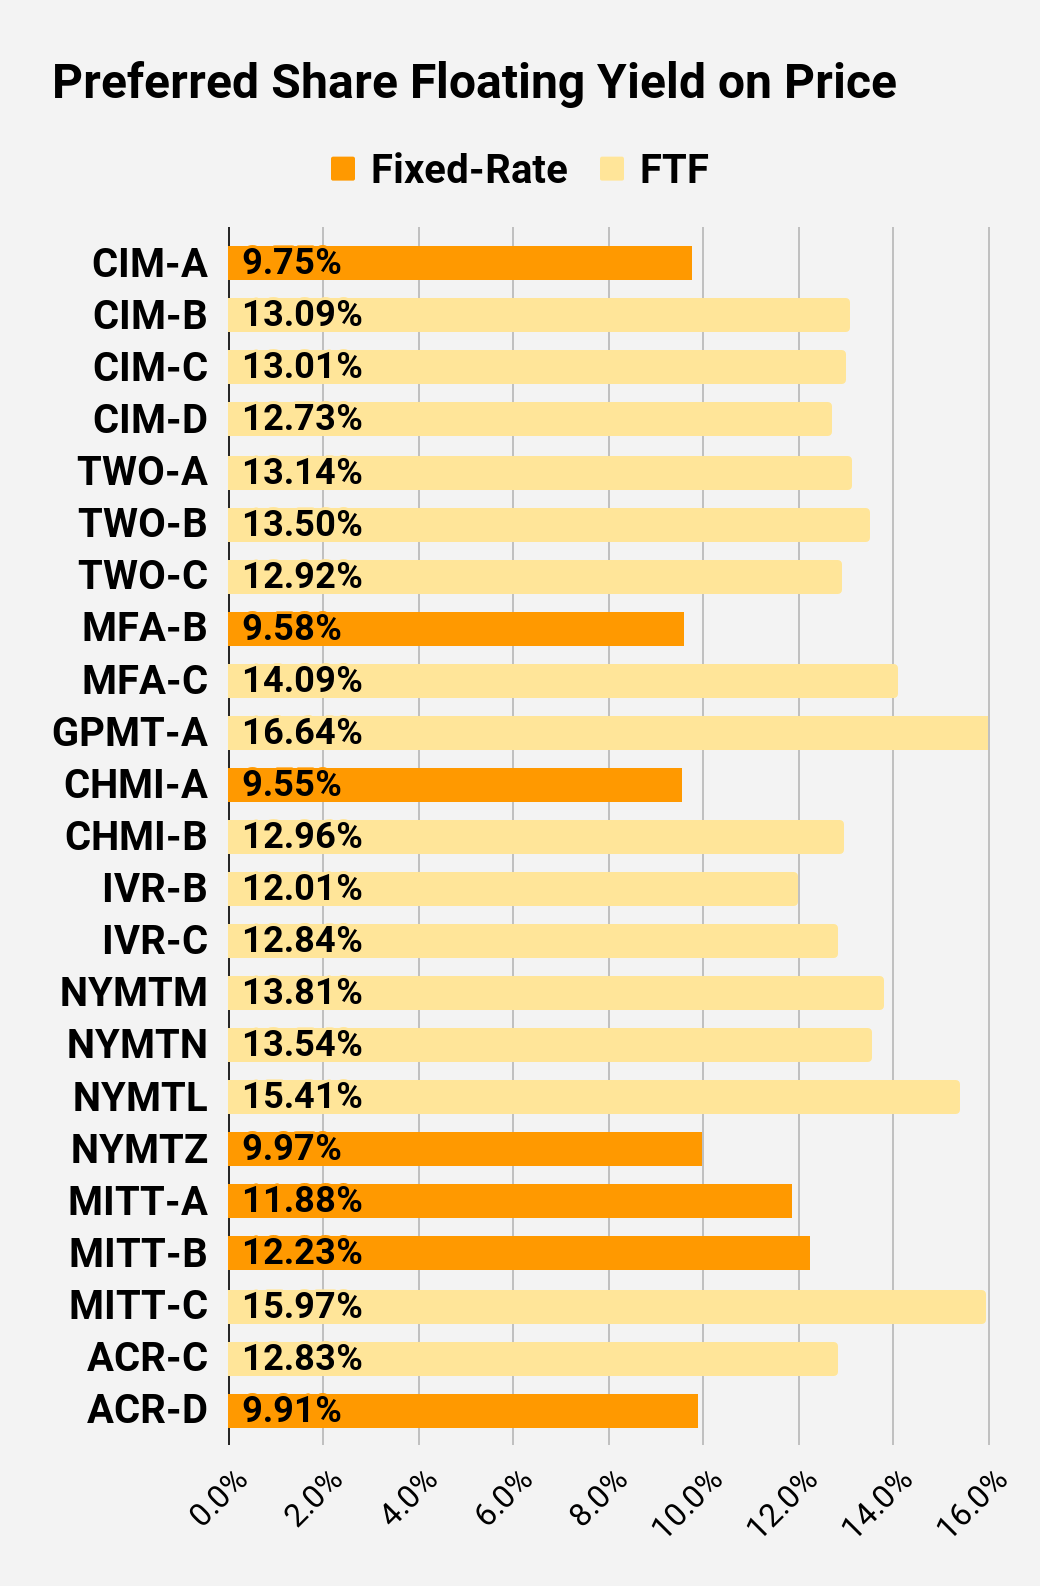
Preferred Share and Baby Bond Charts
I changed the coloring a bit. We needed to adjust to include that the first fixed-to-floating shares have transitioned over to floating rates. When a share is already floating, the stripped yield may be different from the “Floating Yield on Price” due to changes in interest rates. For instance, NLY-F already has a floating rate. However, the rate is only reset once per 3 months. The stripped yield is calculated using the upcoming projected dividend payment and the “Floating Yield on Price” is based on where the dividend would be if the rate reset today. In my opinion, for these shares the “Floating Yield on Price” is clearly the more important metric.
Preferred Share Data
Beyond the charts, we’re also providing our readers with access to several other metrics for the preferred shares.
After testing out a series on preferred shares, we decided to try merging it into the series on common shares. After all, we are still talking about positions in mortgage REITs. We don’t have any desire to cover preferred shares without cumulative dividends, so any preferred shares you see in our column will have cumulative dividends. You can verify that by using Quantum Online. We’ve included the links in the table below.
To better organize the table, we needed to abbreviate column names as follows:
- Price = Recent Share Price - Shown in Charts
- BoF = Bond or FTF (Fixed-to-Floating)
- S-Yield = Stripped Yield - Shown in Charts
- Coupon = Initial Fixed-Rate Coupon
- FYoP = Floating Yield on Price - Shown in Charts
- NCD = Next Call Date (the soonest shares could be called)
- Note: For all FTF issues, the floating rate would start on NCD.
- WCC = Worst Cash to Call (lowest net cash return possible from a call)
- QO Link = Link to Quantum Online Page
| Ticker |
| Price |
| BoF |
| S-Yield |
| Coupon |
| FYoP |
| NCD |
| WCC |
| QO Link |
| P-Link |
| $23.55 |
| Bond |
| 7.51% |
| 5.00% |
| 7.51% |
| 8/24/2023 |
| $1.53 |
| $25.12 |
| Bond |
| 8.10% |
| 8.00% |
| 8.10% |
| 8/1/2025 |
| $3.89 |
| $22.34 |
| Bond |
| 7.52% |
| 4.75% |
| 7.52% |
| 11/1/2023 |
| $2.96 |
| $25.30 |
| Bond |
| 10.01% |
| 7.00% |
| 10.01% |
| 8/15/2023 |
| $0.14 |
| $23.67 |
| Bond |
| 8.29% |
| 5.75% |
| 8.29% |
| 8/24/2023 |
| $1.42 |
| $23.54 |
| Bond |
| 8.67% |
| 6.20% |
| 8.67% |
| 8/24/2023 |
| $1.56 |
| $24.40 |
| Bond |
| 9.15% |
| 6.75% |
| 9.15% |
| 8/24/2023 |
| $0.91 |
| $23.57 |
| Bond |
| 8.38% |
| 6.00% |
| 8.38% |
| 8/24/2023 |
| $1.52 |
| Ticker |
| Price |
| BoF |
| S-Yield |
| Coupon |
| FYoP |
| NCD |
| WCC |
| QO Link |
| P-Link |
| $25.55 |
| Floating |
| 10.46% |
| 10.52% |
| 10.47% |
| 8/24/2023 |
| -$0.15 |
| $25.01 |
| Floating |
| 9.84% |
| 9.70% |
| 9.85% |
| 8/24/2023 |
| $0.36 |
| $23.48 |
| FTF |
| 7.27% |
| 6.75% |
| 11.33% |
| 6/30/2024 |
| $3.21 |
| $19.02 |
| 8.60% |
| 6.50% |
| 8.60% |
| 6/10/2026 |
| $10.64 |
| $22.71 |
| FTF |
| 7.64% |
| 6.90% |
| 12.18% |
| 4/15/2025 |
| $5.31 |
| $25.50 |
| Floating |
| 10.29% |
| 10.42% |
| 10.52% |
| 8/24/2023 |
| -$0.21 |
| $22.55 |
| FTF |
| 7.66% |
| 6.88% |
| 11.00% |
| 4/15/2024 |
| $3.75 |
| $23.02 |
| FTF |
| 7.10% |
| 6.50% |
| 11.50% |
| 10/15/2024 |
| $4.02 |
| $21.26 |
| FTF |
| 7.24% |
| 6.13% |
| 12.10% |
| 4/15/2025 |
| $6.43 |
| $22.23 |
| FTF |
| 8.77% |
| 7.75% |
| 9.71% |
| 10/15/2027 |
| $11.02 |
| $20.63 |
| 8.51% |
| 7.00% |
| 8.51% |
| 1/28/2025 |
| $7.01 |
| $19.64 |
| 9.61% |
| 7.50% |
| 9.61% |
| 8/24/2023 |
| $5.56 |
| $22.00 |
| FTF |
| 7.71% |
| 6.75% |
| 12.27% |
| 10/30/2024 |
| $5.12 |
| $19.65 |
| FTF |
| 8.00% |
| 6.25% |
| 11.75% |
| 1/30/2027 |
| $10.83 |
| $22.54 |
| FTF |
| 9.63% |
| 8.63% |
| 10.41% |
| 4/30/2028 |
| $12.72 |
| $23.50 |
| FTF |
| 8.87% |
| 8.25% |
| 12.04% |
| 3/30/2024 |
| $2.97 |
| $19.25 |
| 9.19% |
| 7.00% |
| 9.19% |
| 8/24/2023 |
| $5.95 |
| $22.64 |
| FTF |
| 8.30% |
| 7.50% |
| 12.55% |
| 8/15/2024 |
| $4.25 |
Second Batch:
| $22.30 |
| FTF |
| 8.01% |
| 7.13% |
| 12.56% |
| 08/15/2024 |
| $4.49 |
| $19.70 |
| FTF |
| 8.11% |
| 6.38% |
| 13.37% |
| 02/15/2025 |
| $7.71 |
| $21.01 |
| FTF |
| 8.35% |
| 7.00% |
| 12.43% |
| 11/15/2026 |
| $9.69 |
| $23.61 |
| FTF |
| 8.72% |
| 8.13% |
| 12.20% |
| 3/15/2024 |
| $2.92 |
| $23.16 |
| FTF |
| 8.75% |
| 8.00% |
| 12.61% |
| 6/15/2024 |
| $3.85 |
| $18.98 |
| 9.01% |
| 6.75% |
| 9.01% |
| 8/24/2026 |
| $11.41 |
| Ticker |
| Price |
| BoF |
| S-Yield |
| Coupon |
| FYoP |
| NCD |
| WCC |
| QO Link |
| P-Link |
| $20.72 |
| 9.75% |
| 8.00% |
| 9.75% |
| 8/24/2023 |
| $4.58 |
| $21.85 |
| FTF |
| 9.24% |
| 8.00% |
| 13.09% |
| 3/30/2024 |
| $4.65 |
| $19.96 |
| FTF |
| 9.81% |
| 7.75% |
| 13.01% |
| 9/30/2025 |
| $9.41 |
| $21.65 |
| FTF |
| 9.33% |
| 8.00% |
| 12.73% |
| 3/30/2024 |
| $4.85 |
| $21.38 |
| FTF |
| 9.54% |
| 8.13% |
| 13.14% |
| 4/27/2027 |
| $11.24 |
| $20.24 |
| FTF |
| 9.45% |
| 7.63% |
| 13.50% |
| 7/27/2027 |
| $12.38 |
| $20.49 |
| FTF |
| 8.88% |
| 7.25% |
| 12.92% |
| 1/27/2025 |
| $7.24 |
| $19.84 |
| 9.58% |
| 7.50% |
| 9.58% |
| 8/24/2023 |
| $5.44 |
| $19.55 |
| FTF |
| 8.41% |
| 6.50% |
| 14.09% |
| 3/31/2025 |
| $8.30 |
| $17.20 |
| FTF |
| 10.25% |
| 7.00% |
| 16.64% |
| 11/30/2026 |
| $13.70 |
| $21.61 |
| 9.55% |
| 8.20% |
| 9.55% |
| 8/24/2023 |
| $3.54 |
| $21.69 |
| FTF |
| 9.57% |
| 8.25% |
| 12.96% |
| 4/15/2024 |
| $4.78 |
| $22.59 |
| FTF |
| 8.69% |
| 7.75% |
| 12.01% |
| 12/27/2024 |
| $5.34 |
| $21.35 |
| FTF |
| 8.90% |
| 7.50% |
| 12.84% |
| 9/27/2027 |
| $11.65 |
| $21.80 |
| FTF |
| 9.09% |
| 7.88% |
| 13.81% |
| 1/15/2025 |
| $6.16 |
Strategy
Our goal is to maximize total returns . We achieve those most effectively by including “trading” strategies. We regularly trade positions in the mortgage REIT common shares and BDCs because:
- Prices are inefficient.
- Long-term, share prices generally revolve around book value.
- Short-term, price-to-book ratios can deviate materially.
- Book value isn’t the only step in analysis, but it is the cornerstone.
We also allocate to preferred shares and equity REITs. We encourage buy-and-hold investors to consider using more preferred shares and equity REITs.
Ratings: Bearish on AGNC
For further details see:
5 Double-Digit Dividend Previews Or Reviews