PEP - 5 Relatively Secure And Cheap Dividend Stocks To Invest In - December 2023
2023-12-02 09:00:00 ET
Summary
- This article is part of our monthly series where we highlight five large-cap, relatively safe, dividend-paying companies offering large discounts to their historical norms.
- We go over our filtering process to select just five conservative DGI stocks from more than 7,500 companies that are traded on U.S. exchanges, including OTC networks.
- In addition to the primary list that yields just over 3%, we present two other groups of five DGI stocks each, with the goal of moderate to high yields.
Author's Note: This is our monthly series on Dividend Stocks, usually published in the first week of every month. We scan the universe of roughly 7,500 stocks listed and traded on U.S. exchanges and use our proprietary filtering criteria to select five relatively safe stocks that may be trading cheaper compared to their historical valuations. Some of the sections in the article, like "Selection Process/Methodology," are repeated each month with few changes. This is intentional as well as unavoidable, as this is necessary for the new readers to be able to conceptualize the process. Regular readers of this series could skip such sections to avoid repetitiveness.
************
The bull market is mostly back (or maybe not). The market has its strange ways of doing the opposite of what most folks are thinking at the time. Right now, both the positive and negative news are helping boost the market. In spite of a real possibility of a recession in 2024 (though a shallow one possibly), Wall Street expects the bull rally to continue in 2024. Of course, the Feds have the ability to impact the direction of the market, and if they decide to increase rates further and meaningfully, it would certainly impact the markets. The second possibility is that a deeper recession than most folks expect can cause some damage. Nonetheless, the good thing is that in the long run, markets usually go up.
Also, we do not need to know where the market is going. We believe it is not possible to catch the exact bottom (or the peak), so it is best to invest regularly and consistently in good, solid dividend-paying stocks when their valuations are attractive. Against this backdrop, keeping some cash reserves and dry powder ready to deal with any scenario is important.
The main goal of this series of articles is to shortlist and highlight companies that have a solid history of paying and raising dividends. In addition, we demand that these companies support strong fundamentals, carry low debt, and are offered at a relatively cheaper valuation. These DGI stocks are not going to make anyone rich overnight, but if your goal is to attain financial freedom by owning stocks that would grow dividends over time, meaningfully and sustainably, then you are at the right place. These lists are not necessarily recommendations to buy but a shortlist of probable candidates for further research. The purpose is to keep our buy list handy and dry powder ready so we can use the opportunity when the time is right. Besides, every month, this analysis is able to highlight a few companies that otherwise would not be on our radar.
Every month, we start with roughly 7,500 stocks that are listed and traded on U.S. exchanges, including over-the-counter ((OTC)) networks. Using our filtering criteria, the initial list is quickly narrowed to roughly 700 stocks, mostly dividend-paying and dividend-growing. From thereon, by using various data elements, including dividend history, payout ratios, revenue growth, debt ratios, EPS growth, etc., we calculate a "Dividend Quality Score" for each stock that measures the relative safety and sustainability of the dividend. In addition to dividend safety, we also seek cheaper valuations. We also demand that the selected companies have an established business model, solid dividend history, manageable debt, and investment-grade credit rating.
This month, we highlight three groups with five stocks each that have an average dividend yield (as a group) of 3.72%, 5.25%, and 7.30%, respectively. The first list is for conservative and risk-averse investors, while the second is for investors seeking higher yields but still wanting relatively safe dividends. The third group is for yield-hungry investors but comes with an elevated risk, and we urge investors to exercise caution.
Notes: 1) Please note that when we use the term "safe" in relation to stocks and investments, it should be interpreted as "relatively safe" because nothing is absolutely safe in investing. Even though we present only 5 to 10 stocks in our final list, one should have 15-20 stocks at a minimum in a well-diversified portfolio.
2) All tables in this article are created by the author unless explicitly specified. The stock data have been sourced from various sources such as Seeking Alpha, Yahoo Finance, GuruFocus, and CCC-List (drip investing).
The Selection Process
Note: Regular readers of this series could skip this section to avoid repetitiveness. However, we include this section for new readers to provide the necessary background and perspective.
Goals:
We start with a fairly simple goal. We want to shortlist five large-cap companies that are relatively safe, dividend-paying, and trading at relatively cheaper valuations compared to the broader market. The objective is to highlight some of the dividend-paying and dividend-growing companies that may be offering juicy dividends due to a temporary decline in their share prices. The excess decline may be due to an industry-wide decline or one-time setbacks like negative news coverage or missing quarterly earnings expectations. We adopt a methodical approach to filter down the 7,500-plus companies into a small subset.
Our primary goal is income that should increase over time at a rate that at least beats inflation. Our secondary goal is to grow the capital and provide a cumulative growth rate of 9%-10% at a minimum. These goals are, by and large, in alignment with most retirees, income investors, and DGI investors. A balanced DGI portfolio should keep a mix of high-yield, low-growth stocks along with some high-growth but low-yield stocks. That said, how you mix the two will depend upon your personal situation, including income needs, time horizon, and risk tolerance.
A well-diversified portfolio would normally consist of more than just five stocks and preferably a few stocks from each sector of the economy. However, in this periodic series, we try to shortlist and highlight just five stocks that may fit the goals of most income and DGI investors. But at the same time, we try to ensure that such companies are trading at attractive or reasonable valuations. However, as always, we recommend you do your due diligence before making any decision on them.
Selection Criteria:
The S&P 500 currently yields less than 1.60%. Since our goal is to find companies for a dividend income portfolio, we should logically look for companies that pay yields that are at least similar to or better than the S&P 500. Of course, the higher, the better, but at the same time, we should not try to chase very high yields. If we try to filter for dividend stocks paying at least 1.50% or above, nearly 2,000 such companies are trading on U.S. exchanges, including OTC networks. We will limit our choices to companies that have a market cap of at least $10 billion and a daily trading volume of more than 100,000 shares. We also will check that dividend growth over the last five years is positive, but there can be some exceptions.
We also want stocks that are trading at relatively cheaper valuations. But at this stage, we want to keep our criteria broad enough to keep all the good candidates on the list. So, we will measure the distance from the 52-week high but save it to use at a later stage. Also, at this initial stage, we include all companies that yield 1% or higher. In addition, we also include other lower-yielding but high-quality companies at this stage.
Criteria to Shortlist:
- Market cap > $10 billion ($8 billion in a down market)
- Dividend yield > 1.0% (some exceptions are made to include high quality but lower yielding companies)
- Daily average volume > 100,000
- Dividend growth past five years >= 0.
By applying the above criteria, we got around 600 companies.
Narrowing Down the List
As a first step, we would like to eliminate stocks that have less than five years of dividend growth history. We cross-check our current list of over 600 stocks against the list of so-called Dividend Champions, Contenders, and Challengers originally defined and created by David Fish. Generally, the stocks with more than 25 years of dividend increases are called dividend Champions, while stocks with more than ten but less than 25 years of dividend increases are termed Contenders. Further, stocks with more than five but less than ten years of dividend increases are called Challengers. Also, since we want a lot of flexibility and wider choice at this initial stage, we include some companies that pay dividends lower than 1.50% but otherwise have a stellar dividend record and growing dividends at a fast pace.
After we apply all the above criteria, we're left with 329 companies on our list. However, so far in this list, we have demanded five or more years of consistent dividend growth. But what if a company had a very stable record of dividend payments but did not increase the dividends from one year to another? At times, some of these companies are foreign-based companies, and due to currency fluctuations, their dividends may appear to have been cut in US dollars, but in reality, that may not be true at all when looked at in the actual currency of reporting. At times, we may provide some exceptions when a company may have cut the dividend in the past, but otherwise, it looks compelling. So, by relaxing some of the conditions, a total of 75 additional companies were considered to be on our list. We call them category 'B' companies. After including them, we had a total of 404 (329 + 75) companies that made our first list.
We then imported the various data elements from many sources, including CCC-list, GuruFocus, Fidelity, Morningstar, and Seeking Alpha, among others, and assigned weights based on different criteria as listed below:
- Current yield: Indicates the yield based on the current price.
- Dividend growth history (number of years of dividend growth): This provides information on how many years a company has paid and increased dividends on a consistent basis. For stocks under the category 'B' (defined above), we consider the total number of consecutive years of dividends paid rather than the number of years of dividend growth.
- Payout ratio: This indicates how comfortably the company can pay the dividend from its earnings. We prefer this ratio to be as low as possible, which would indicate the company's ability to grow the dividend in the future. This ratio is calculated by dividing the dividend amount per share by the EPS (earnings per share). The cash-flow payout ratio is calculated by dividing the dividend amount paid per share by the cash flow generated per share.
- Past five-year and 10-year dividend growth: Even though it's the dividend growth rate from the past, this does indicate how fast the company has been able to grow its earnings and dividends in the recent past. The recent past is the best indicator that we have to know what to expect in the next few years.
- EPS growth (average of previous five years of growth and expected next five years' growth): As the earnings of a company grow, more than likely, dividends will grow accordingly. We will take into account the previous five years' actual EPS growth and the estimated EPS growth for the next five years. We will add the two numbers and assign weights.
- Chowder number: So, what's the Chowder number? This number has been named after well-known SA author Chowder, who first coined and popularized this factor. This number is derived by adding the current yield and the past five years' dividend growth rate. A Chowder number of "12" or more ("8" for utilities) is considered good.
- Debt/equity ratio: This ratio will tell us about the debt load of the company in relation to its equity. We all know that too much debt can lead to major problems, even for well-known companies. The lower this ratio, the better it is. Sometimes, we find this ratio to be negative or unavailable, even for well-known companies. This can happen for a myriad of reasons and is not always a reason for concern. This is why we use this ratio in combination with the debt/asset ratio (covered next).
- Debt/asset ratio: This ratio will tell us about the debt load in relation to the company's total assets. In almost all cases, this ratio would be lower than the debt/equity ratio. Also, this ratio is important because, for some companies, the debt/equity ratio is not a reliable indicator.
- S&P's credit rating: This is the credit rating assigned by the rating agency S&P Global and is indicative of the company's ability to service its debt. This rating can be obtained from the S&P website.
- PEG ratio: This is also called the price/earnings-to-growth ratio. The PEG ratio is considered to be an indicator if the stock is overvalued, undervalued, or fairly priced. A lower PEG may indicate that a stock is undervalued. However, PEG for a company may differ significantly from one reported source to another, depending on which growth estimate is used in the calculation. Some use past growth, while others may use future expected growth. We're taking the PEG from the CCC list wherever available. The CCC list defines it as the price/earnings ratio divided by the five-year estimated growth rate.
- Distance from 52-week high: We want to select companies that are good, solid companies but also are trading at cheaper valuations currently. They may be cheaper due to some temporary down cycle or some combination of bad news or simply having a bad quarter. This criterion will help bring such companies (with a cheaper valuation) near the top as long as they excel in other criteria as well. This factor is calculated as (current price - 52-week high) / 52-week high.
- Sales or Revenue growth: This is the average growth rate in annual sales or revenue of the company over the last five years. A company can only grow its earnings power as long as it can grow its revenue. Sure, it can grow the earnings by cutting costs, but that can't go on forever.
Downloadable Dataset:
Below, we provide a link to the table with relevant data on 399 stocks. Readers can download this table for further analysis. Please note that the table is sorted on the "Total Weight" or the "Initial Quality Score."
File-for-export_-_5_Safe_and_Cheap_DGI_Stocks_-_DEC_2023.xlsx .
Selection Of The Top 50
We will first bring down the list to roughly 50 names by automated criteria, as listed below. In the second step, which is mostly manual and subjective, we will bring the list down to about 15.
- Step 1: First, take the top 20 names from the above table (based on total weight or quality score). At times, some industry segments tend to get overcrowded at the top, so we take the top two and ignore the rest.
- Step 2: As a second step, we will take the top 10 names based on the highest dividend yield. When it comes to dividend yield, some of the industry segments tend to be overcrowded. So, we will take the top two (or a maximum of three) names from any single industry segment. We take the top 10 stocks after the sort to the final list.
- Step 3: Now, we will sort our list based on five-year dividend growth (highest at the top) and select the top 10 names.
- Step 4: We also want to give priority to stocks that are rated highest in terms of credit rating. So, we will sort the list based on the numerical weight of the credit rating and select the top 10 stocks with the best credit rating. Again, we are careful not to have too many names from the same sector.
- Step 5: Lastly, as the name of the series suggests, we want to have some names that may be trading cheaper in comparison to their historical valuation. So, we select the top ten names with the highest discount. However, they could be trading cheap for just the wrong reasons, so we need to be careful that they meet our other quality criteria.
From the above steps, we now have a total of 60 names in our final consideration. However, the following stocks appeared more than once:
Stocks that appeared two times:
ADP, BMY, CI, MSFT, V, WBA (6 duplicates).
After removing six duplicates, we are left with 54 (60-6) names.
Since there are multiple names in each industry segment, we will keep a maximum of two or three names (from the top) from any one segment. The top names from each sector/industry segment are presented:
Financial Services, Banking, and Insurance:
Banks- Regional: ( MTB ), ( CFG )
Banks- Major: ( JPM ), ( BNS )
Financial Services - Others: ( MS ), ( ARCC )
Insurance: ( CINF )
Business Services/ Consulting:
Conglomerates:
Industrials:
Transportation/ Logistics:
(ODFL)
Chemicals:
Materials/Mining/Gold:
Materials: ( ALB )
Mining (other than Gold):
Gold:
Defense:
None
Consumer/Retail/Others:
Cons-Staples: ( HSY ), ( PEP ), ( PG )
Cons-discretionary: ( GPC )
Cons-Retail: ( TGT ), ( TSCO ), ( DG )
Communications/Media
( VZ )
Healthcare:
Pharma: ( BMY ), ( JNJ ), ( MRK ), ( PFE )
Healthcare Ins: ( UNH ), ( CI )
Technology:
Energy:
Pipelines/ Midstream: ( ENB ), ( MPLX )
Oil & Gas (prod. & exploration): ( EOG ), ( FANG )
Energy Majors: ( CVX )
Utilities:
Housing/ Construction:
( LEN )
REIT:
Final Step: Narrowing Down To Just Five Companies
In this step, we construct three separate lists of five stocks each, with different sets of goals, dividend income, and risk levels.
The lists are:
1) Relatively Safe (Low-yield) Dividend list,
2) Moderately High Dividend List,
3) Ultra High Dividend List, and
4) A combined list of the above three (duplicates removed).
Out of the top 50, we make our judgment calls to make these three lists, so basically, the selections are based on our research and perceptions. So, while most of the filtering until now was based on automated criteria, the last step is pretty much subjective. We try to make each of the three lists highly diversified among various sectors and industry segments and try to ensure that the safety of dividends matches the overall risk profile of the group. We certainly encourage readers to do further research on the highlighted names.
Nonetheless, here are our three final lists for this month:
Final A-List (Relatively Safe Income):
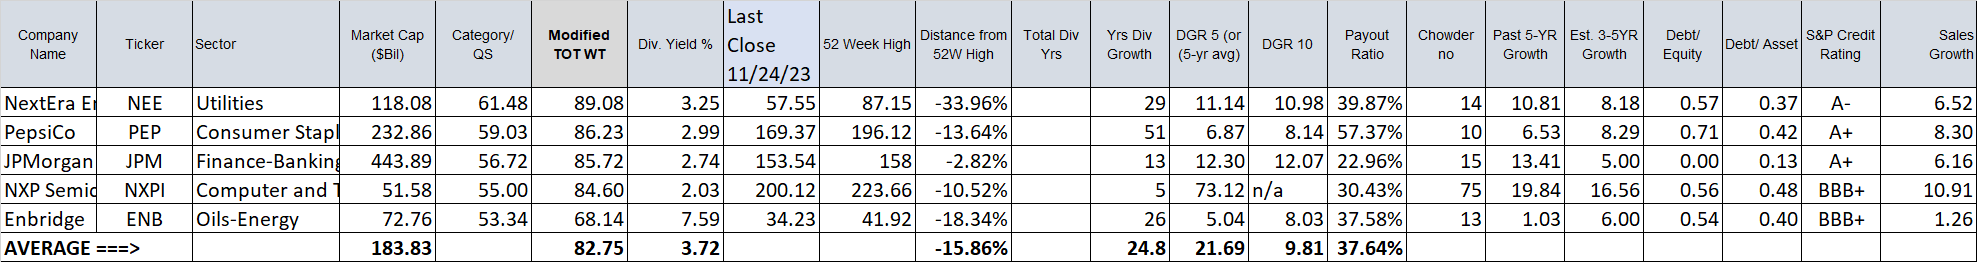
Average yield: 3.72%
Table-1A: A-LIST (Conservative Income)
We think this set of five companies (in the A-List) would form a solid diversified group of dividend companies that would be appealing to income-seeking and conservative investors, including retirees and near-retirees. The average yield is 3.72%, which is a lot more than that of the S&P500. The average dividend growth history is nearly 25 years, and the average discount from a 52-week high is very attractive for these stocks at -16%. Also, all five companies have investment grade ratings, and three of them have an excellent credit rating of A- or higher. If you must need higher dividends, consider B-List or C-List, presented later.
NEE (NextEra Energy):
NEE is one of the best companies in the Utility sector, and its energy business is a leader in clean and renewable energy. Most importantly, company shares are trading relatively cheap right now, as they are down 35% from 52-week highs. This has happened mostly because of the rising interest rates environment and the market's realization that rates are going to stay higher and longer. However, we feel, as often happens, the market has reacted irrationally. The growth prospects of NEE will be tepid for a couple of years due to the current environment, but long-term prospects remain the same as they were before the price drop. At current prices, we feel it is an attractive and relatively safe investment.
PEP: (PepsiCo)
PepsiCo is an iconic American company that operates around the globe. It owns well-known household brands, including Pepsi, Mountain Dew, Gatorade, Lay's, Cheetos, and Doritos, among others. The company is the second largest beverage company behind Coca-Cola, and beverages account for nearly 45% of its revenues. The rest of the revenue is generated by Snacks and Convenience foods. The company generates nearly 40% of total sales and nearly a third of its profits outside the US.
Besides, PepsiCo recently became a Dividend-King, meaning it has increased the dividends consistently for the last 50 years. For dividend investors, it is quite a milestone. PepsiCo is a must in every DGI portfolio; however, it should be added at the right price. Right now, it is trading nearly 13% below its 52-week high. Currently, it is also yielding 3%, which is 10% higher than its 5-year average. Sure, if the broader market goes down further, PEP will go down as well. So, it should be added in multiple lots.
NXPI (NXP Semiconductors):
NXP Semiconductors manufactures and markets processing chips, analog, and other mixed-signal products to automotive, industrial, and mobile communication markets. The firm is headquartered in Europe and was formed in 2006 in its current form. It acquired Freescale Semiconductors in 2015 and now has a significant market share in the automotive market, where it supplies analog chips and microcontrollers into automotive clusters, powertrains, infotainment systems, and radar systems. The company also serves the Internet of Things, mobile, and communications infrastructure markets. The automotive OEM market accounts for more than half of NXP's total sales revenue and has provided significant growth over the past few years due to the increasing popularity and adoption of EVs and autonomous driving. Even a traditional ICE-based car may have more than $500 worth of semiconductor chips. The hype around EVs may have slowed a little bit, but the growth is likely to continue due to government subsidies as well as its potential to clean up pollution within population centers around the globe in the short term and the overall positive impacts on the environment in the long term.
ENB (Enbridge):
Enbridge is a midstream energy company based in Canada and serves markets both in Canada and the United States. They operate one of the longest and complex liquids transportation networks, with over 17,000 miles of pipelines. Enbridge's natural gas pipelines connect supplies to major North American population centers and LNG export facilities. Another subsidiary of Enbridge, Enbridge Gas, is one of the largest natural gas utilities in North America (after their September 2023 acquisition announcement of three U.S. utilities, expected to close in 2024). However, more important is that shares are trading at a large discount to their fair value and nearly 25% below 52-week highs. The current dividend yield, at 8.4%, is highly attractive and fully covered by DCF (distributable cash flow). The company has paid and grown the dividend at a very respectable pace for 26 years. Per their latest quarterly results (Nov 3, 2023), the company had a pretty strong quarter. The adjusted EPS was 62 cents compared to the consensus of 57 cents. The company also maintained its previous guidance of distributable cash flow of $5.25 to $5.65 per share. The market and the rating agencies were concerned about the company maintaining its debt to EBITDA under 4.9x due to the funding impacts from the ongoing acquisition of Gas utilities. However, per the quarterly results, the debt to EBITDA ratio came in at 4.5x, at the lower end of their guidance. More importantly, it would have been much lower at 4.1x if you were to exclude the equity issued by the company to pre-fund the pending acquisition. All this bodes well for the investors in terms of the company's ability to continue growing its dividend for the foreseeable future, albeit at a slower pace.
Final B-List (High Yield, Moderately Safe):
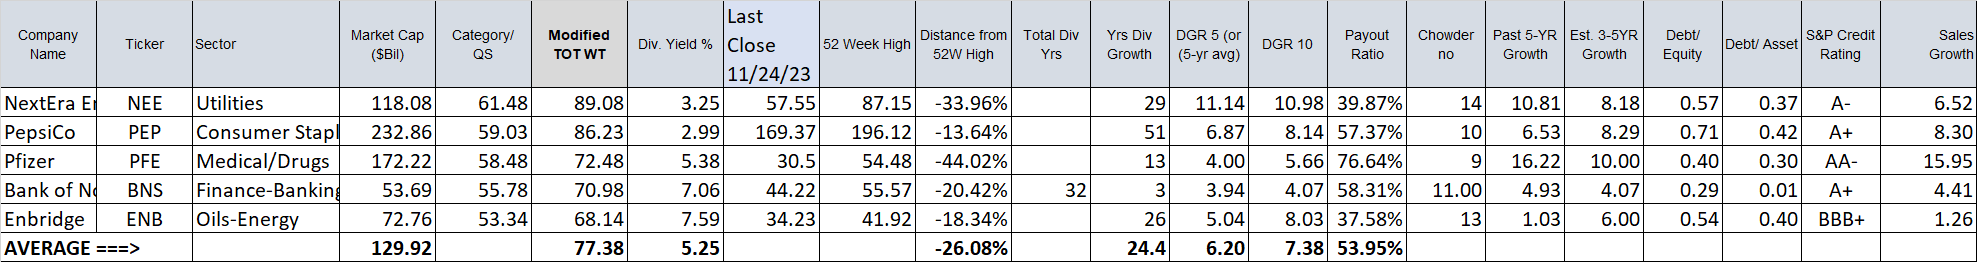
Average yield: 5.25%
Note 1: Very often, we include a few low-risk stocks in the B-list and C-list. Also, oftentimes, a stock can appear in multiple lists. This is done on purpose. We try to make each of our lists fairly diversified among different sectors/industry segments of the economy. We try to include a few of the highly conservative names in the high-yield list to make the overall group much safer.
Table-1B: B-LIST (High Yield)
In the B-List, the overall risk profile of the group becomes slightly elevated compared to the A-List. That said, the group (as a whole) will likely provide safe dividends for many years. This list offers an average yield for the group of nearly 5.25%, an average of 30 years of dividend history, and an average discount of -26 % (from 52-week highs).
PFE (Pfizer):
We have included Pfizer in our lists in the recent past, and we include it in all of our B-List and C-List this month. Here are some reasons for this selection. The most important factors are a relatively cheaper valuation and its high dividend yield of 5.4% for a major pharma company. Share prices have declined nearly 45% in 2023 and offer a great entry point. In fact, the stock price has seen a lot of weakness in 2023 due to the Covid reset and the expected decline in Covid-related revenue going forward. Most of the Covid vaccine mandates are over now, and people are less inclined to get those vaccines. However, Pfizer got an additional revenue of $55 billion from Covid-related vaccines and anti-virals. This boosted its cash position to $31 Billion, which the company is using to complete several M&A deals. In its future plans, the company has committed to much higher R&D spending. Back in March this year, Pfizer also announced that it would acquire the biotech company Seagen Inc. (SGEN) for $43 billion. The deal appears to be expensive, but the management sees long-term value addition. With all these acquisitions and in-house R&D, Pfizer appears to have a healthy pipeline of drugs for the conceivable future. The valuation is quite cheap at this time. Investors should not expect very high growth from Pfizer but a high and stable dividend from a large pharma company.
Final C-LIST (Yield-Hungry, Less Safe):
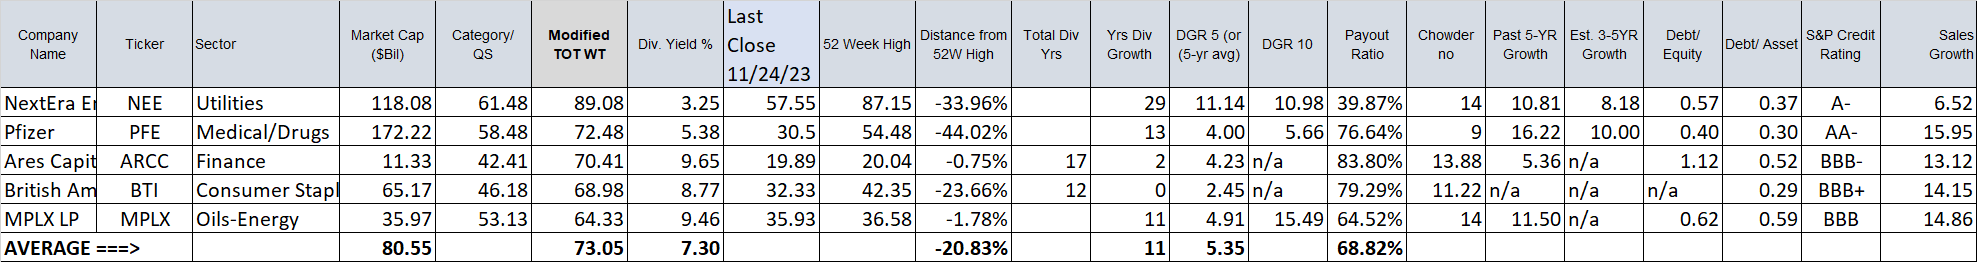
Average yield: 7.30%
Notes:
Note 1: Oftentimes, a stock can appear in multiple lists. We try to include one or two conservative names in the high-yield list to make the overall group much safer.
Table-1C: C-LIST (Yield-Hungry, Elevated Risk)
NOTE: MPLX is structured as a partnership (not a corporation) and issues a K-1 tax form instead of usual 1099-Div. Please use due diligence.
ARCC (Ares Capital):
Ares Capital is one of the largest BDCs (Business Development Companies) in terms of market capitalization and net asset values. ARCC offers a very high yield of over 10%. Being a BDC, it invests in small and medium-sized companies, some of which may be distressed. ARCC has investments in nearly 475 companies, making it a very diversified portfolio. It has a record of generating a high NII (net Investment income), which currently exceeds $1 billion on an annual basis. Its payout ratio is roughly 83%, which is reasonable for a BDC, and is measured by Core-EPS (which excludes realized and unrealized gains). With a nearly 10% dividend yield, there is not much scope left for capital appreciation, but we have to remember that this is an investment for income. This is also the reason it is placed only in the C-list. That said, if someone reinvests all of the dividends, the total returns may still be attractive.
BTI (British American Tobacco)
Some investors may not like Tobacco stocks, and that is understandable. But if you are fine with investing in Tobacco stocks, it can't get better than this. The current yield is quite high at 8.8% (not as much as last month, though). Moreover, the company has excelled in growing the new categories of products. However, this is purely an income investment, and we should not expect much growth, but the dividend appears to be reasonably safe. Please note that we would recommend adding to this position in multiple lots as the stock price has been in decline, and it is quite possible for the stock to become even cheaper than current levels.
===
Apparently, this list (C-List) is for yield-hungry DGI investors. The yield goes up as much as 7.30%. However, this list is not for conservative investors. As you can see, the average credit rating of this set of companies is much lower than the A-List or even B-List. Dividends are moderately safe in this list, but the yields are very attractive. Many companies in this list come with an elevated level of risk. We urge due diligence to determine if it would suit your personal situation. Nothing comes for free, so there will be more risk involved with this group. That said, it's a highly diversified group spread among five different sectors.
We would like to caution that each company comes with certain risks and concerns. Sometimes, these risks are real, but other times, they may be a bit overblown and temporary. So, it's always recommended to do further research and due diligence.
What If We Were to Combine the Three Lists?
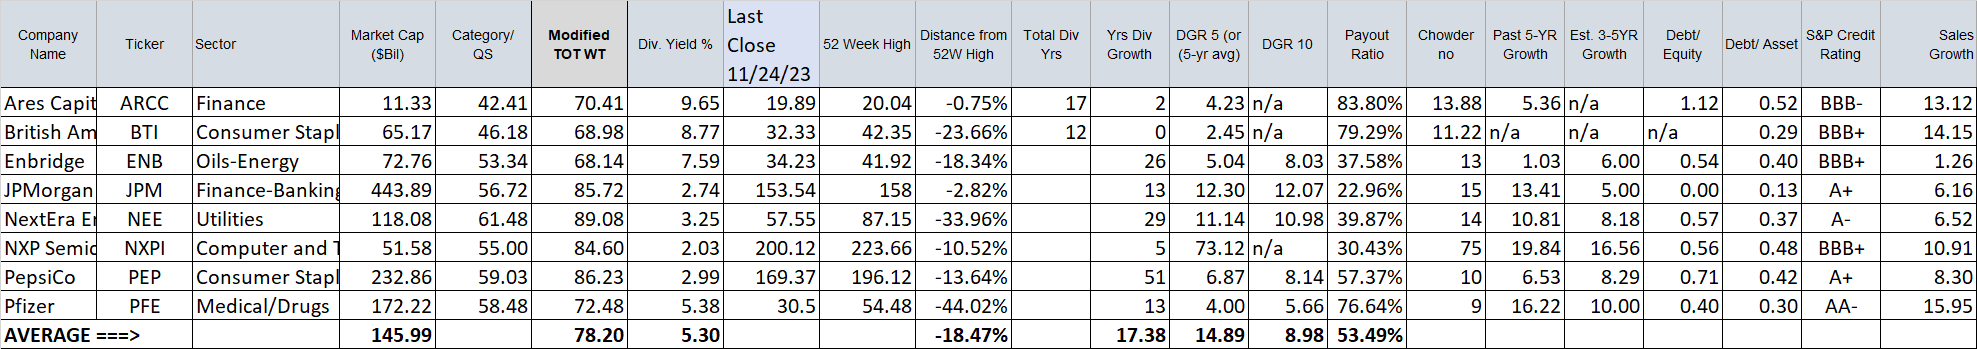
If we were to combine the three lists and thereafter remove the duplicates (because of combining), we would be left with ten names.
Duplicates: ENB (2 times), NEE (3 times), PEP (2 times), PFE (2 times).
Also, we have two names from the Banking segment (JPM and BNS), so we removed BNS. Also, from the energy sector, we removed MPLX and kept ENB in this combined list. Finally, we are left with eight names.
The combined list is highly diversified in as many as nine industry segments. The stats for the group of 9 are as follows:
Average yield: 5.30%
Average discount (from 52WK High): -18.47%
Average 5-yr dividend growth: 14.9%
Average 10-yr dividend growth: 8.98% (five names)
Average Payout Ratio: 53.5%
Average Total Quality Score: 78.08
Table 2:
Conclusion
In the first week of every month, we start with a fairly large list of dividend-paying stocks and filter our way down to just a handful of stocks that meet our selection criteria and income goals. In this article, we have presented three groups of stocks (five each) with different goals in mind to suit the varying needs of a wider audience. Even though the risk profile of each group is different, each group in itself is fairly balanced and diversified.
The first group of five stocks is for conservative investors who prioritize the preservation of their capital above everything else. Obviously, in return, they are willing to settle with a relatively low yield. The second group reaches for a higher yield but with only a slightly higher risk. However, the C-group comes with an elevated risk and is certainly not suited for everyone.
This month, the first group yields 3.72%, while the second group elevates the yield to 5.25%. We also presented a C-list for yield-hungry investors with an 7.30% yield. The combined group (all three lists combined with duplication removed) offers an even more diversified group with nine positions and a 5.70% yield.
For further details see:
5 Relatively Secure And Cheap Dividend Stocks To Invest In - December 2023