CALM - 69 Ben Graham September Value Stocks: 55 Ridiculous Buys
2023-08-28 07:52:01 ET
Summary
- “Value ranking looks at the price of a stock relative to intrinsic firm value. Graham Value Stocks match the criteria Benjamin Graham followed." —YCharts Value Screener.
- 69 August Value large caps and Graham formula-derived results reflect established value stock detection criteria. Of those, 55 met the dogcatcher ridiculous ideal of dividends from $1K invested exceeding single share stock prices.
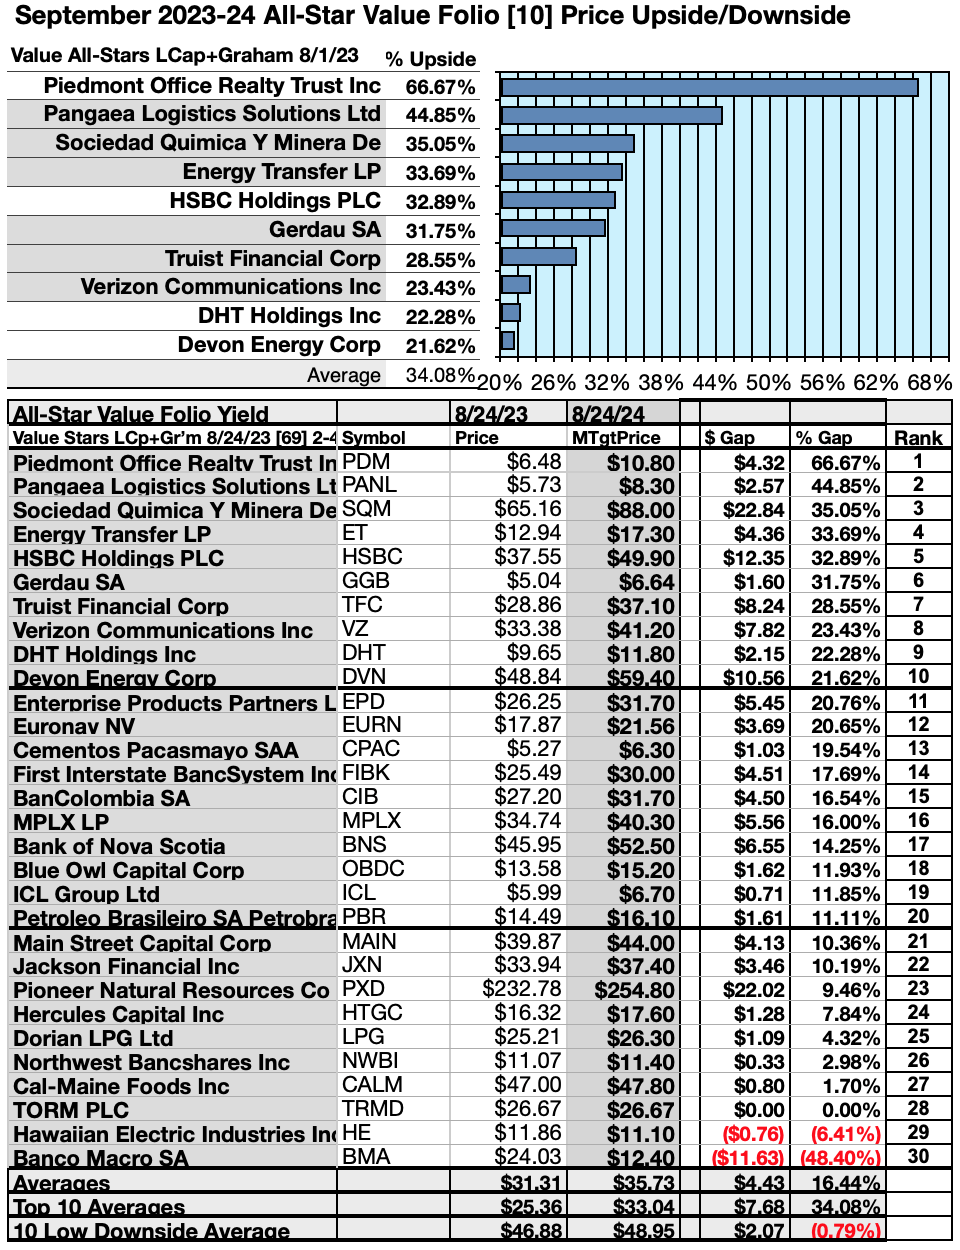
- Representing nine of eleven Morningstar Sectors, all 55 ideal value picks pay regular dividends. Broker target top ten net gains ranged 31.64%-73.39%, topped by PDM & PANL, as of 8/24/23.
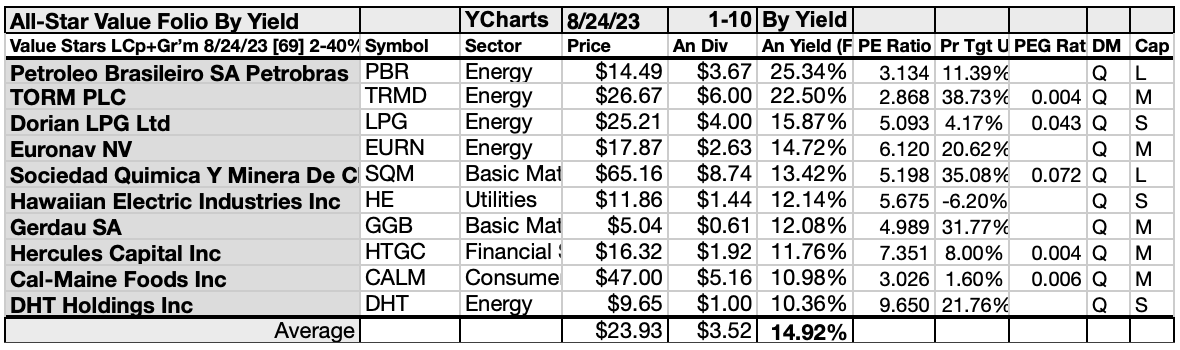
- By yield, PBR leads the top-ten All-Star-Value field of DHT, CALM, HTGC, GGB, HE, SQM, EURN, LPG, TRMD & PBR. The ten averaged 14.92% yield. All-Star-Value top-ten, by broker target price upsides, were DVN, DHT, VZ, TFC, GGB, HSBC, ET, SQM, PANL & PDM averaging 34.08%.
- $5k invested August 24 in the five top-yield, lowest-priced, All-Star Value stocks projected 0.36% less net-gain than from $5k invested all top ten. Big (higher-priced) equities recovered the lead of the top-ten September All-Star Value-derived dividend dogs by over one-third of a length, per analyst estimates.
Foreword
About Large Cap Value
A Value ranking for large cap stocks from YCharts puts together complementary strategies found during their stock research. As a value ranking, it looks at the price of a stock relative to a number of measurements that determine intrinsic firm value. Only the largest 10% of companies based on market cap are allowed in this portfolio.
What it is: The Value Score is a composite score. It tells you how much you are getting in terms of profits, cash flows, assets, sales, etc. for the stock price that you pay. It is a relative measurement, so it says nothing about the overall level of the market. Rather, it answers the question: "Given the current market level, which stocks give you the most current value for your dollar of investment?" Tens are the most value, and 1s are the least.
How to use it: Use it to find companies that are selling at a low price relative to their assets and profits.
Limitations of the Value Score: Watch out for companies with a lot of uncertainty or bad prospects for the future (e.g. Pharma companies with expiring patents, industries on the decline, etc.).
About the Ben Graham Formula
The Ben Graham Formula strategy contains ultra-stable stocks that will infrequently lose money if held over a long period of time. It was developed based on a screen in Graham's book, "The Intelligent Investor." For those who have the book, it is the "Defensive Investor" screen. It selects stocks that are large in terms of sales and total assets, have a strong track record of earnings and dividend payments, have a reasonable current ratio and level of long term debt, and have a low valuation given by PE Ratios and Price to Book Value ratios.
-YCharts
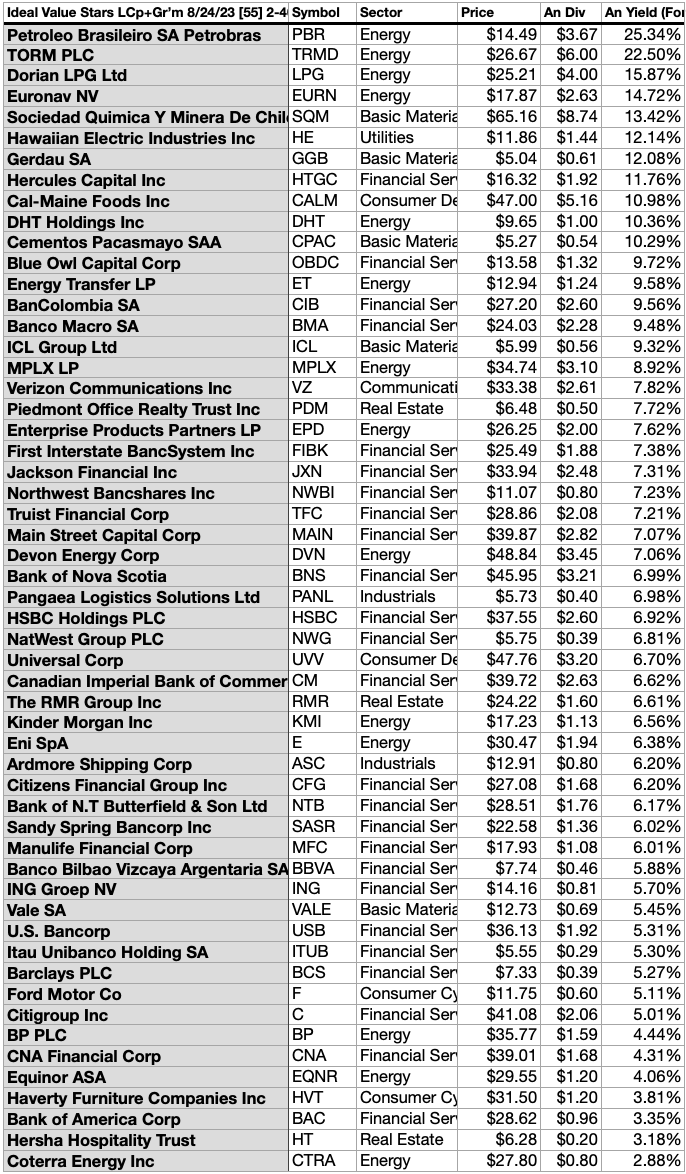
While 14 out of this collection of 69 All-Star-Value Dividend stocks are too pricey to justify their skinny dividends, the remaining 55 of them, by yield, live up to the ideal of offering annual dividends (from a $1K investment) exceeding their price per share.
55 Ideal Value Dogs for September
In the current market, the dividends from $1k investments in 55 of the 69 stocks listed above, met or exceeded their single share prices as of 8/24/23.
As we are now over one-third past the third anniversary of the 2020 Ides of March dip, the time to snap up some the 59 top-yield All-Star-Value dogs is now... unless another big bearish drop in price looms ahead. (At which time, your strategy would be to add to your position in any of these you then hold.)
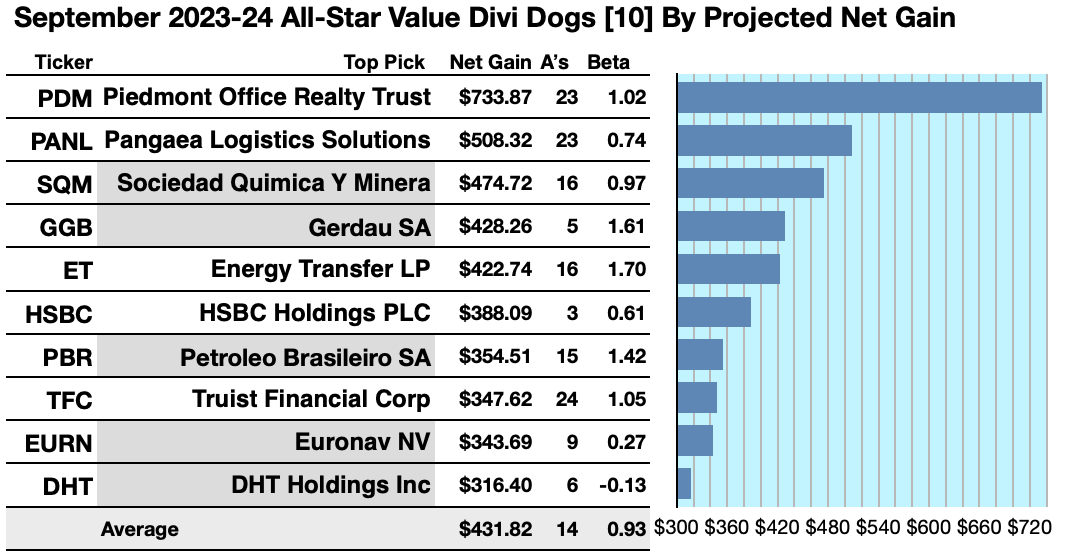
Actionable Conclusions (1-10): Analysts Estimate 27.38% To 55.94% Top Ten All-Star-Value Net Gains To September 2024
Five of the ten top-picks by yield were verified as also being among the top ten gainers for the coming year based on analyst 1-year target prices. (They are tinted gray in the chart below). Thus, this yield-based forecast for All-Star-Value derived dividend dogs (as graded by Brokers) was 50% accurate.
Estimated dividend-returns from $1000 invested in each of the highest-yielding stocks and their aggregate one-year analyst median target-prices, as reported by YCharts, created these 2023-24 data-points. (Note: target prices by lone-analysts were not used.) Ten probable profit-generating trades projected to August 24, 2024 were:
Piedmont Office Realty Trust ( PDM ) was projected to net $733.87, based on the median of target price estimates from 23 analysts, plus dividends, less broker fees. The Beta number showed this estimate subject to risk/volatility 2% greater than the market as a whole.
Pangaea Logistics Solutions ( PANL ) was projected to net $508.32, based on the median of target price estimates from 2 analysts, plus dividends, less broker fees. The Beta number showed this estimate subject to risk/volatility 36% under the market as a whole.
Sociedad Quimica Y Minera de Chile S.A. ( SQM ) was projected to net $474.72, based on the median of target price estimates from 16 analysts, plus the estimated annual dividend, less broker fees. The Beta number showed this estimate subject to risk/volatility 3% less than the market as a whole.
Gerdau S.A. ( GGB ) was projected to net $428.26, based on dividends, plus the median of target price estimates from 5 analysts, less broker fees. The Beta number showed this estimate subject to risk/volatility 61% greater than the market as a whole.
Energy Transfer LP ( ET ) was projected to net $422.74, based on dividends, plus the median of target price estimates from 16 analysts, less broker fees. The Beta number showed this estimate subject to risk/volatility 70% greater than the market as a whole.
HSBC Holdings plc ( HSBC ) was projected to net $388.09 based on dividends, plus the median of target price estimates from 3 analysts, less broker fees. The Beta number showed this estimate subject to risk/volatility 39% less than the market as a whole.
Petroleo Brasileiro S.A. - Petrobras ( PBR ) was projected to net $354.51, based on dividends, plus the median of target price estimates from 15 analysts, less broker fees. The Beta number showed this estimate subject to risk/volatility 42% greater than the market as a whole.
Truist Financial Corp. ( TFC ) was projected to net $347.62, based on a median of target estimates from 24 analysts, plus dividends, less broker fees. The Beta number showed this estimate subject to risk/volatility 5% greater than the market as a whole.
Euronav NV ( EURN ) netted $343.69 based on a median target price estimate from 9 analysts, plus dividends, less broker fees. The Beta number showed this estimate subject to risk/volatility 73% less than the market as a whole.
DHT Holdings ( DHT ) was projected to net $316.40, based on dividends, plus the median of target price estimates from 6 analysts, less broker fees. The Beta number showed this estimate subject to risk/volatility .13% opposite the market as a whole.
The average net-gain in dividend and price was estimated to be 43.18% on $10k invested as $1k in each of these ten stocks. The average Beta showed these estimates subject to risk/volatility 7% less than the market as a whole.
Source: Open source dog art from dividenddogcatcher.com
The Dividend Dogs Rule
Stocks earned the "dog" moniker by exhibiting three traits: (1) paying reliable, repeating dividends, (2) their prices fell to where (3) yield (dividend/price) grew higher than their peers. Thus, the highest yielding stocks in any collection became known as "dogs." More precisely, these are, in fact, best called, "underdogs".
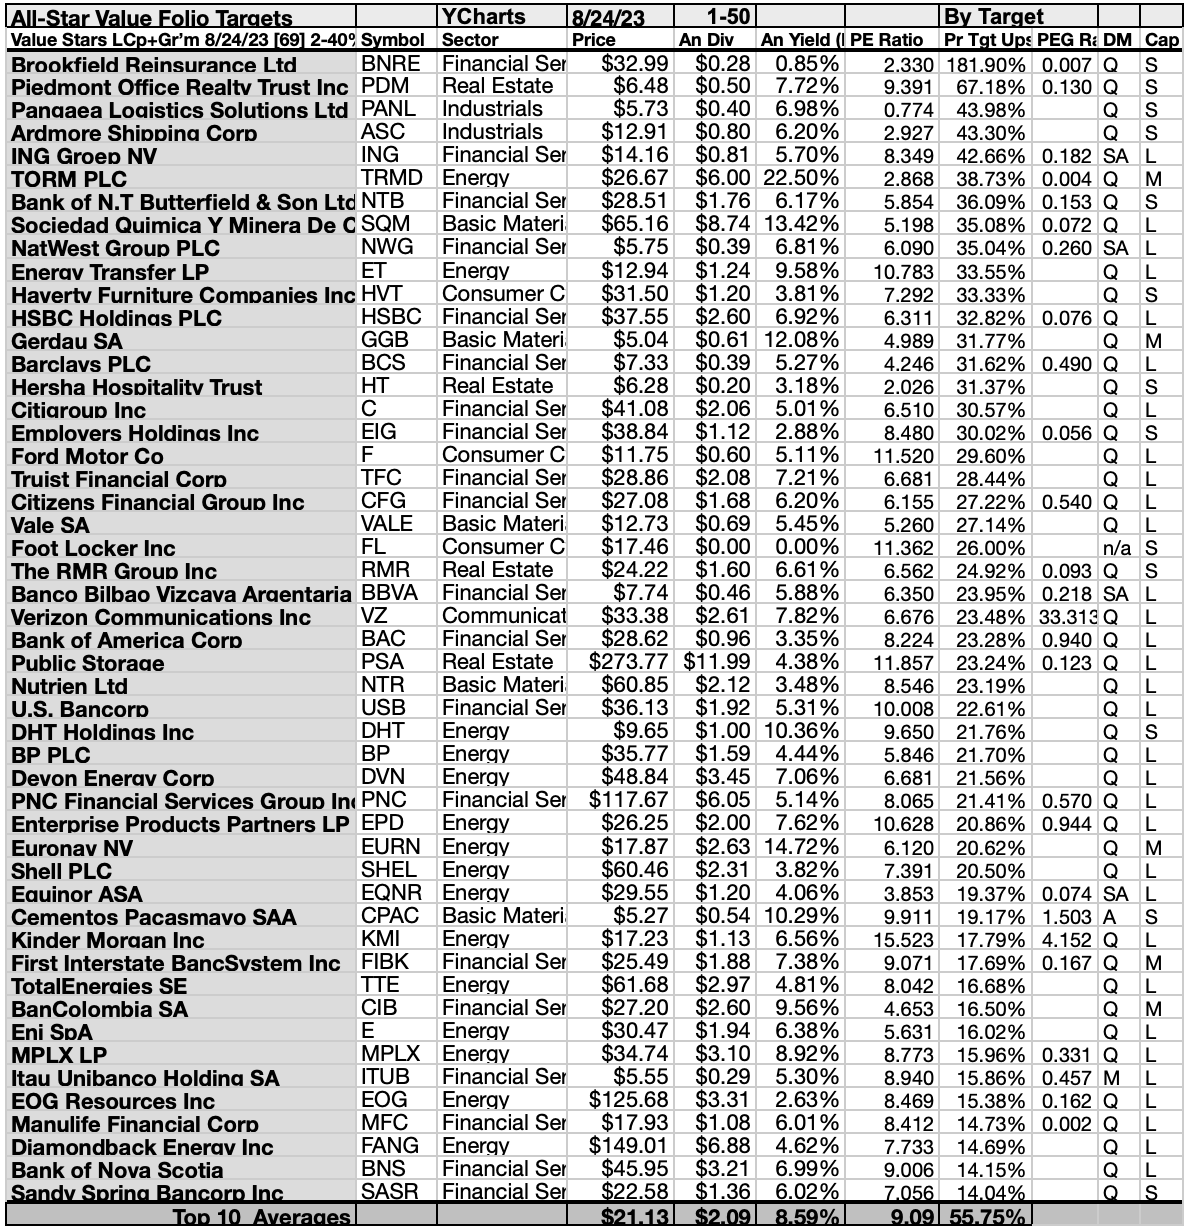
Top 50 All-Star-Value Picks By Broker 1Yr Price Targets
This scale of broker-estimated upside (or downside) for stock prices provides a scale of market popularity. Note: no broker coverage or 1 broker coverage produced a zero score on the above scale. This scale can be taken as an emotional component as opposed to the strictly monetary and objective dividend/price yield-driven report below. As noted above, these scores may also be taken as contrarian.
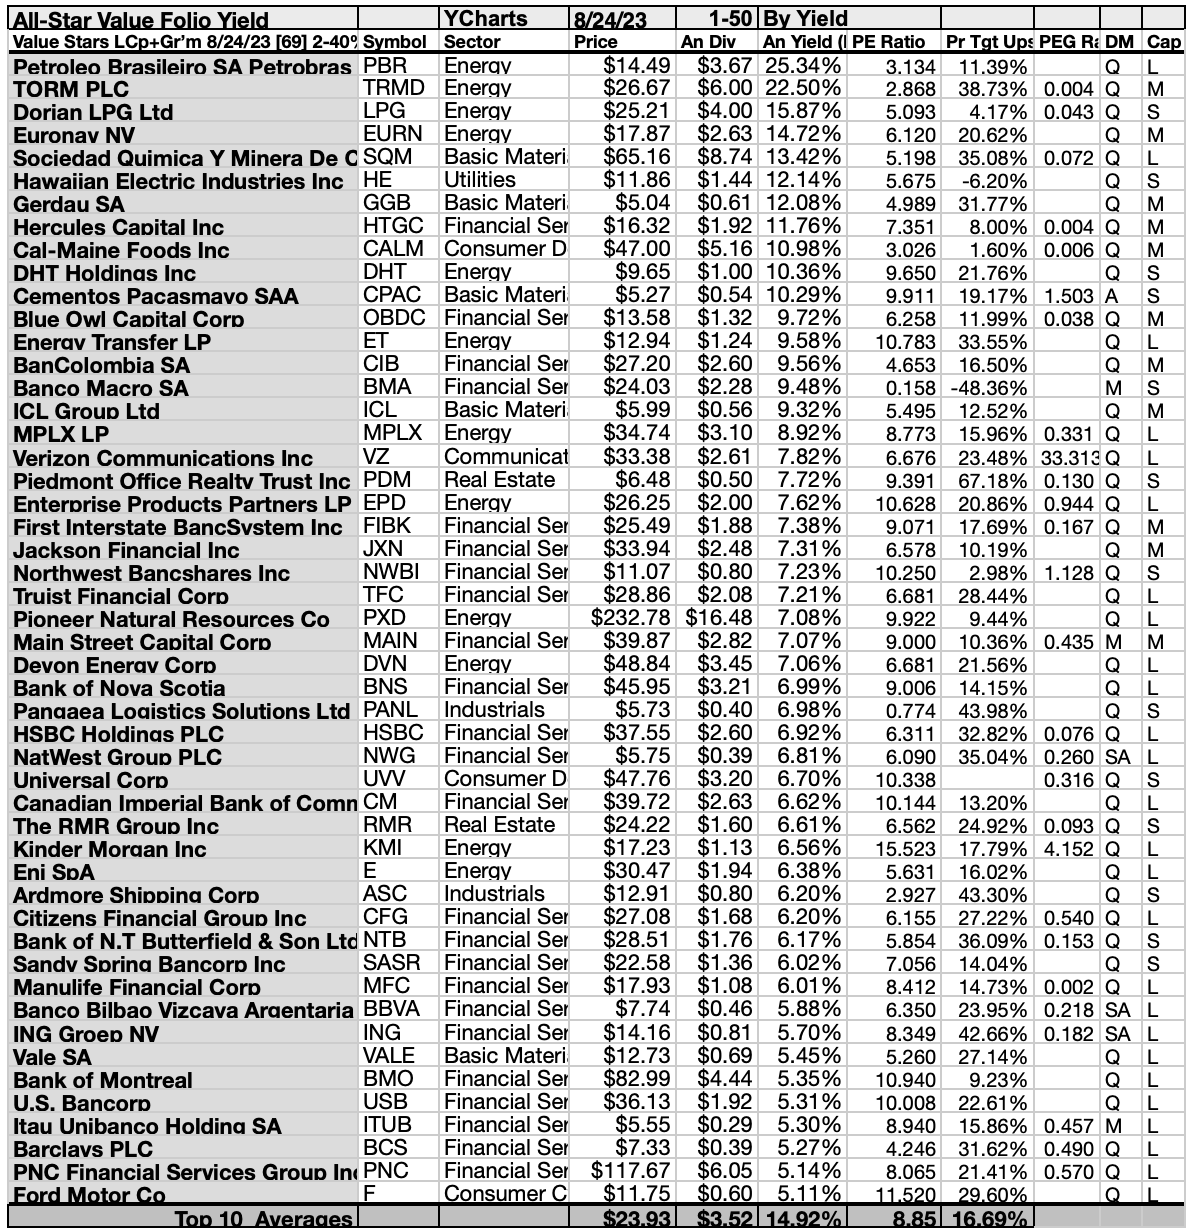
Top 50 All-Star-Value Picks By Annual Dividend Yield
Actionable Conclusions (11-20): Ten Top Stocks By Yield Are The September Dogs of The All-Star-Value Pack
Top ten All-Star-Value stocks selected 8/24/23 by yield represented five of eleven Morningstar sectors. First place was secured by the first of five energy sector representatives, Petroleo Brasileiro S.A. - Petrobras [1]. Four more energy stocks placed second, third, fourth, and tenth: TORM plc ( TRMD ) [2[, Dorian LPG Ltd. ( LPG ) [3], Euronav NV [4], and DHT Holdings [10].
Then, two basic materials members placed fifth, and seventh, Sociedad Quimica Y Minera de Chile S.A. [5], and Gerdau S.A. [7].
A representative from the utilities sector placed sixth, Hawaiian Electric Industries ( HE ) [6]. One financial services sector member placed eighth, Hercules Capital ( HTGC ) [8].
Another loner filled out the field. The consumer defensive representative took the ninth place, Cal-Maine Foods ( CALM ) [9], to complete this All-Star-Value top ten, by yield, for September.
Actionable Conclusions: (21-30) Ten All-Star-Value Dividend Stocks Showed 21.62% To 66.67% Upsides To September, 2024, With (31) Two 6.41% and 48.40% Losers
To quantify top-yield rankings, analyst median-price target estimates provided a "market sentiment" gauge of upside potential. Added to the simple high-yield metrics, analyst median price target estimates became another tool to dig-out bargains.
Analysts Estimated A 0.36% Disadvantage For 5 Highest Yield, Lowest Priced of Top-Ten All-Star-Value Dogs To September 2024
Ten top All-Star-Value stocks were culled by yield for this monthly update. Those (dividend/price) results provided by YCharts did the ranking.
As noted above, top-ten All-Star-Value Dogs selected 8/24/23, showing the highest dividend yields, represented five of eleven sectors in the Morningstar scheme.
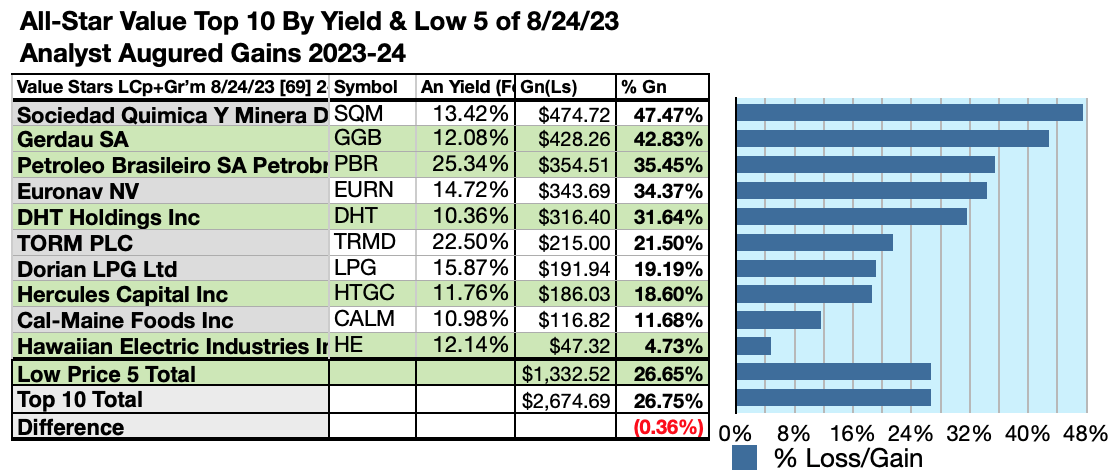
Actionable Conclusions: Analysts Estimated 5 Lowest-Priced Of Ten Highest-Yield All-Star-Value Dividend Stocks (33) Delivered 26.65% Vs. (34) 26.75% Net Gains by All Ten by September, 2024
$5000 invested as $1k in each of the five lowest-priced stocks in the top ten All-Star-Value dividend pack, by yield, were predicted by analyst 1-year targets to deliver 0.36% LESS gain than $5,000 invested as $.5k in all ten. The tenth lowest-priced All-Star-Value top-yield stock, Sociedad Quimica Y Minera De Chile SA, was projected to deliver the best net gain of 47.47%.
Source: YCharts.com
The five lowest-priced top-yield All-Star-Value dividend stocks for September were: Gerdau S.A.; DHT Holdings; Hawaiian Electric Industries Inc; Petroleo Brasileiro S.A. - Petrobras; Hercules Capital, with prices ranging from $5.04 to $16.32
The five higher-priced top-yield All-Star-Value dividend stocks for September were: Euronav NV; Dorian LPG Ltd.; TORM plc; Cal-Maine Foods; Sociedad Quimica Y Minera de Chile S.A., whose prices ranged from $17.87 to $65.16.
This distinction between five low-priced dividend dogs and the general field of ten reflected Michael B. O'Higgins' "basic method" for beating the Dow. The scale of projected gains based on analyst targets added a unique element of "market sentiment" gauging upside potential. It provided a here-and-now equivalent of waiting a year to find out what might happen in the market. Caution is advised, since analysts are historically only 15% to 85% accurate on the direction of change and just 0% to 15% accurate on the degree of change.
Afterword
If somehow you missed the suggestion of the fifty-one stocks ripe for picking at the start of the article, here is a repeat of the list at the end:
55 Ideal Value Star Dogs
In the current market bounce, dividends from $1K invested in the fifty-five stocks listed above met or exceeded their single share prices as of 8/24/23.
As we are well-over one-third past three years since the 2020 Ides of March dip, the time to snap up some top-yield All-Star-Value dogs is now... unless another big bearish drop in price looms ahead. (At which time your strategy would be to add to your holdings.)
Recent vs Break-Even Top-Ten All-Star-Value Stock Prices
Since all of the top-ten All-Star-Value Dividend shares are now priced less than the annual dividends paid out from a $1K investment, the following top chart shows the dollar and percent variants to all ten top dogs conforming to (but not exceeding) the dogcatcher ideal.
Those at recent prices are the subject of the middle chart with the break-even pricing of all ten is delivered in the bottom chart.
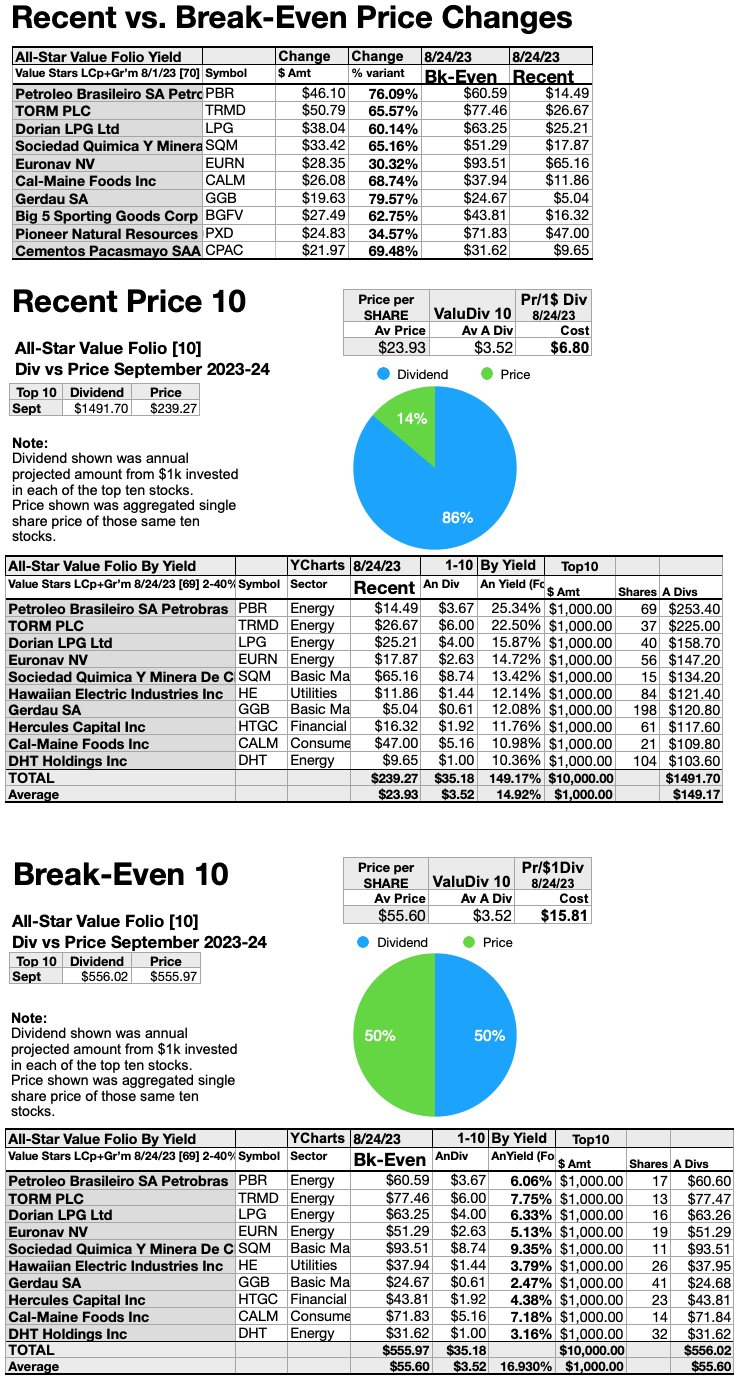
You could look at the top chart as an indicator of how high each stock might rise in the coming year or two. However, it also shows how much the price must fall (in either dollars or percentage) before it exactly conforms the standard of dividends from $1K invested equaling the current single share price.
Net gain/loss estimates above did not factor in any foreign or domestic tax problems resulting from distributions. Consult your tax advisor regarding the source and consequences of "dividends" from any investment.
Stocks listed above were suggested only as possible reference points for your All-Star-Value Dividend dog stock purchase or sale research process. These were not recommendations.
Disclaimer: This article is for informational and educational purposes only and should not be construed to constitute investment advice. Nothing contained herein shall constitute a solicitation, recommendation or endorsement to buy or sell any security. Prices and returns on equities in this article except as noted are listed without consideration of fees, commissions, taxes, penalties, or interest payable due to purchasing, holding, or selling same.
Graphs and charts were compiled by Rydlun & Co., LLC from data derived from www.indexarb.com; YCharts.com; finance.yahoo.com; analyst mean target price by YCharts. Dog silhouette: Open source dog art from dividenddogcatcher.com.
For further details see:
69 Ben Graham September Value Stocks: 55 Ridiculous Buys