EARN - 9% Dividend Yields Headed To 13%
Summary
- These shares offer a respectable yield today, but an even better yield in a few years as they are set for huge increases.
- The market is only really looking at one of the shares. The valuation for that share implies that the others are severely undervalued because they aren't getting enough attention.
- I will lay it all out for you. When this is done, it should be painfully difficult to disagree. Unless you failed elementary math.
- We’ve raised our position in these shares to take advantage of the exceptional bargain.
Get ready for charts, images, and tables because they are better than words. The ratings and outlooks we highlight here come after Scott Kennedy’s weekly updates in the REIT Forum. Your continued feedback is greatly appreciated, so please leave a comment with suggestions.
Things are getting wild again with the preferred shares and it's time to discuss relative valuations. Before I dive into this, I want to highlight that the issue here is relative valuation. In isolation, I believe AGNCN is more reasonably priced than peers. However, the peers are dramatically cheaper relative to AGNCN. This creates an opportunity for investors to move between shares.
The following article is one portion of last night's article for REIT Forum members . In the full report we covered a handful of other shares also. When the market is this wild, I often don't have time to provide as many public articles. To keep some of them coming out, I'll be sharing sections from some of our subscriber reports. You may notice a slightly different writing style in these pieces as it is assumed investors are already familiar with the shares.
AGNC Preferred Shares
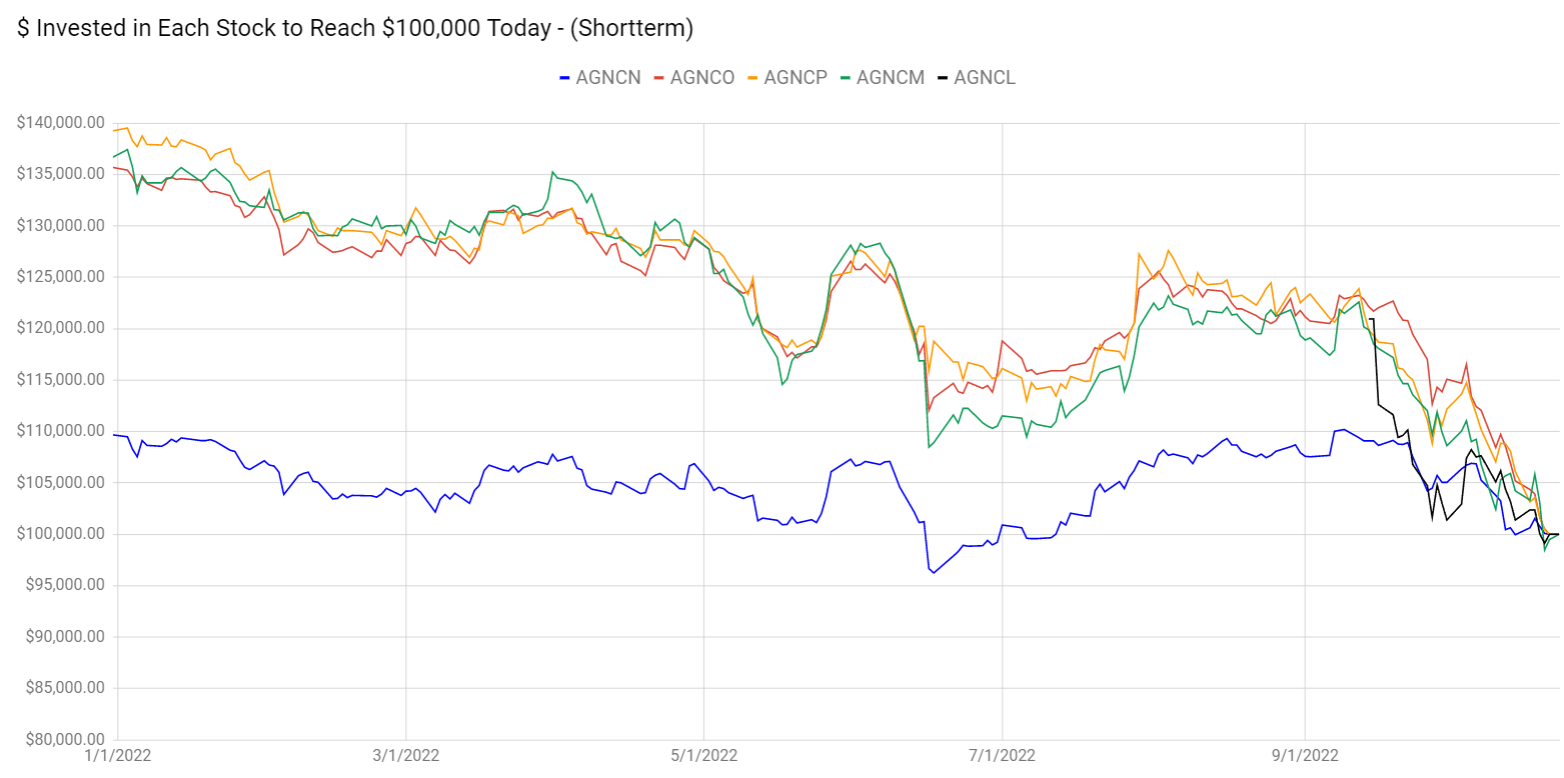
We’re at a new record for absurdity in relative pricing. Using the $100k chart, we can see that AGNCN ( AGNCN ) has outperformed again:
The REIT Forum
The core of this lesson is to demonstrate that the market is getting this terribly wrong. Please refrain from yelling: “AGNCN has a bigger yield!” At least refrain until finishing the article.
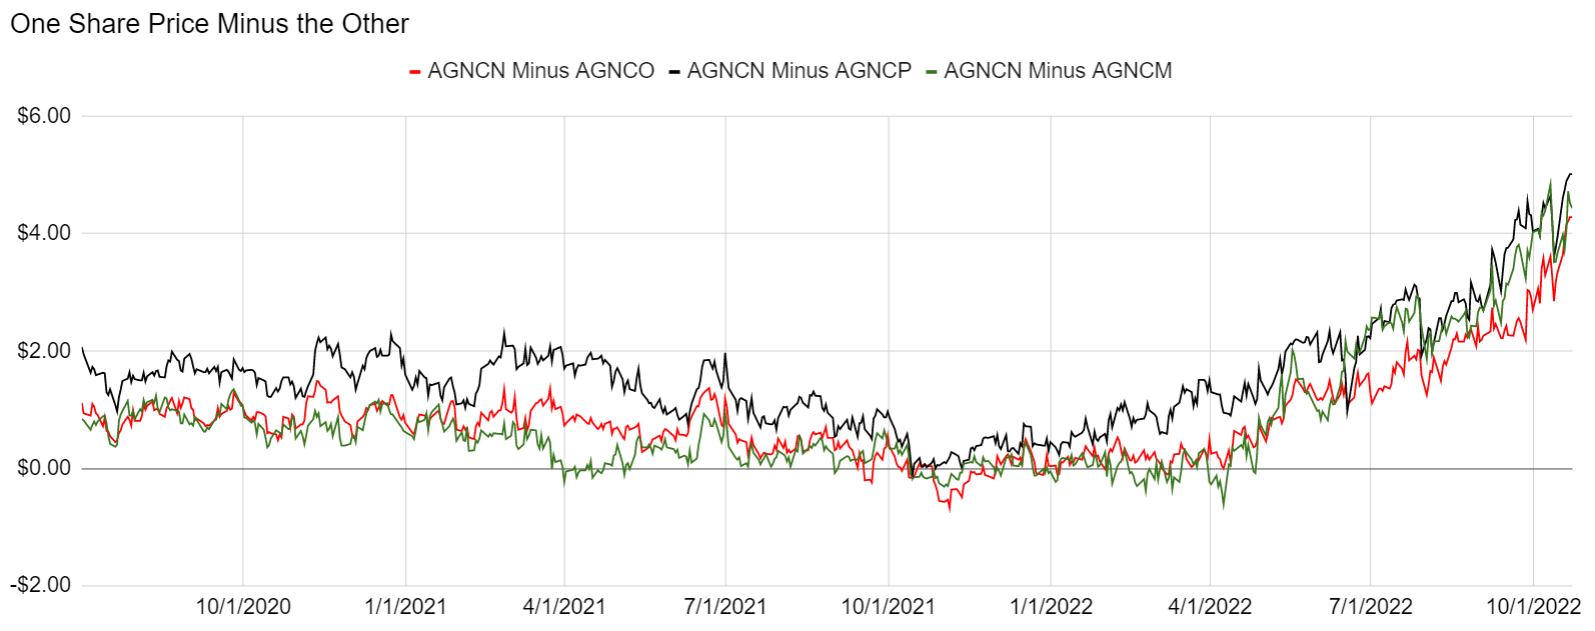
We’re going to largely exclude AGNCL from this conversation since it creates a few more complexities with the different reset rate and the longer period before shares begin floating. Since these are all preferred shares and roughly similar to each other, we also can use a simple comparison of share prices:
The REIT Forum
It became pretty obvious here that the share prices have dramatically disconnected. I understand some members will still focus on the big floating yield for AGNCN today regardless of any deeper analysis. The market has quite clearly done just that.
The gap between the shares is at record levels by a dramatic margin:
The REIT Forum
The gap in share prices also results in extremely strange exchange ratios:
The REIT Forum
This is absurd.
I’ve gone through quite a few layouts for comparing different shares. Hopefully this one will hammer home all the relevant data quickly.
AGNCO vs. AGNCN
AGNCO and AGNCN will have very similar floating spreads. When both shares float, AGNCO’s dividend will be lower by about $.03 per share per year.
If you would be so kind, estimate how much you would be willing to pay for $.03 per share per year. This is part of a share that could be called away from you, so you really don’t want to overpay.
You probably required a yield lower than 33% but greater than 8%, right? If so, your number is somewhere between $.09 and $.375.
My estimate was $.18.
Equal Ending Price Scenario
For a moment, let’s just assume that the shares will trade at equal prices.
AGNCO will pay out $3.25 per share and costs $4.28 less than AGNCN.
So, our hypothetical buyer has $22.18 in his account. He could either buy:
- 1 share of AGNCO with $4.28 leftover.
- 1 share of AGNCN.
Let’s look at the dividends to figure out how much cash this investor has two two years from today based on different interest rate scenarios. We’re assuming the guy who bought AGNCO doesn’t bother getting interest on his $4.28 in cash:
- AGNCO buyer gets paid $3.25. Combined with $4.28 in starting cash, he has $7.53.
- AGNCN buyer gets $4.55 in cash, assuming 3-month LIBOR averages 4%.
What if 3-month LIBOR is higher?
- At 5% AGNCN gets $5.05
- At 6% AGNCN gets $5.55
- At 7% AGNCN gets $6.05
- At 8% AGNCN gets $6.55
- At 9% AGNCN gets $7.05
- At 10% AGNCN gets $7.55
There you have it. If 3-month LIBOR averages 10% or higher over the next eight floating dividend payments, then AGNCN wins so long as the AGNCO buyer doesn’t get any interest on their cash .
If the AGNCO buyer gets 10% interest on their cash, that’s another $.428 for AGNCN to cover. If the AGNCO buyer gets interest on cash similar to 3-month LIBOR, then it would be closer to 11% for 3-month LIBOR to let AGNCN win.
What About If Ending Prices Are Different?
If you assume the investor is closing out their position after AGNCO starts floating (so 10/15/2024 or later), you can simply apply the difference to the account. If you say AGNCN should be worth an extra $.18, then simply add $.18 to the values for AGNCN. In other words, you can take less than 0.5% off the 3-month LIBOR rate necessary for AGNCN to “win.” That means a little bit above 9.5%.
In this scenario, even if 3-month LIBOR averages 6%, AGNCN loses by $1.98. That’s without the investor earning any interest at all on their cash balance. In that scenario, it would take about 66 more years (after they both float) without shares being called for AGNCN to catch up with AGNCO on cash flows.
What if I Want to Sell Sooner?
I would want to tell you that the market will be discounting these future cash flows. That’s the reasonable thing for the market to do. In September 2024, what fool would overpay for AGNCN when they could have AGNCO? However, the market is emphatically overpaying for AGNCN today. Is there a simpler way to put it?
Assuming no bid-ask spread, the investor in AGNCN simply dumps there shares of AGNCN, buys AGNCO, and pockets the spread of $4.28. If they want to, they can put some of that money to work on buying more shares of AGNCO. If they just feel more comfortable with cash on hand, they can keep it in cash. They will miss out on some dividends, but they won’t miss out $4.28 in dividend. Not unless 3-month LIBOR is averaging around 11%.
I hope I don’t need to point out that if 3-month LIBOR is averages 11%, either we have absolutely massive inflation or everything is getting wiped out as investors dump everything just to sit in money market funds (or short-term Treasuries) to collect what they can as the Federal Reserve shoves the U.S. government over the fiscal cliff.
Note: If we had massive inflation, then at least GDP growth and revenues would be soaring higher. Not good, but a better scenario for 11% than having 11% without inflation.
If all federal debt was pushed up to 11% (across the curve), then based on the current level of debt we would have about $3,435 trillion in annual interest expense. For context, the CBO is projecting (optimistically) that in 2023 total federal tax revenues will be $4.89 trillion. Strip out payroll taxes (for things like social security / Medicare) and the remaining revenue would be $3,318. That means total individual income taxes, corporate income taxes, and other income taxes would be less than the interest expense at 11%.
In brief, if you’re feeling like we’re headed to 11%, you’re going to want a vastly different investing strategy.
Why Not Equal Dollar Amounts?
Doing an equal dollar amount in each share can complicate analysis here because it requires more guesses about future LIBOR rates. We remove that from the equation by using an equal number of shares. It's a technique to remove as many variables from the equation as possible, so the correct answer becomes more obvious.
There’s nothing wrong with using equal dollar amounts. When we swap positions, we will often move an equal dollar amount. However, the first step in swapping positions is being confident that the relative values are correct. By reducing variables, we can hammer that point home.
AGNCO, AGNCP, and AGNCM are dramatically superior to AGNCN.
What if AGNCN is Called?
If management calls AGNCN at this point, they should just resign. If they want to reduce their preferred equity, they can put a buyback program in place to buyback all five shares in the open market. They would get AGNCN for about 10% below call value (at current prices) and get a vastly better deal on all of the other shares. Calling AGNCN here would be an astoundingly bad decision. Yes, it has a high coupon rate. Management is going to look much further than that.
Even if management wanted to retire shares quicker, they could simply use a buyback program so large it would bump market prices. They could pay prices materially above the market rates on AGNCM, AGNCO, and AGNCP. It would still be a vastly better deal than calling AGNCN at $25.00.
In my experience with AGNC, I haven’t known their board to ever commit a mistake as absurd at as this. Remember, they issued AGNCL recently. They managed to issue that share over $24.00. It was a stroke of genius. That share is only $19.43 today.
Could AGNCN be called at some point in the next several years? Absolutely. The market environment might change and that could make sense. If they wanted to call AGNCN with a 5.111% floating spread, then they would probably also want to call AGNCO with a 4.993% floating spread. As we mentioned, AGNCO costs $4.28 less than AGNCN today.
I cannot find any other way to put into words just how distorted the risk/reward profile is between these shares.
Outlooks
Fiercely bullish on the outlook for AGNCO, AGNCP, and AGNCM at these prices. If short-term rates remain elevated, they will see dramatic increases in their dividend rates. If short-term rates go back to 0%, there won’t be many other options for investors. Either way, these shares trade at a dramatic discount that is much too large for the underlying risk. I believe the market pricing for AGNCN is far more reasonable than the pricing for the other three.
Subsequent Notes
After publishing the article containing the section above for subscribers on Sunday night, I increased my allocations to AGNCO and AGNCP today (Monday, 10/24/2022). To be clear, we are not married these positions. We are significantly overweight in them due to the valuation. When relative values change, we may find a superior alternative. At the present time, these valuations look excellent.
The rest of the charts in this article may be self-explanatory to some investors. However, if you’d like to know more about them, you’re encouraged to see our notes for the series . The part below is reproduced in each article to provide investors with easy access to the updated charts. It is my gift to readers.
Stock Table
We will close out the rest of the article with the tables and charts we provide for readers to help them track the sector for both common shares and preferred shares.
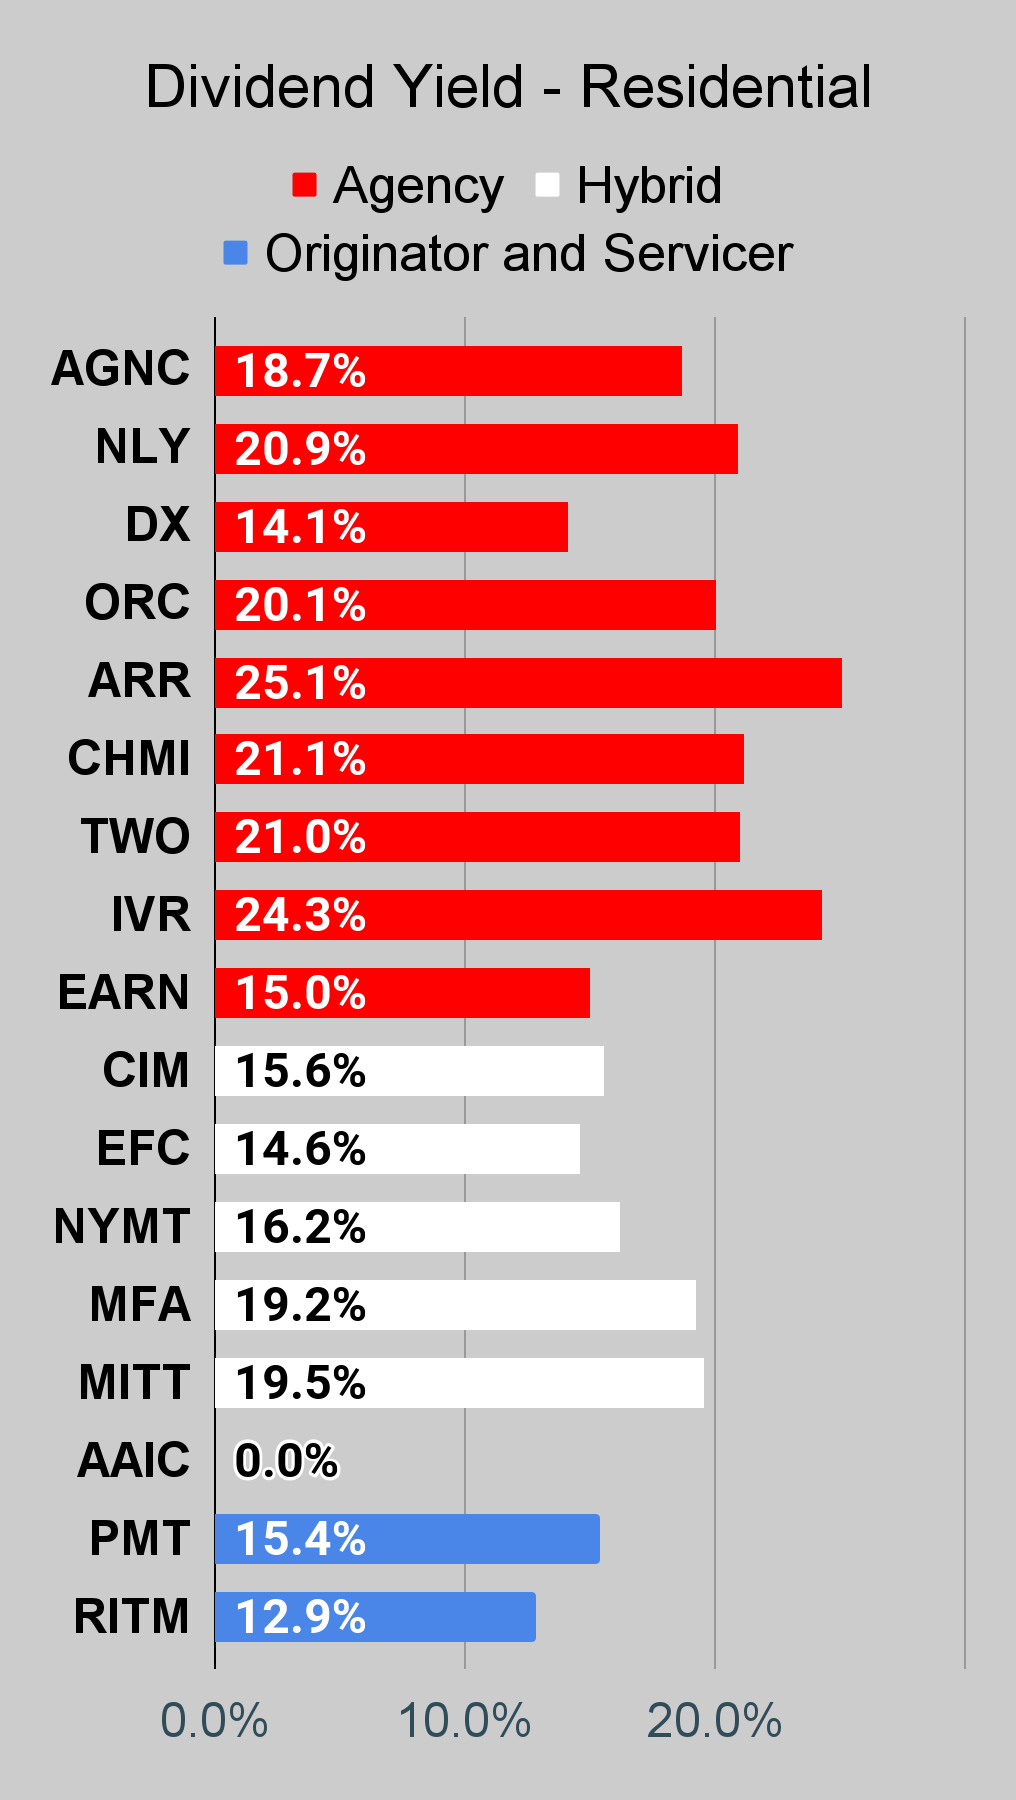
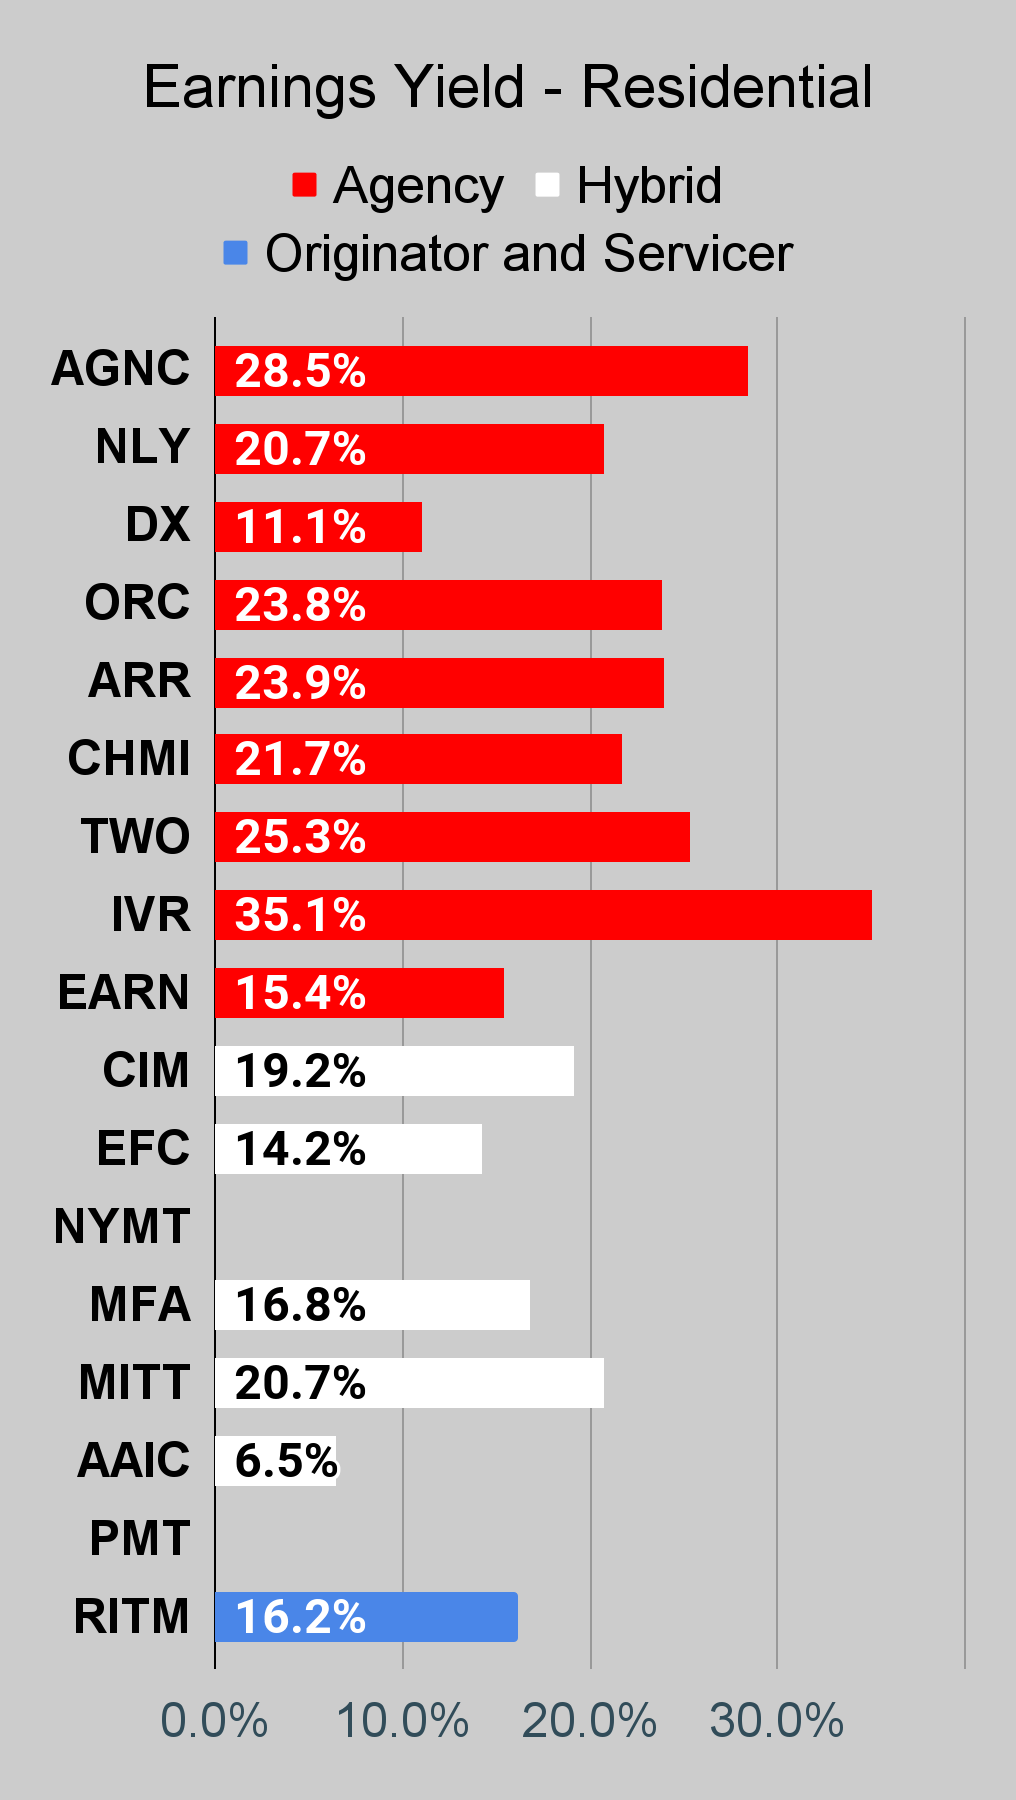
We’re including a quick table for the common shares that will be shown in our tables:
| Type of REIT or BDC |
| Residential Agency |
| Residential Hybrid |
| Residential Originator and Servicer |
| Commercial |
| BDC |
Let the images begin!
Residential Mortgage REIT Charts
Note: The chart for our public articles uses the book value per share from the latest earnings release. Current estimated book value per share is used in reaching our targets and trading decisions. It's available in our service, but those estimates are not included in the charts below. PMT and NYMT are not showing an earnings yield metric as neither REIT provides a quarterly “Core EPS” metric.
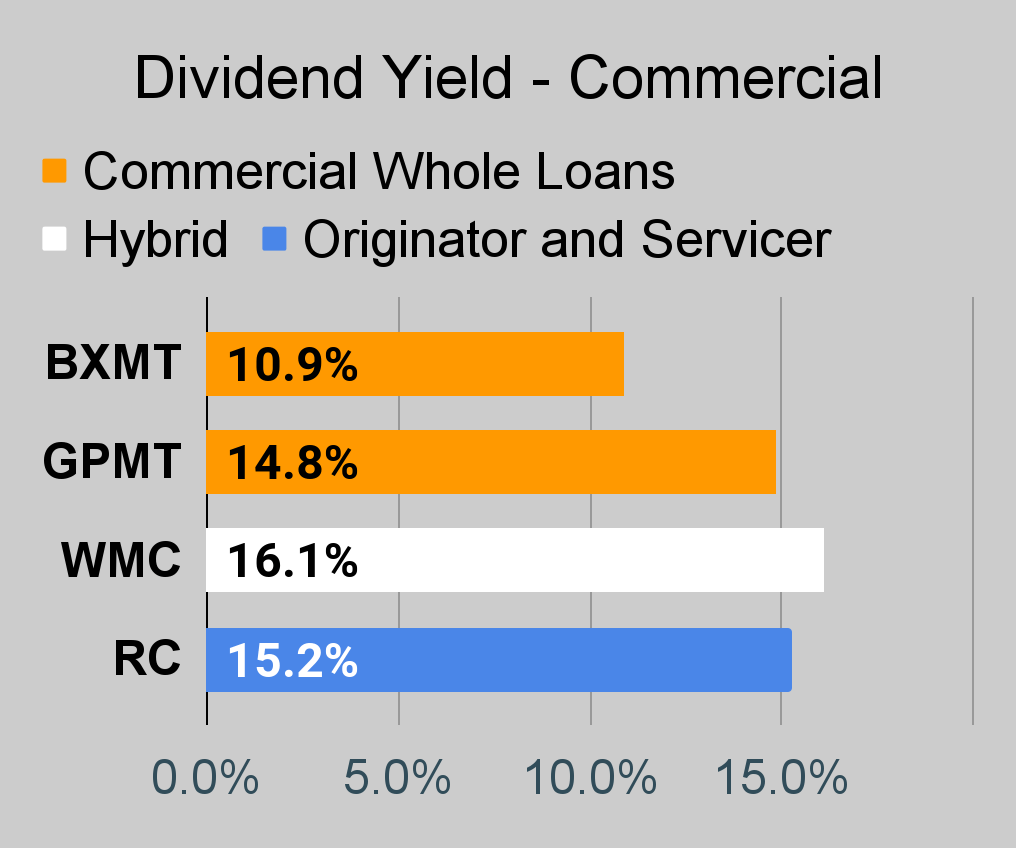
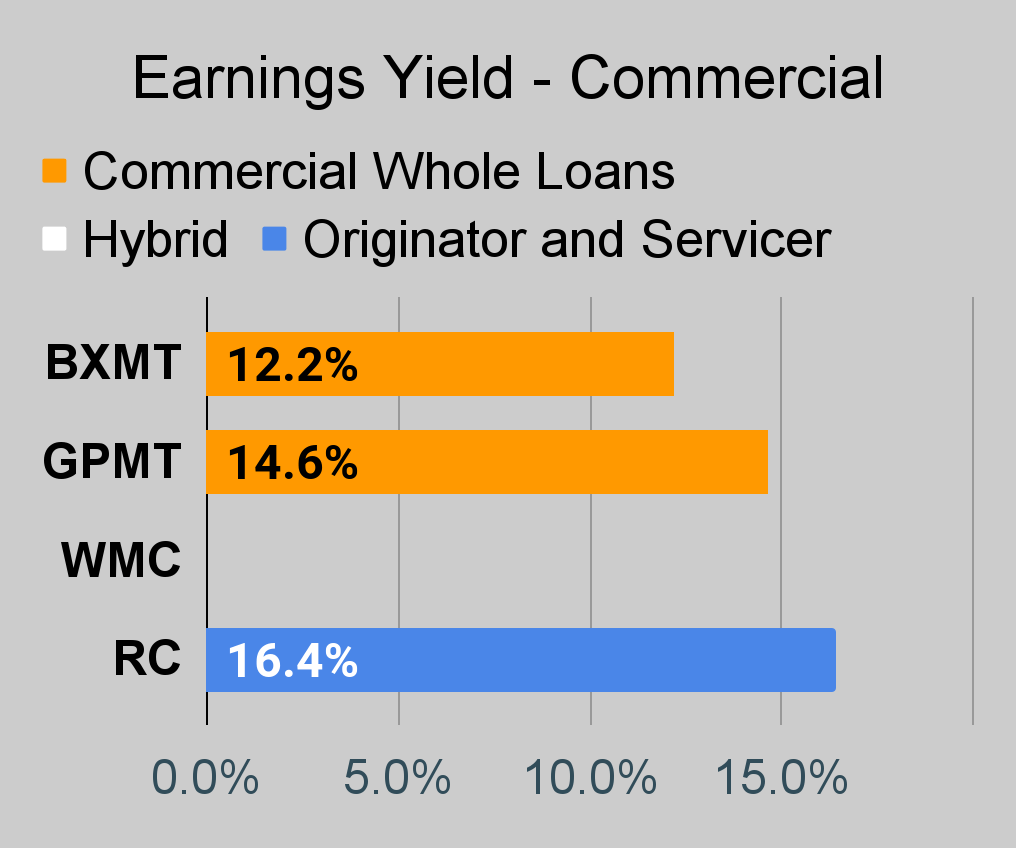
Commercial Mortgage REIT Charts
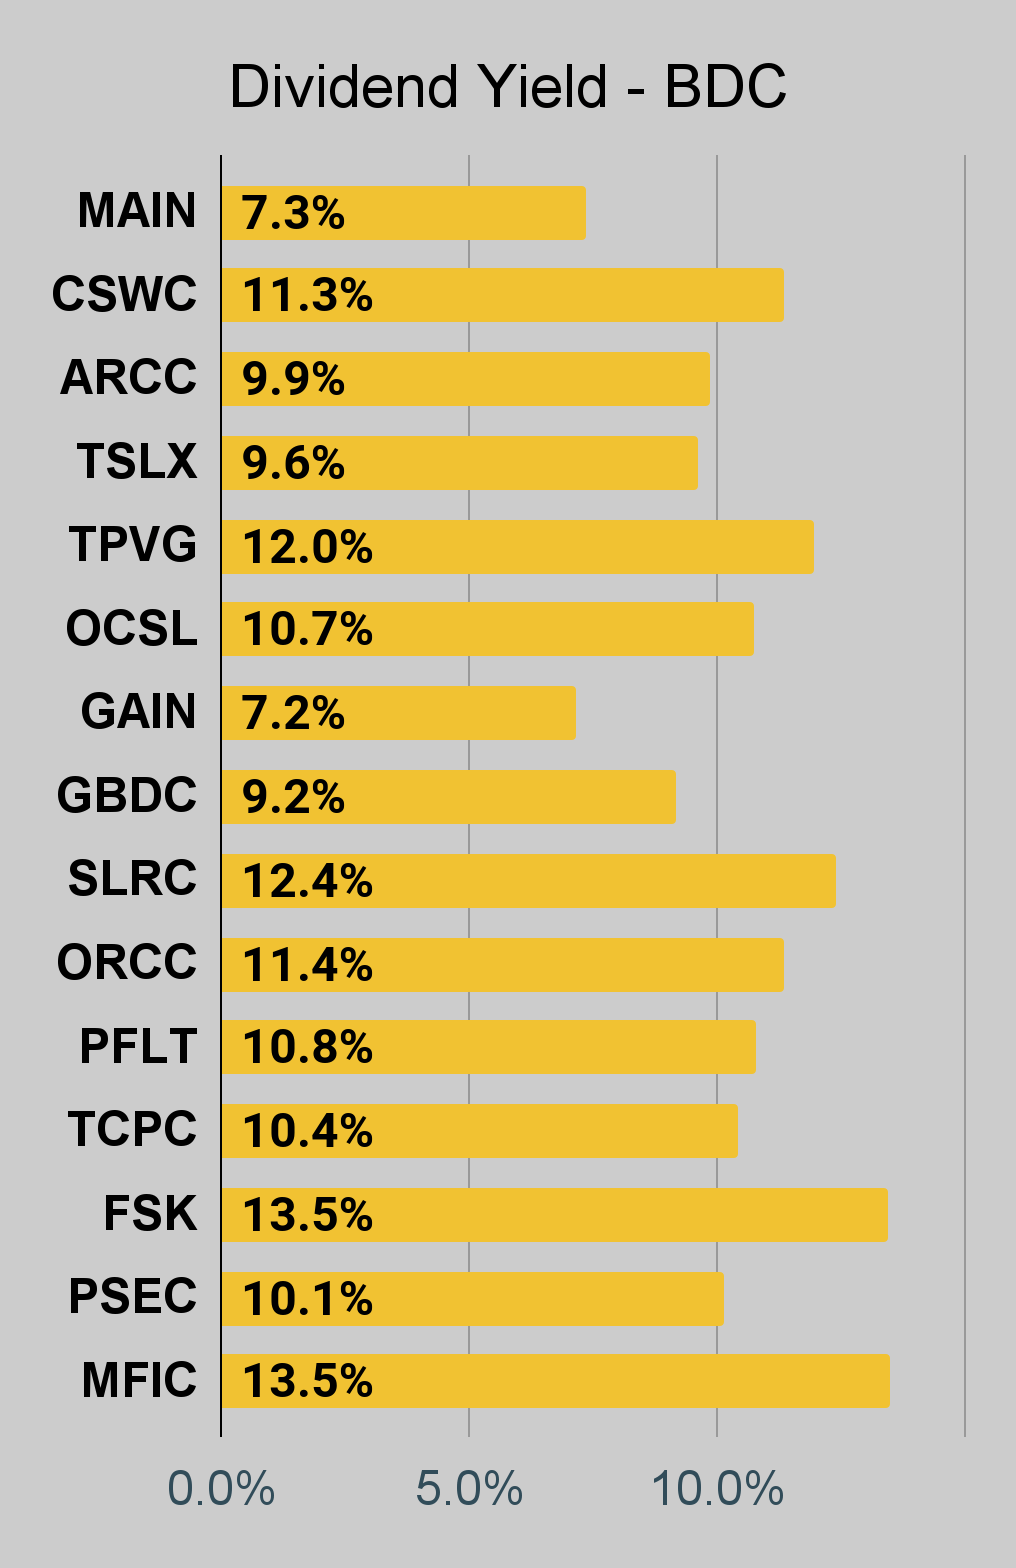
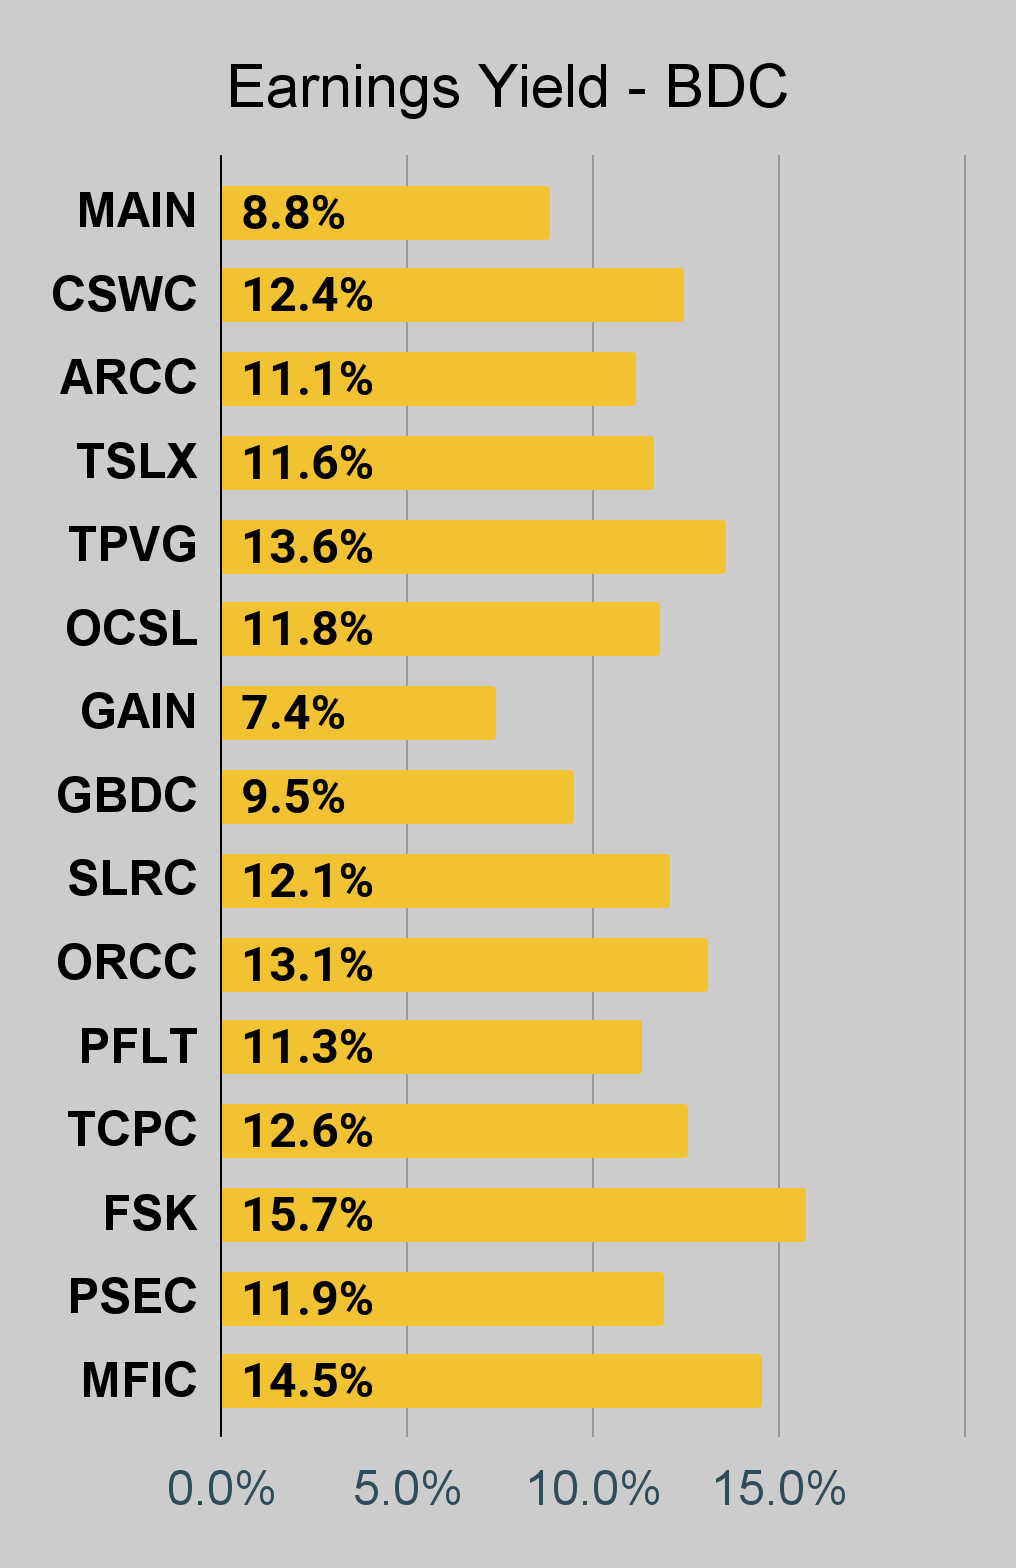
BDC Charts
Preferred Share Charts
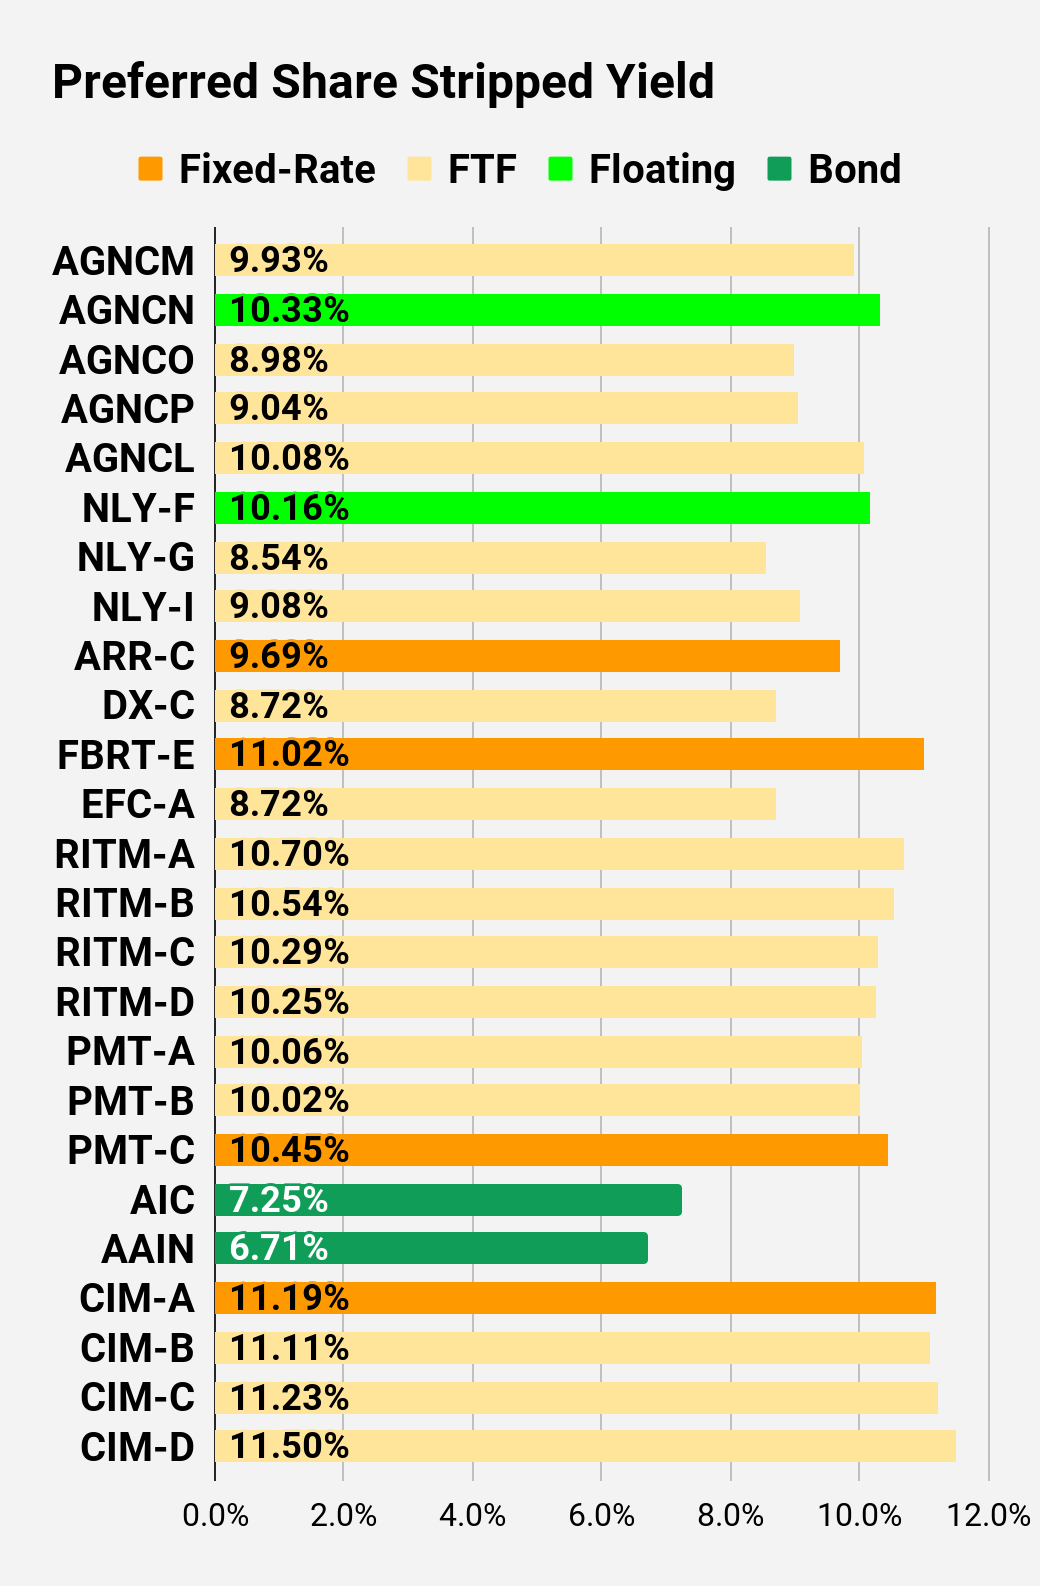
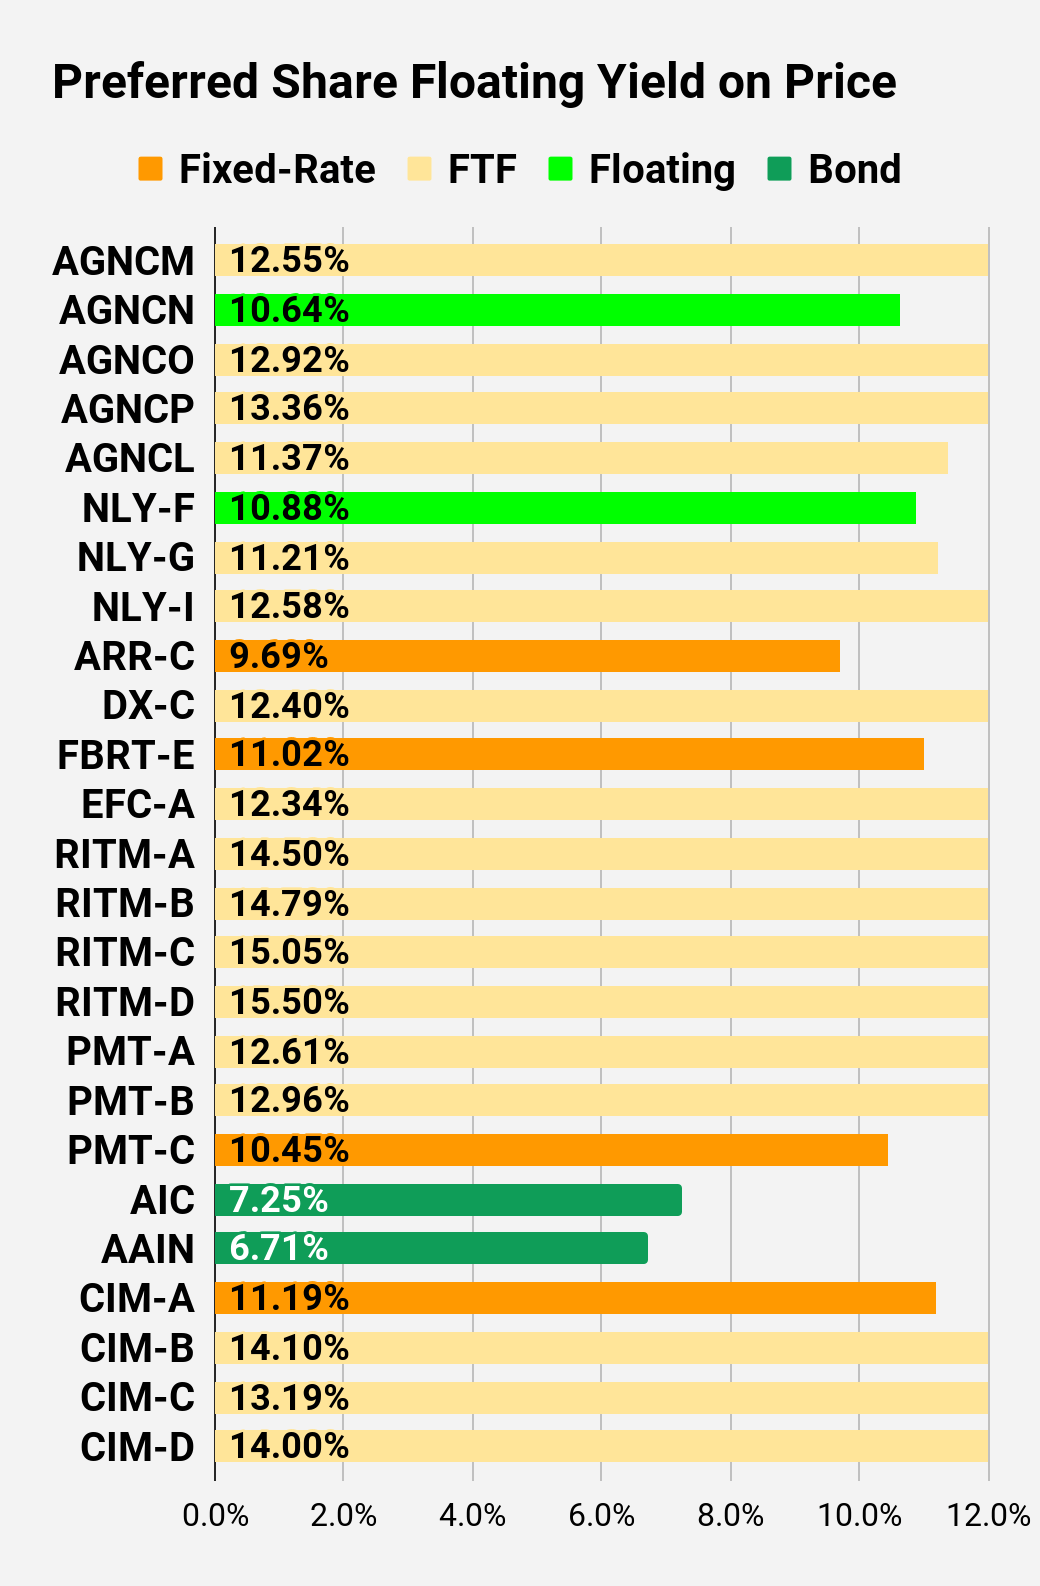
I changed the coloring a bit. We needed to adjust to include that the first fixed-to-floating shares have transitioned over to floating rates. When a share is already floating, the stripped yield may be different than the “Floating Yield on Price” due to changes in interest rates. For instance, NLY-F already has a floating rate. However, the rate is only reset once per three months. The stripped yield is calculated using the upcoming projected dividend payment and the “Floating Yield on Price” is based on where the dividend would be if the rate reset today. In my opinion, for these shares the “Floating Yield on Price” is clearly the more important metric.
Preferred Share Data
Beyond the charts, we’re also providing our readers with access to several other metrics for the preferred shares.
After testing out a series on preferred shares, we decided to try merging it into the series on common shares. After all, we are still talking about positions in mortgage REITs. We don’t have any desire to cover preferred shares without cumulative dividends, so any preferred shares you see in our column will have cumulative dividends. You can verify that by using Quantum Online. We’ve included the links in the table below.
To better organize the table, we needed to abbreviate column names as follows:
- Price = Recent Share Price - Shown in Charts
- BoF = Bond or FTF (Fixed-to-Floating)
- S-Yield = Stripped Yield - Shown in Charts
- Coupon = Initial Fixed-Rate Coupon
- FYoP = Floating Yield on Price - Shown in Charts
- NCD = Next Call Date (the soonest shares could be called)
- Note: For all FTF issues, the floating rate would start on NCD.
- WCC = Worst Cash to Call (lowest net cash return possible from a call)
- QO Link = Link to Quantum Online Page
| Ticker |
| Price |
| BoF |
| S-Yield |
| Coupon |
| FYoP |
| NCD |
| WCC |
| QO Link |
| P-Link |
| $17.43 |
| FTF |
| 9.93% |
| 6.88% |
| 12.55% |
| 4/15/2024 |
| $10.16 |
| $22.40 |
| Floating |
| 10.33% |
| 9.19% |
| 10.64% |
| 11/23/2022 |
| $2.85 |
| $18.21 |
| FTF |
| 8.98% |
| 6.50% |
| 12.92% |
| 10/15/2024 |
| $10.05 |
| $17.05 |
| FTF |
| 9.04% |
| 6.13% |
| 13.36% |
| 4/15/2025 |
| $11.79 |
| $19.52 |
| FTF |
| 10.08% |
| 7.75% |
| 11.37% |
| 10/15/2027 |
| $15.33 |
| $21.82 |
| Floating |
| 10.16% |
| 8.73% |
| 10.88% |
| 11/23/2022 |
| $3.50 |
| $19.27 |
| FTF |
| 8.54% |
| 6.50% |
| 11.21% |
| 3/31/2023 |
| $6.54 |
| $18.83 |
| FTF |
| 9.08% |
| 6.75% |
| 12.58% |
| 6/30/2024 |
| $9.13 |
| $18.11 |
| 9.69% |
| 7.00% |
| 9.69% |
| 1/28/2025 |
| $10.84 |
| $19.91 |
| FTF |
| 8.72% |
| 6.90% |
| 12.40% |
| 4/15/2025 |
| $9.40 |
| $17.15 |
| 11.02% |
| 7.50% |
| 11.02% |
| 11/23/2022 |
| $8.05 |
| $19.48 |
| FTF |
| 8.72% |
| 6.75% |
| 12.34% |
| 10/30/2024 |
| $8.97 |
| $17.57 |
| FTF |
| 10.70% |
| 7.50% |
| 14.50% |
| 8/15/2024 |
| $10.72 |
| $16.95 |
| FTF |
| 10.54% |
| 7.13% |
| 14.79% |
| 8/15/2024 |
| $11.18 |
| $15.54 |
| FTF |
| 10.29% |
| 6.38% |
| 15.05% |
| 2/15/2025 |
| $13.06 |
| $17.12 |
| FTF |
| 10.25% |
| 7.00% |
| 15.50% |
| 11/15/2026 |
| $14.89 |
| $20.50 |
| FTF |
| 10.06% |
| 8.13% |
| 12.61% |
| 3/15/2024 |
| $7.55 |
| $20.26 |
| FTF |
| 10.02% |
| 8.00% |
| 12.96% |
| 6/15/2024 |
| $8.24 |
| $16.40 |
| 10.45% |
| 6.75% |
| 10.45% |
| 8/24/2026 |
| $15.26 |
| $23.54 |
| Bond |
| 7.25% |
| 6.75% |
| 7.25% |
| 11/23/2022 |
| $1.77 |
| $22.40 |
| Bond |
| 6.71% |
| 6.00% |
| 6.71% |
| 8/1/2023 |
| $3.72 |
| $18.17 |
| 11.19% |
| 8.00% |
| 11.19% |
| 11/23/2022 |
| $7.21 |
| $18.30 |
| FTF |
| 11.11% |
| 8.00% |
| 14.10% |
| 3/30/2024 |
| $9.78 |
| $17.54 |
| FTF |
| 11.23% |
| 7.75% |
| 13.19% |
| 9/30/2025 |
| $13.36 |
| $17.69 |
| FTF |
| 11.50% |
| 8.00% |
| 14.00% |
| 03/30/2024 |
| $10.39 |
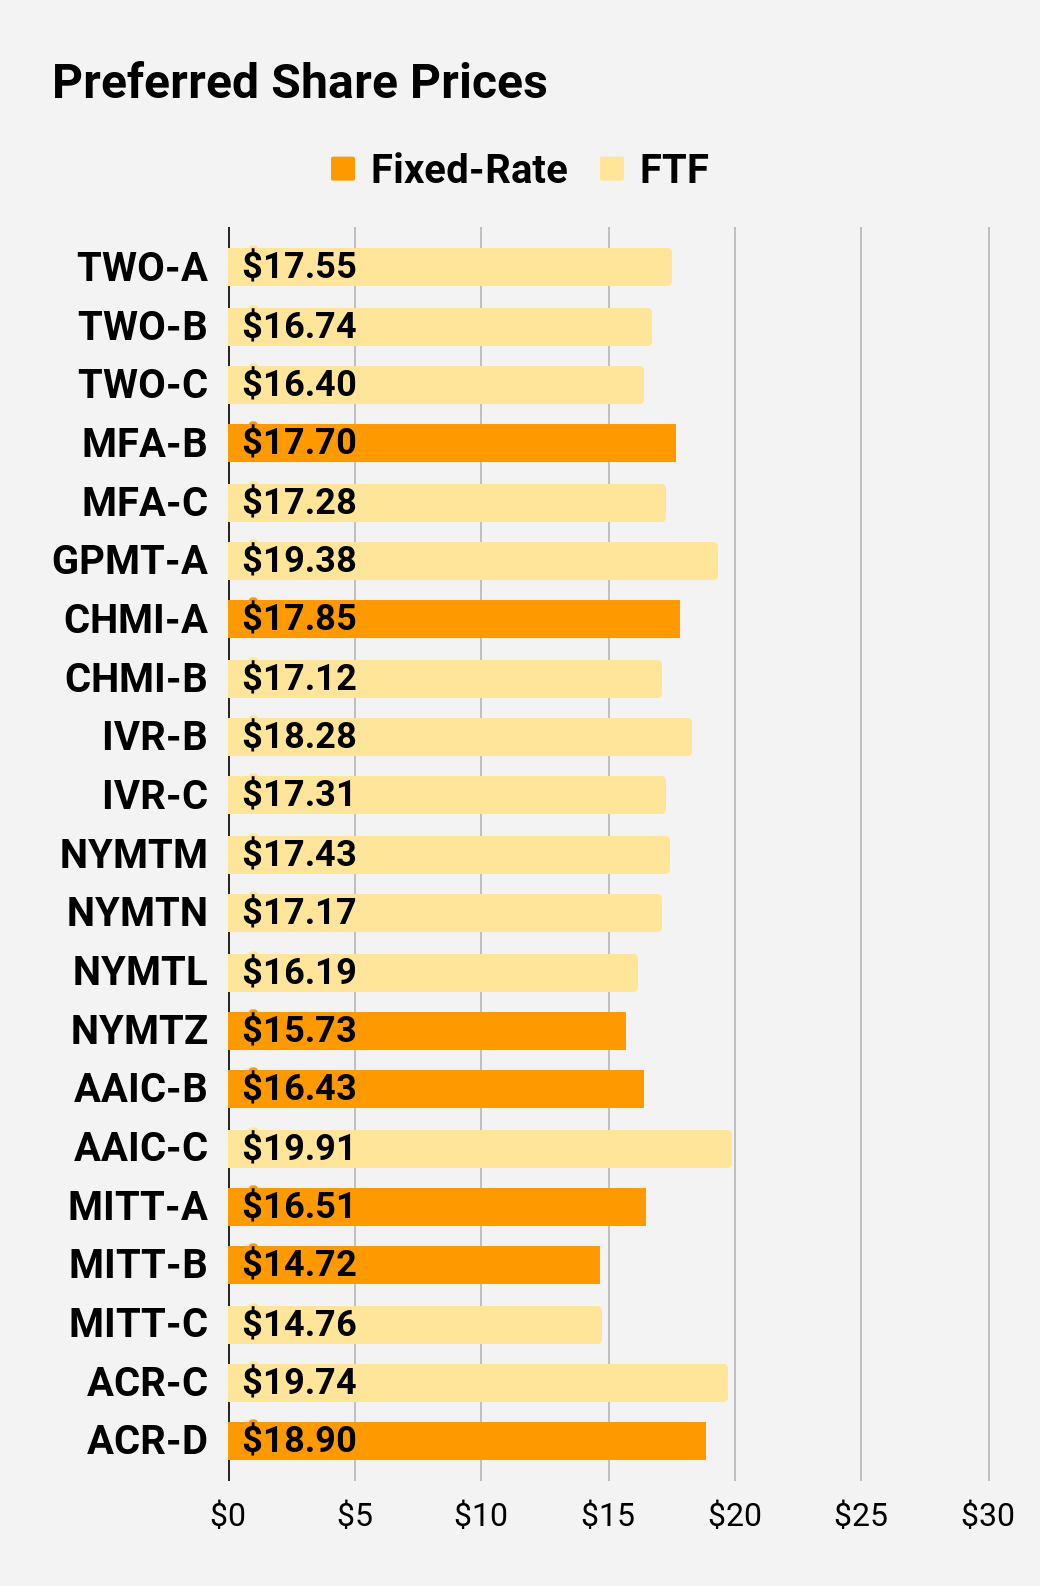
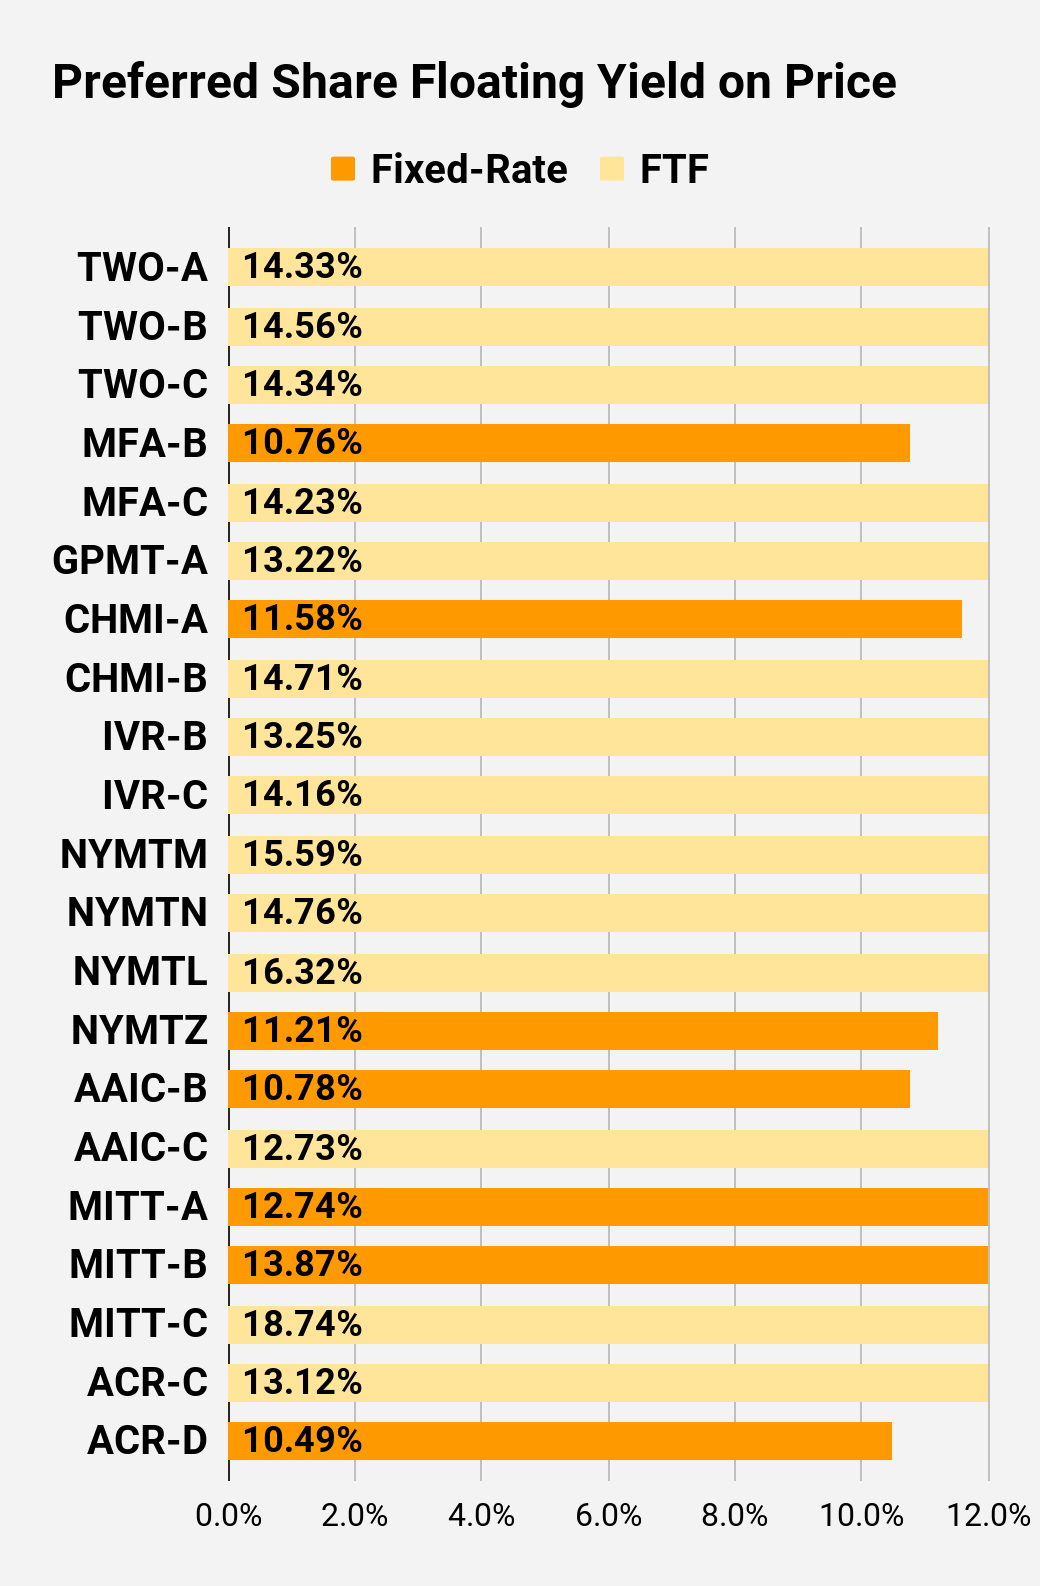
Second Batch:
| Ticker |
| Price |
| BoF |
| S-Yield |
| Coupon |
| FYoP |
| NCD |
| WCC |
| QO Link |
| P-Link |
| $17.55 |
| FTF |
| 11.62% |
| 8.13% |
| 14.33% |
| 04/27/2027 |
| $16.59 |
| $16.74 |
| FTF |
| 11.43% |
| 7.63% |
| 14.56% |
| 07/27/2027 |
| $17.31 |
| $16.40 |
| FTF |
| 11.10% |
| 7.25% |
| 14.34% |
| 1/27/2025 |
| $12.68 |
| $17.70 |
| 10.76% |
| 7.50% |
| 10.76% |
| 11/23/2022 |
| $7.58 |
| $17.28 |
| FTF |
| 9.53% |
| 6.50% |
| 14.23% |
| 3/31/2025 |
| $11.79 |
| $19.38 |
| FTF |
| 9.08% |
| 7.00% |
| 13.22% |
| 11/30/2026 |
| $12.83 |
| $17.85 |
| 11.58% |
| 8.20% |
| 11.58% |
| 11/23/2022 |
| $7.29 |
| $17.12 |
| FTF |
| 12.15% |
| 8.25% |
| 14.71% |
| 4/15/2024 |
| $10.90 |
| $18.28 |
| FTF |
| 10.77% |
| 7.75% |
| 13.25% |
| 12/27/2024 |
| $11.11 |
| $17.31 |
| FTF |
| 11.01% |
| 7.50% |
| 14.16% |
| 9/27/2027 |
| $17.09 |
| $17.43 |
| FTF |
| 11.38% |
| 7.88% |
| 15.59% |
| 1/15/2025 |
| $12.00 |
| $17.17 |
| FTF |
| 11.74% |
| 8.00% |
| 14.76% |
| 10/15/2027 |
| $17.83 |
| $16.19 |
| FTF |
| 10.69% |
| 6.88% |
| 16.32% |
| 10/15/2026 |
| $15.69 |
| $15.73 |
| 11.21% |
| 7.00% |
| 11.21% |
| 1/15/2027 |
| $16.71 |
| $16.43 |
| 10.78% |
| 7.00% |
| 10.78% |
| 11/23/2022 |
| $8.76 |
| $19.91 |
| FTF |
| 10.48% |
| 8.25% |
| 12.73% |
| 3/30/2024 |
| $8.10 |
| $16.51 |
| 12.74% |
| 8.25% |
| 12.74% |
| 11/23/2022 |
| $8.83 |
| $14.72 |
| 13.87% |
| 8.00% |
| 13.87% |
| 11/23/2022 |
| $10.61 |
| $14.76 |
| FTF |
| 13.84% |
| 8.00% |
| 18.74% |
| 9/17/2024 |
| $14.21 |
| $19.74 |
| FTF |
| 11.00% |
| 8.63% |
| 13.12% |
| 7/30/2024 |
| $9.03 |
| $18.90 |
| 10.49% |
| 7.88% |
| 10.49% |
| 5/21/2026 |
| $13.11 |
Strategy
Our goal is to maximize total returns . We achieve those most effectively by including “trading” strategies. We regularly trade positions in the mortgage REIT common shares and BDCs because:
- Prices are inefficient.
- Long-term, share prices generally revolve around book value.
- Short-term, price-to-book ratios can deviate materially.
- Book value isn’t the only step in analysis, but it is the cornerstone.
We also allocate to preferred shares and equity REITs. We encourage buy-and-hold investors to consider using more preferred shares and equity REITs.
Performance
We compare our performance against four ETFs that investors might use for exposure to our sectors:
The REIT Forum
The four ETFs we use for comparison are:
| Ticker |
| Exposure |
| One of the largest mortgage REIT ETFs |
| One of the largest preferred share ETFs |
| Largest equity REIT ETF |
| The high-yield equity REIT ETF. Yes, it has been dreadful. |
When investors think it isn’t possible to earn solid returns in preferred shares or mortgage REITs, we politely disagree. The sector has plenty of opportunities, but investors still need to be wary of the risks. We can’t simply reach for yield and hope for the best. When it comes to common shares, we need to be even more vigilant to protect our principal by regularly watching prices and updating estimates for book value and price targets.
Ratings:
- Very Bullish on AGNCO at $18.08, AGNCP at $16.97, and AGNCM at $17.45. I expect each to significantly outperform AGNCN at $22.34 over the next 24 months. These prices are slightly below the prices in the chart because I pulled lives prices for this statement just before publishing.
For further details see:
9% Dividend Yields Headed To 13%