FCO - ACP Vs. FCO: Comparing Abrdn's 14% And 17% Yielding Credit Funds
2023-09-06 11:40:04 ET
Summary
- The two funds discussed in the article focus on generating high current income and the yields are as high as 17%.
- The primary objective of these funds is to provide investors with a steady stream of income.
- But the intelligent investor looks beyond the objectives and the yields to see what the real return prospects are.
The primary aim of both the funds that we will talk about today is to provide high current income, and to that end, both currently have high double-digit yields. Capital appreciation is also something they strive for, but that comes secondary. While today will be our first foray into abrdn Income Credit Strategies Fund ( ACP ), we have covered abrdn Global Income Fund Inc. ( FCO ) a few times on this platform.
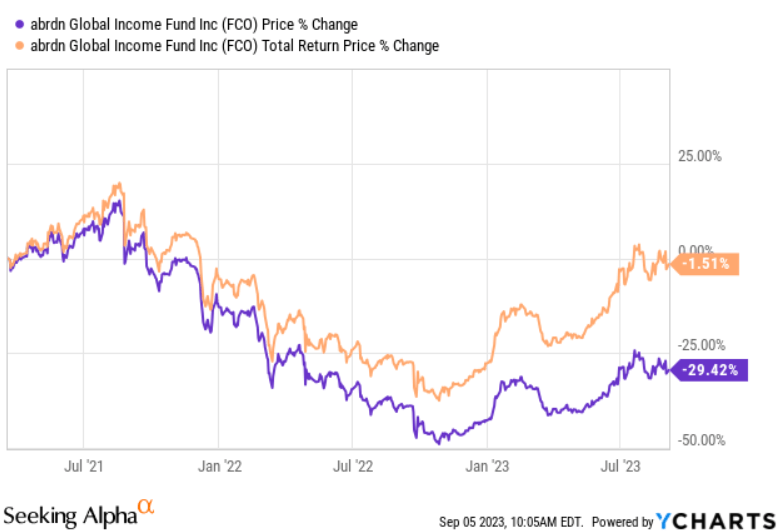
Our coverage of FCO back in March 2021 , and we have consistently rated it a strong sell each of the seven times we have reviewed it. The lofty distribution, comprised primarily of return of capital, has kept the total return flat over the years.
Reasons to dislike FCO are many , but its 14% yield keeps the income investors coming back for more. ACP belongs to the same fund family and yields an even higher 17%. We thought it apt to compare the two to see which comes out ahead in our opinion, relatively speaking of course.
Credit Quality
The FCO portfolio had around 341 securities at the end of July, with close to two thirds in junk or high yield securities.
FCO Factsheet - July 31
ACP, on the other hand, had close to 200 securities and had virtually all of its portfolio in below investment grade securities.
ACP Factsheet - July 31
There is no debating that FCO is the clear winner of this round. The cumulative credit quality of its holdings will give it far greater resiliency in the event of a recession or tighter economic conditions. Yes, most of FCO's investment grade securities fall in the last rung of that rating, however, that is far superior in quality to what ACP holds. The overwhelming majority of ACP's portfolio is rated "B", which is well into the junk universe and will provide no buffer when things go bad. The prices of the ACP securities are more vulnerable to a greater decline than those of FCO.
Geography
ACP picks securities primarily from the developed countries for its 100% high yield portfolio. The majority of the portfolio is comprised of securities from its home country, with U.K., Luxemburg, France, Germany and Netherlands occupying the next five spots.
ACP Factsheet - July 31
The 18.6% comprising the other category includes a bunch of countries, the listing of which can be found under CEF Connect . FCO, on the other hand, provides a bigger picture breakdown for its portfolio composition. This fund is more evenly spread across the globe compared to ACP.
FCO Factsheet - July 31
Interested parties can again proceed to CEF Connect to see a more granular breakdown of the geography. Taking the above breakdown one step further by looking at the currency exposure, ACP is exposed to EUR, USD and GBP, with the former making up the majority.
ACP Factsheet - July 31
The FCO holdings are more spread out, with USD forming the overwhelming majority.
FCO Factsheet - July 31
We are bullish on the prospects of the USD and on the face of it should declare FCO the winner of this round. So that is what we will do.
Sector
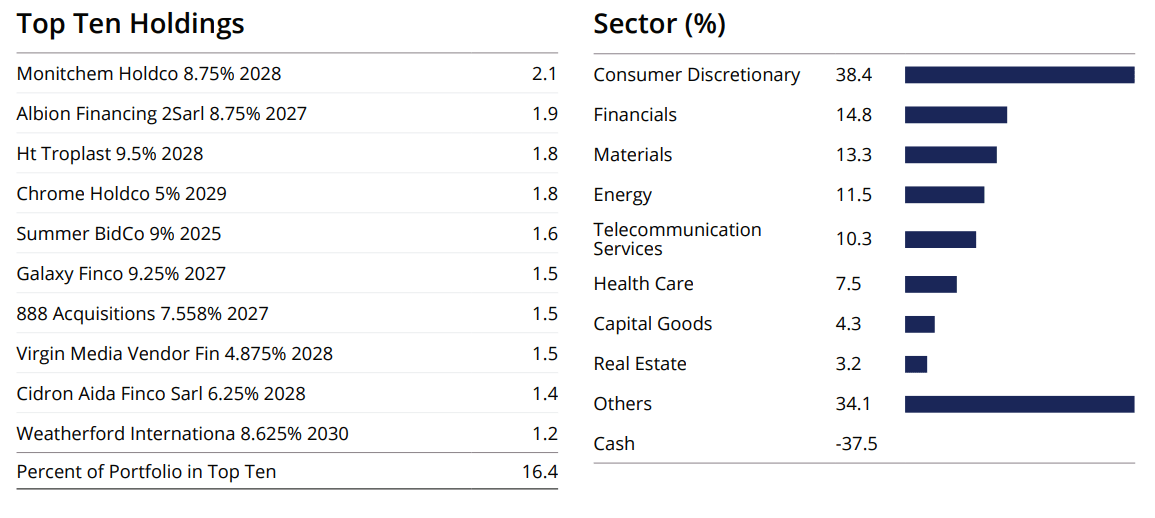
ACP's top 10 holdings make up 16.4% of the portfolio, and we can see the glimpse of the high yield in several of the coupons.
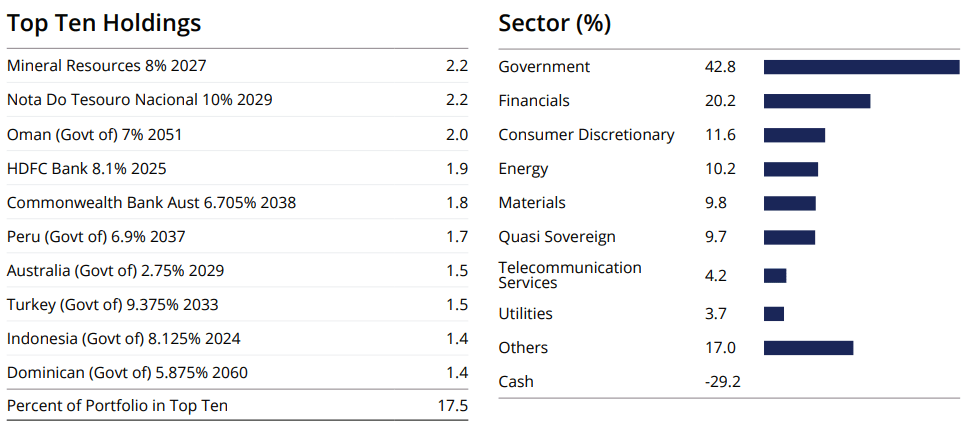
The consumer discretionary sector is by far the largest component of the ACP portfolio, followed by financials, materials, energy and telecommunications capping the top five. FCO has a similar proportion of the portfolio concentrated in the top 10 holdings, but in its case, over 40% of the portfolio is comprised of government issuances.
We can see several examples of their government holdings in the top 10 names. Financials, consumer discretionary, energy, materials and quasi sovereign holdings are the remaining sectors that make their presence felt in the FCO portfolio. While we are currently fans of fixed income, neither of the funds have a sector composition that we would bet our money on. ACP is heavily into the consumer discretionary sector, which in our opinion is one of the worst sectors to be in the current environment. FCO, on the face of it, has the benefit of having a bulk of its portfolio in government and quasi sovereign issuances. But based on a glance at the top 10 holdings, these governments do not enjoy good credit ratings. Neither fund is a winner in our opinion, and we call it a tie.
Maturity Profile and Interest Rate Risk
Most of ACP's securities mature in five years or less, with almost all the balance maturing in under 10 years.
ACP Factsheet - July 31
While close to three quarters of the FCO portfolio also matures in under ten years, the remaining maturities are staggered all the way up to 30 plus years.
FCO Factsheet-July 31
The difference between the maturity profile of the two is reflected by the difference in modified duration. ACP's last published modified duration was 3.29 years , whereas FCO had this number at 4.35 years . The duration risk is indicative of the extent to which the portfolio value would decline in the event of a 100 basis point increase in applicable risk-free rates, and vice versa. While neither of the funds have a significant duration, ACP comes out ahead as it is comparatively shorter. We would still not be in a hurry to declare ACP the winner due to the poorer credit quality of its portfolio. Weighing the two durations against our expectation of a recession and widening of credit spreads, we give an edge to FCO here.
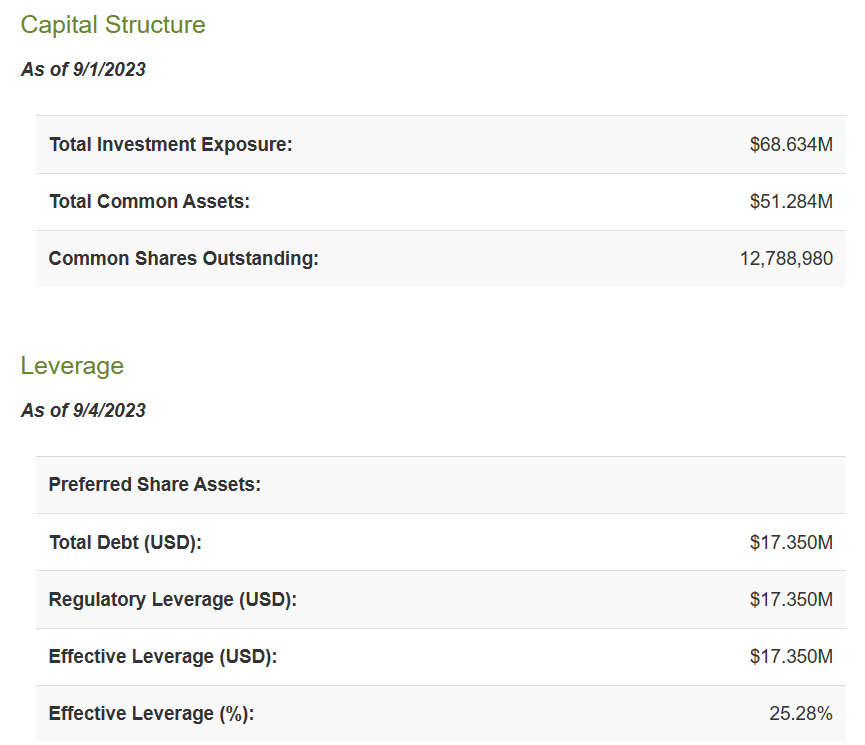
Leverage and Expenses
ACP, like several closed funds out there, employs leverage to magnify returns. This strategy works when the cost of borrowing is less than the earnings potential from investments. We all know that is not the world we are currently living in. Close to 30% of this fund's total assets are purchased with borrowed funds.
$45 million of this leverage is in the form of 5.25% yielding preferred shares, with the balance from a revolving credit facility. The credit facility contributed 2.27% to the fund's annualized expense ratio, as noted on ACP's financial statements for the six months ended April 30, 2023 ( emphasis ours ).
The annualized net operating expense ratio, excluding fee waivers based on the six-month period ended April 30, 2023 was 4.85%. The annualized net operating expense ratio net of fee waivers based on the six-month period ended April 30, 2023 was 4.60% . The annualized net operating expenses, net of fee waivers and ex cluding interest expense based on the six-month period ended April 30, 2023, was 2.33% .
Source: Semi Annual Financial Report (emphasis ours)
The average interest rate on the credit facility for the six-month period referenced above was 5.82% and the average balance was $87 million. The loan balance as at April 30 was $105 million. Taking the higher period ending loan balance, and the higher average rates after April 30, we expect the actual annual expense ratio for the 2023 fiscal year to surpass the annualized numbers from the semi-annual report.
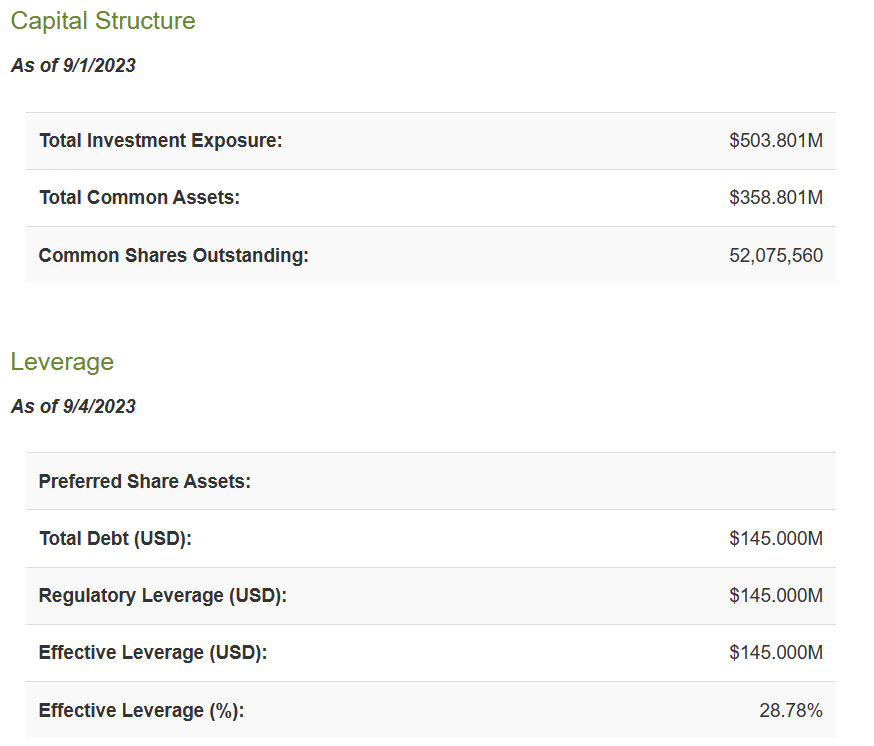
FCO, is by far the smaller of the two and also has a slightly lower leverage, with around 25% of its total assets being purchased with borrowed funds.
All of the borrowings in FCO's case are from a revolving credit facility, the average rate for which was 5.48% for the six months ended April 30, 2023. The credit facility contributed 1.94% to the fund's annualized expense ratio, as noted on FCO's financial statements for the six months ended April 30, 2023 ( emphasis ours ).
The annualized net operating expense ratio, excluding fee waivers based on the six-month period ended April 30, 2023 was 4.16%. The annualized net operating expense ratio net of fee waivers based on the six-month period ended April 30, 2023 was 4.10% . The annualized net operating expenses, net of fee waivers and excluding interest expense based on the six-month period ended April 30, 2023, was 2.16 %.
Source: Semi Annual Financial Report
FCO is no exception to what ACP will experience. While its borrowings have not increased, unlike in ACP's case, there is little doubt that the actual annual expense ratio for 2023 will be higher than the annualized estimate in the semi-annual statements. For one, the 5.48% was an average for the time period November 1, 2022 to April 30, 2023, which is lower than what the average will be taking the whole year, up to October 31, 2023, into account,
Just going by raw numbers, FCO comes out ahead in this category. But keep in mind that we are comparing very bad and extremely bad expense ratios here.
Verdict
ACP leads FCO in terms of total return on NAV over the last decade.
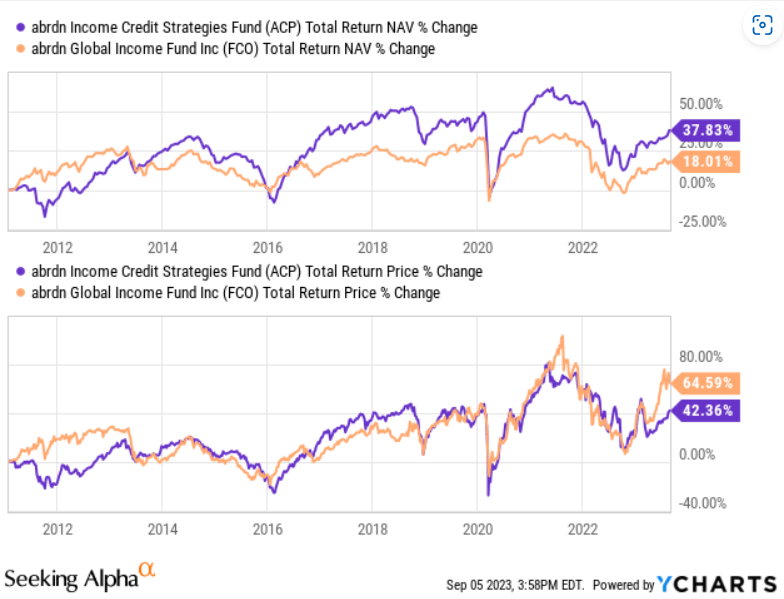
While for most of the period, both the funds tracked each other quite closely in terms of total return on price, FCO has broken away in recent times. That is explained by the lunacy in its market valuation. That 46.3% premium to NAV is one of the quirkiest anomalies we have seen in recent history.
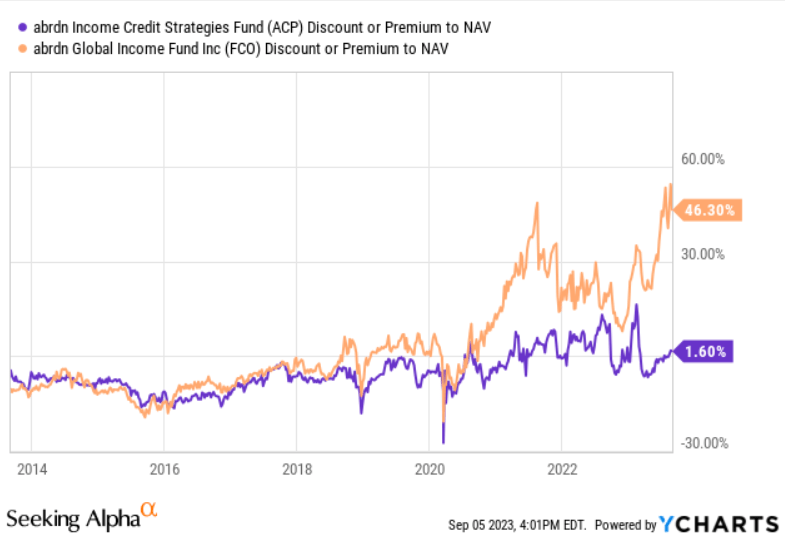
In both their cases, unitholder capital is being returned to them in the guise of juicy distributions, evident in their ongoing NAV depletion.
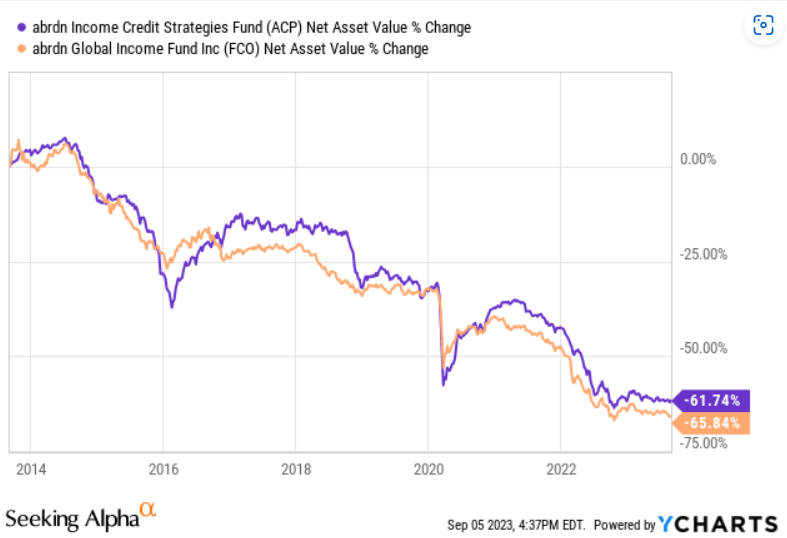
Neither fund is remotely worth holding here. With these expense ratios, total return on NAV is likely to be 1-2% annually, in the best case. Neither distribution is coming close to being earned. Investors will not make a lot of money in either. If credit spreads blow-up as we expect, losses in both funds should be substantial.
In FCO's case, staunch supporters will have the added joy of an even higher capital loss when the 50% premium bubble pops and the collective crowd realizes that this emperor indeed has no clothes. We rate ACP a Sell and FCO a Strong Sell.
Please note that this is not financial advice. It may seem like it, sound like it, but surprisingly, it is not. Investors are expected to do their own due diligence and consult with a professional who knows their objectives and constraints.
For further details see:
ACP Vs. FCO: Comparing Abrdn's 14% And 17% Yielding Credit Funds