AFGC - American Financial Group: High Yield Without Compromising On Total Returns?
2023-12-18 08:10:01 ET
Summary
- American Financial Group operates in niche insurance markets and is well diversified through its different sub-segments.
- Net earned premiums and the investment portfolio grew at a rate of over 6% over the past decade and there is no sign that this growth rate will slow down.
- AFG's balance sheet and investment portfolio composition look healthy. Net debt stands at only 0.5x core earnings.
- I estimate that AFG should be able to generate around 12% long-term returns through a combination of payouts and growth.
- Using three different valuation approaches, I estimated AFG's fair value at $137 per share, indicating that AFG stock might be undervalued.
Introduction
A couple of months ago, I wrote a series of articles covering some of the largest health insurance companies in the United States: Humana ( HUM ), UnitedHealth ( UNH ), Cigna Group ( CI ) and Elevance Health ( ELV ). As I became familiar with insurance operations while studying these companies, I want to diversify my coverage of insurance companies with this article on American Financial Group ( AFG ). I only stumbled across AFG this June when fellow SA contributor Alexander Steinberg wrote about it in this article . After reading a couple more articles and looking at the investor relations website, AFG has been on my watchlist for the past few months. I want to use this article (and the research it takes to write it) to become more familiar with the company and share my thoughts with you.
Business Overview
For an initial overview, let me cite from AFG's most recent 10-K filing:
Subsequent to the sale of its annuity operations, AFG reports its operations as two segments: (i) Property and casualty insurance (“P&C”) and (ii) Other, which includes holding company costs and income and expenses related to the managed investment entities (“MIEs”).
Source: AFG FY2022 10-K - Page 50 (Segment Statement of Earnings)
AFG announced the sale of its annuity business for total after-tax cash proceeds of $3.5 billion on May 28, 2021 (AFG's market capitalization stands at $10 billion today so this was quite a big divesture). The proceeds were used to pay generous special dividends in FY21 ($28.06 per share) and FY22 ($14.31 per share).
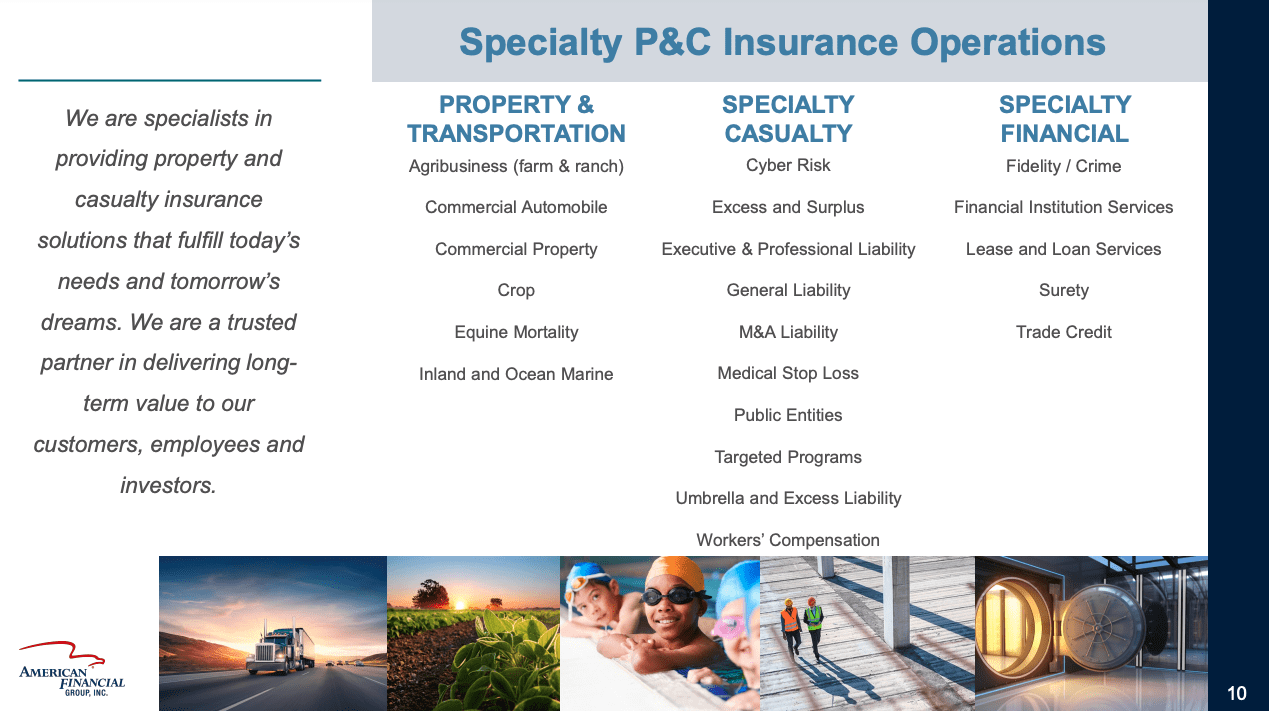
So since the "Other" segment only consists of holding company costs and expenses to MIEs, this leaves us with only one real segment which is Property and casualty insurance (P&C). Here is a slide from a recent Investor Presentation giving a quick overview of AFG's offerings in the P&C segment:
Specialty P&C Operations (BMO Capital Markets Virtual Summit Presentation - Slide 10)
So AFG divides the P&C operations into three sub-segments: (1) Property & Transportation, (2) Specialty Casualty and (3) Special Financial. Here is another chart from the same presentation to give you a better understanding of the scale and relevance of these sub-segments:
Gross Written Premiums by sub-segments (BMO Capital Markets Virtual Summit Presentation - Slide 13)
Here we can see that Specialty Financial is the smallest segment while the other two are of the same size. I will only explain some of the biggest categories since going over every offering would be a bit too much.
The agricultural business offers multi-peril crop insurance covering most perils as well as crop-hail, equine mortality and other coverages for full-time operating farms/ranches. Transportation offers coverage for vehicles such as buses and trucks, alternative risk transfer programs (tailored solutions for customers that don't want to insure 100% of risks) and other specialty transportation niches.
Excess & Surplus offers coverage for unique, volatile and hard-to-place risks like construction or roofing. Workers' Compensation offers coverage for benefits payable to employees who get injured on the job (in Germany we call this "Berufsgenossenschaft", just in case I may have any German readers).
So in conclusion, AFG operates in what you might call niche markets. Additionally, AFG's insurance operations are very well diversified on the smaller, sub-segment scale.
How does AFG generate profits?
I will spend most of my effort on this section because I think it is the most important one. I will start by giving a superficial overview before diving deeper into this question in the next two sub-sections. AFG generates profits from two sources: (1) Underwriting and (2) Net Investment Income. They are intertwined in several ways.
(1) Underwriting: When AFG signs an insurance contract with a customer, the customer pays AFG a premium. This payment is made upfront. Premiums are accounted for as revenue (also called net earned premiums, more on that later) in the income statement or unearned premiums on the liability side of the balance sheet. Simultaneously, AFG accounts for expected claims (Loss & LAE) out of these contracts on the liability side of the balance sheet. If we were to compare this to an industrial company, net earned premiums minus Loss & LAE would be something like gross profit. If we deduct operating expenditures (OPEX) from this equation, it would look something like this:
Revenue (or net earned premiums) - Loss & LAE - OPEX (or underwriting expenses) = Underwriting profit/loss
In conclusion, we always want net earned premiums to be higher than the combination of Loss & LAE and underwriting expenses. So Key Performance Indicators (KPIs) for Underwriting are (1) Gross written premiums, (2) net earned premiums and (3) the combined ratio (= (Loss & LAE + Underwriting Expenses) divided by net earned premiums).
(2) Net Investment Income: Any time AFG generates a profit in underwriting, this means that they are effectively borrowing money from their customers at a negative rate. The amount of cash that the insurer has available for the time between the payment of the premium and the outflow for the settlement of the claims is also called "float". AFG invests this money in the meantime and generates additional investment income. All of this investment income is 100% attributable to AFG. KPIs for this part of earnings are (1) Investment Portfolio Size and (2) Investment Portfolio Yield.
Underwriting
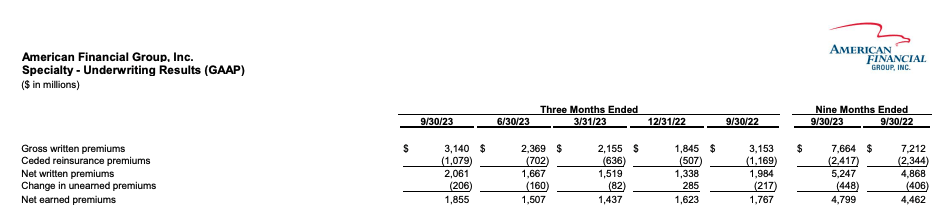
Let us start with accounting and the difference between the types of premiums AFG reports in their financial statements. There are three reported premium numbers: Gross written premiums ((GWP)), Net written premiums ((NWP)) and Net earned premiums ((NEP)), as can be seen in the following screenshot from a slide of AFG's most recent Q3 2023 Investor Supplement:
Types of Premiums (AFG Q3 2023 Investor Supplement - Page 7 )
GWP describes the absolute number of premiums AFG signed with customers in the given period. AFG reinsures part of these premiums, giving some of these premiums away in exchange for the promise of the reinsurer to take over some of the future claims/losses. Then, the resulting NWP are adjusted for "change in unearned premiums". This comes back to the accounting I mentioned earlier. If AFG signs an insurance contract in March and this contract has a duration of one year, only 10 months (March-December) will be accounted for as revenue while 2 months (January and February of the following year) will be accounted for as unearned premiums (a liability). In January and February of the following year, these unearned premiums will be accounted for as revenue while the liability disappears. I will discard NWP and only focus on GWP and NEP.
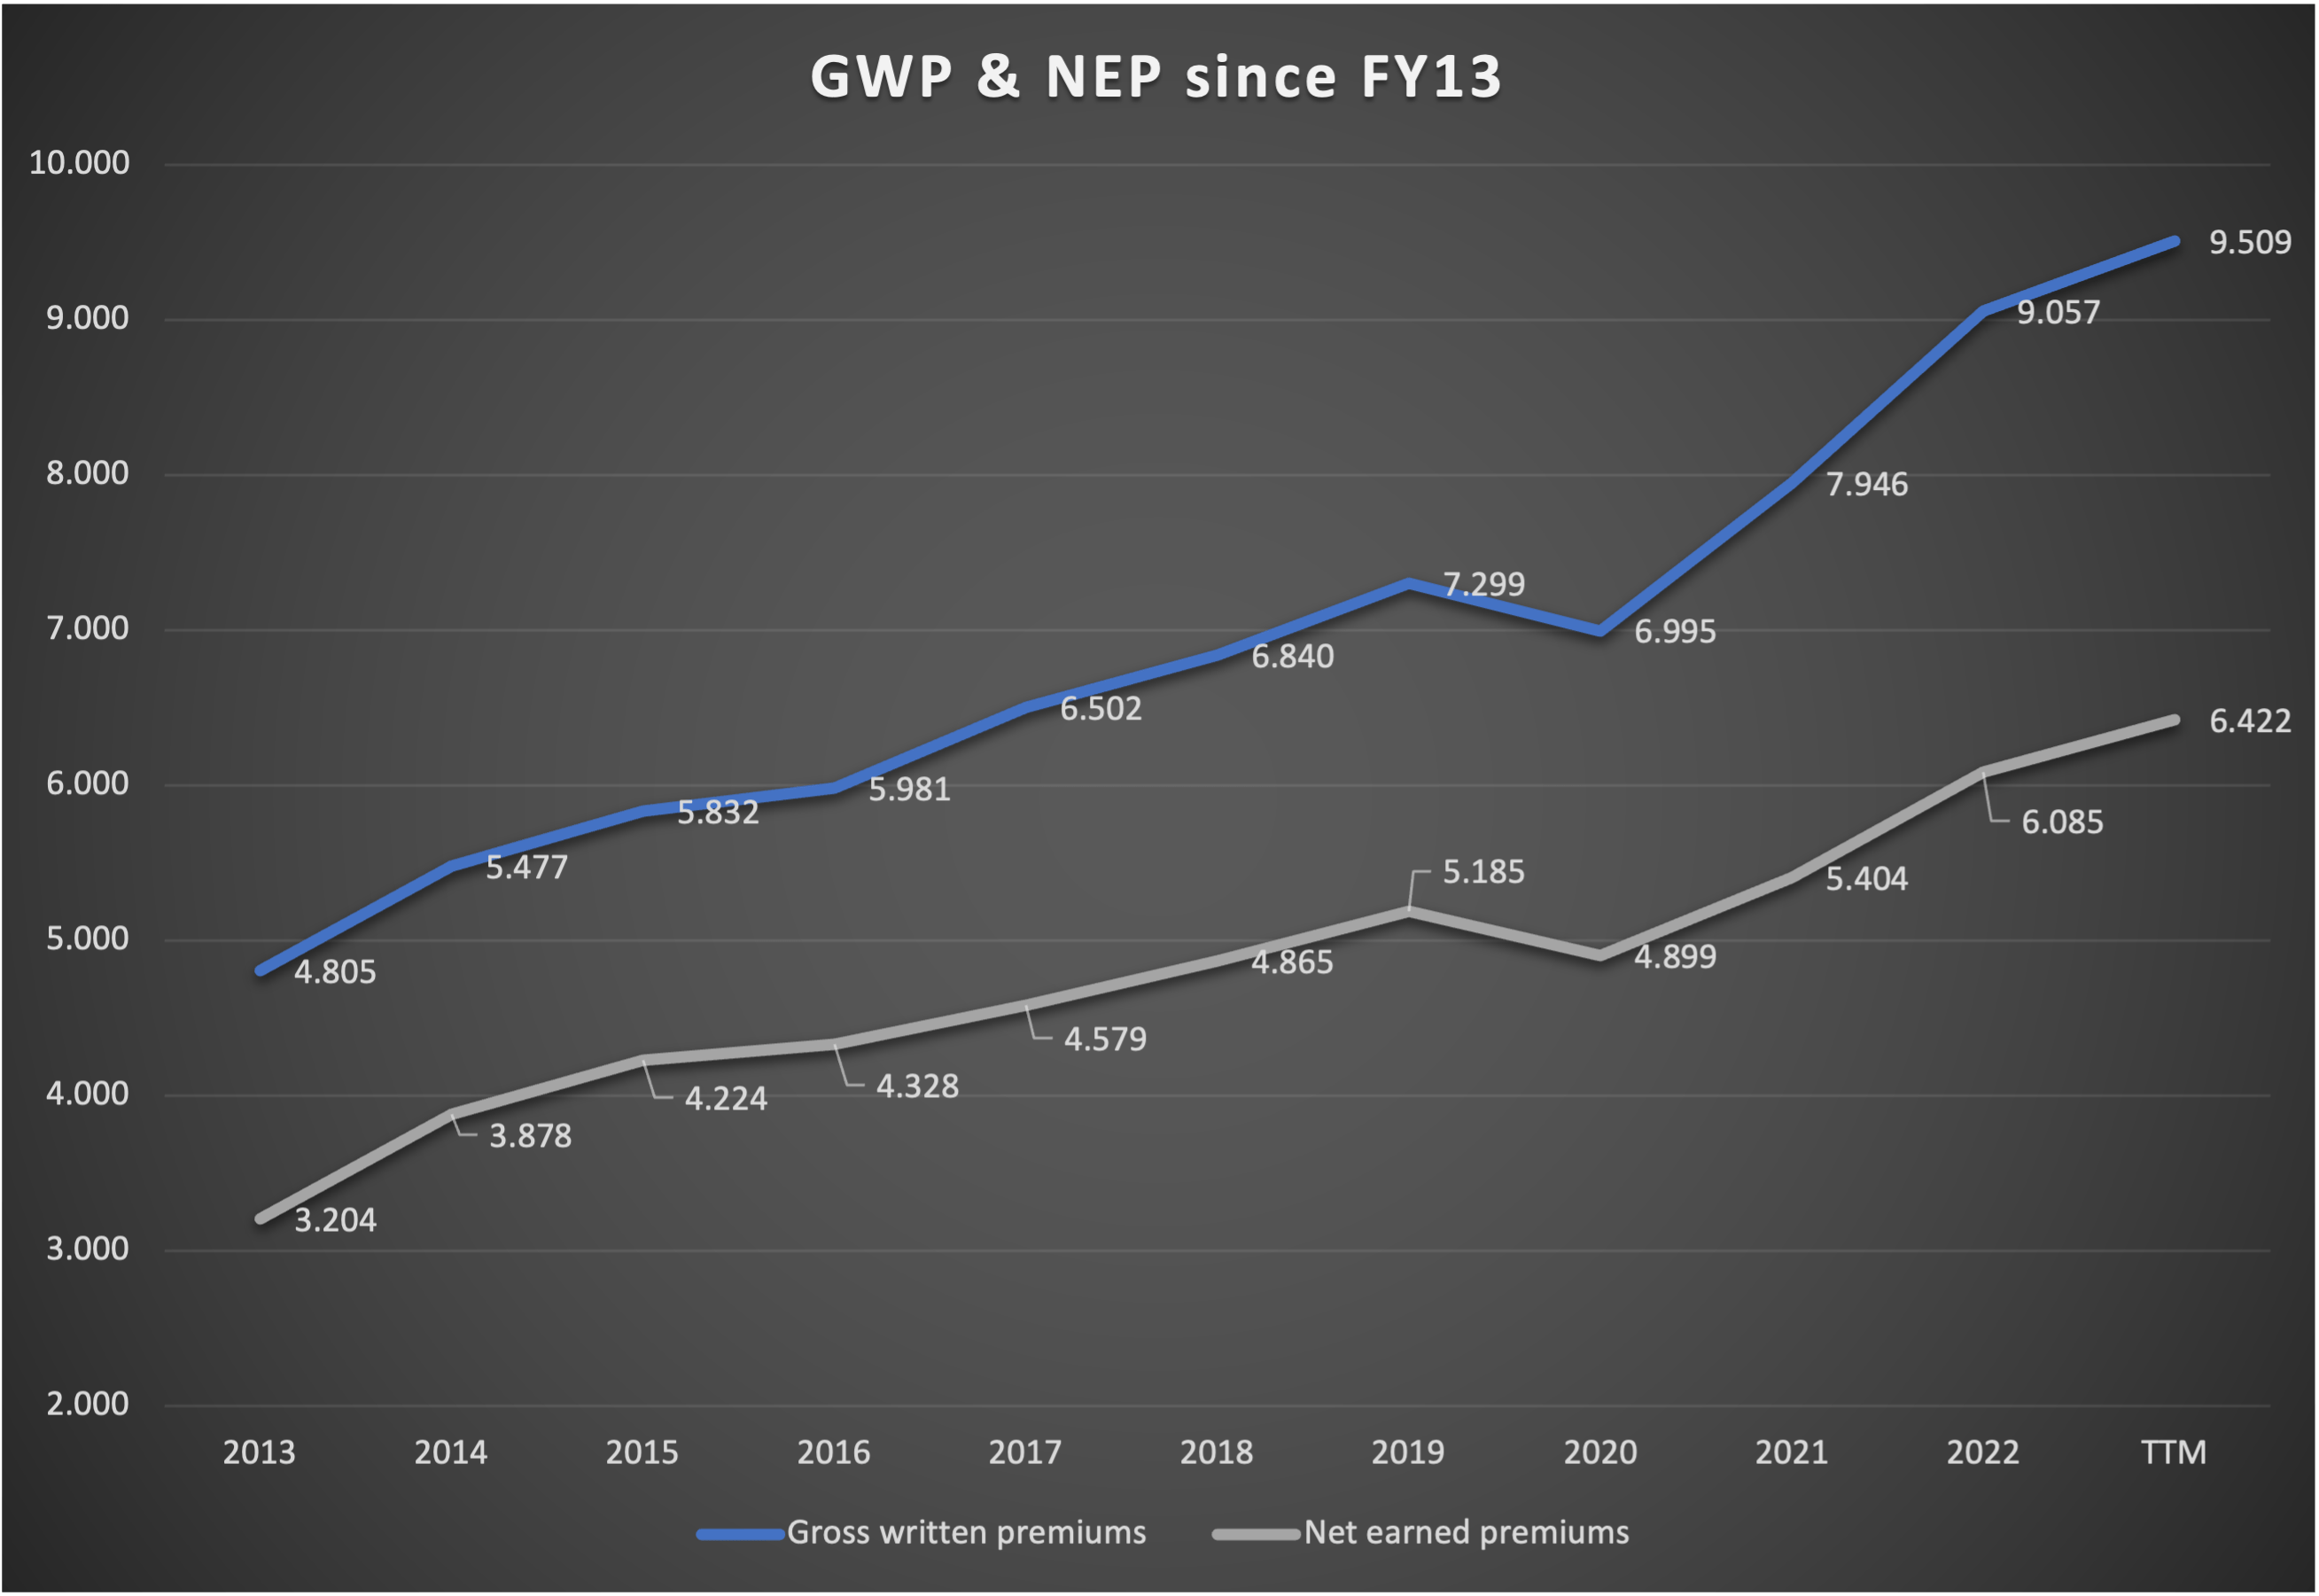
Let's start by taking a look at the development of GWP and NEP over the last decade (numbers in ):
GWP & NEP since FY13 (Company Reports - compiled by Author)
We can see that premiums have grown in every single year except FY20 due to the pandemic. We can also see that the growth of premiums accelerated over the past 2-3 years as a catch-up effect from the pandemic and due to higher inflation (= higher price increases). The longer-term growth rates are very stable. GWP grew with a CAGR of 7.3% since FY13 and 6.85% since FY17 while NEP grew with a CAGR of 7.39% since FY13 and 5.85% since FY17.
Premium growth will always be a combination of three factors: (1) Price increases, (2) the addition of new customers and (3) the retention rate of existing customers. I won't go into any further detail here because I lack the data and I don't think that it is that important.
So two of the KPIs seem to be in good shape with a steady mid-to-high single-digit growth rate. Now let's take a look at the third KPI that I mentioned which is the combined ratio. The combined ratio is something like the EBIT margin for the underwriting. I will repeat it here for clarity:
| "Industrial Company" |
| American Financial Group |
| Revenue |
| Net earned premiums |
| - costs of sales |
| - Loss & LAE |
| = Gross Profit |
| = Gross Profit equivalent |
| - OPEX |
| - Underwriting Expenses |
| = EBIT |
| = Underwriting Profit/Loss |
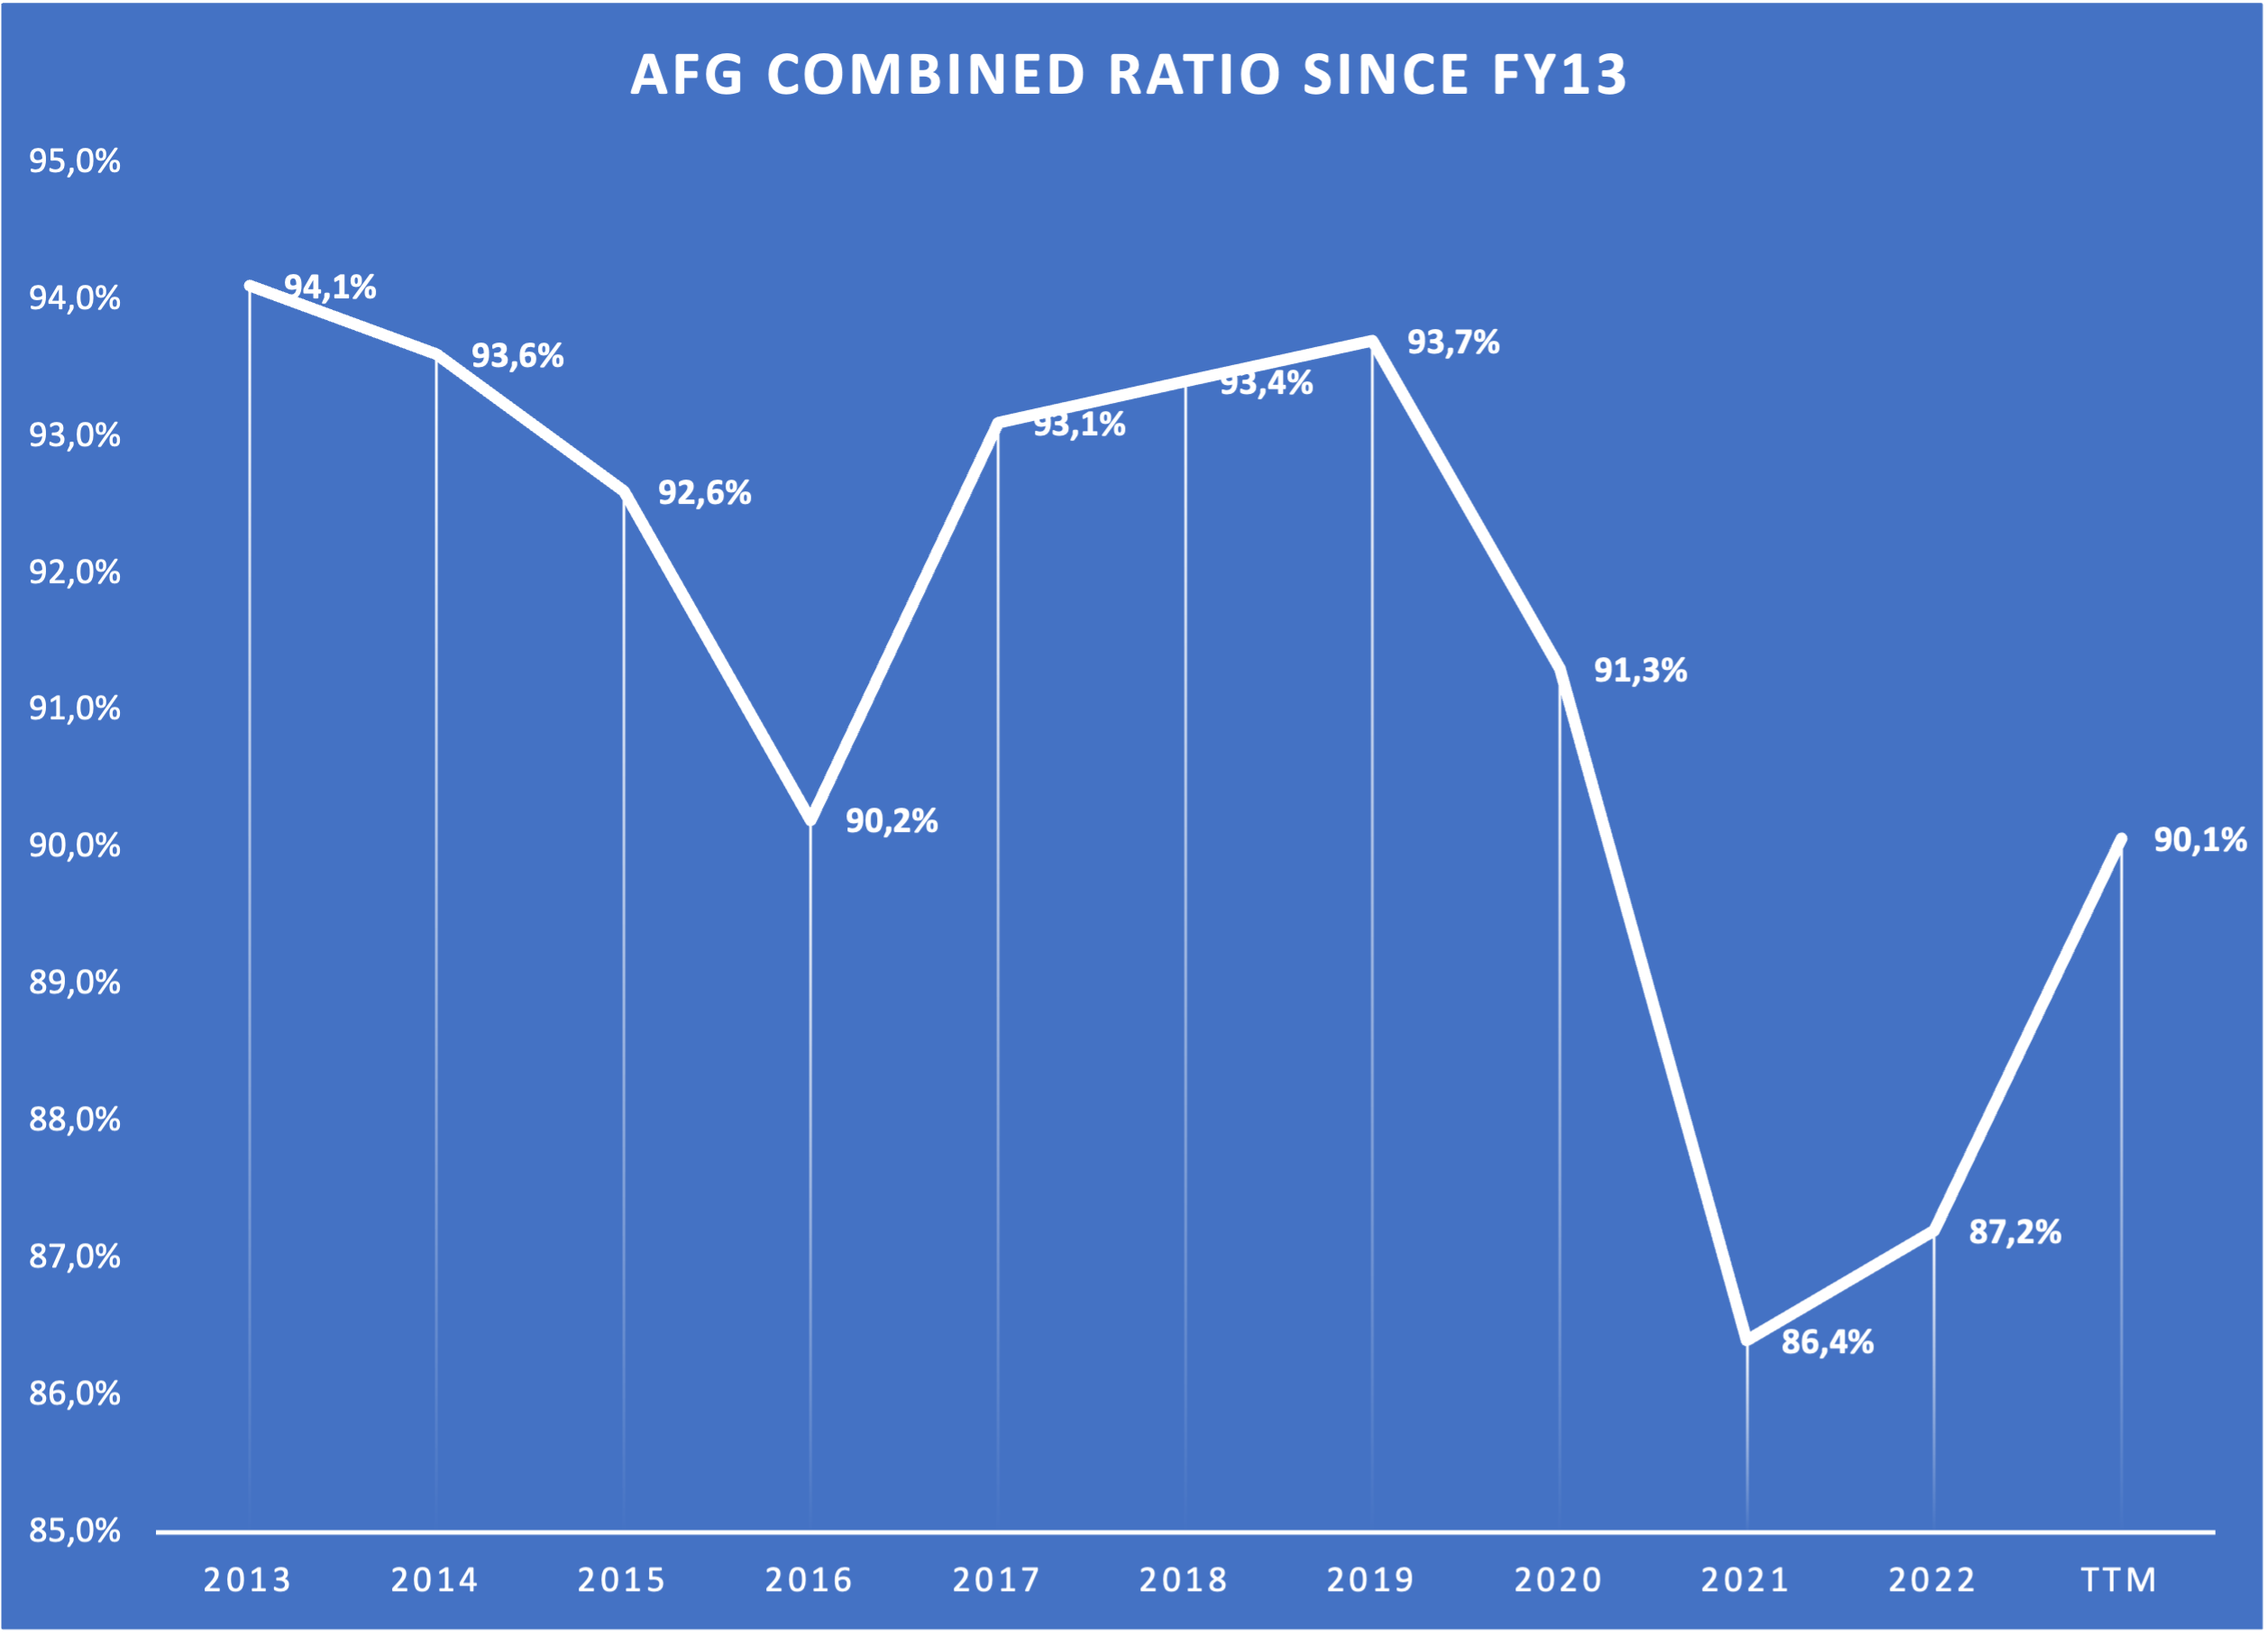
This is a very loose comparison but it does the job of making clear how the reporting of underwriting results works. The combined ratio describes the percentage of Loss & LAE + Underwriting Expense to the Net earned premiums, so it is the inverse value of the Underwriting/EBIT margin. If the underwriting margin is 10%, the combined ratio is 90%. Here is an overview of AFG's combined ratio over the past decade:
AFG Combined Ratio since FY13 (Company reports - compiled by Author)
We can see that AFG's combined ratio has been below 100% every year, a very good sign because it shows us that AFG consistently generates underwriting profits and by doing that, borrows money from customers at a negative rate. We can also see that FY21 and FY22 ratios were outliers, meaning that AFG reported very high underwriting profits in these two years. We currently see a trend of normalization, with AFG guiding for a combined ratio of 91% at the midpoint for FY23, more in line with past results.
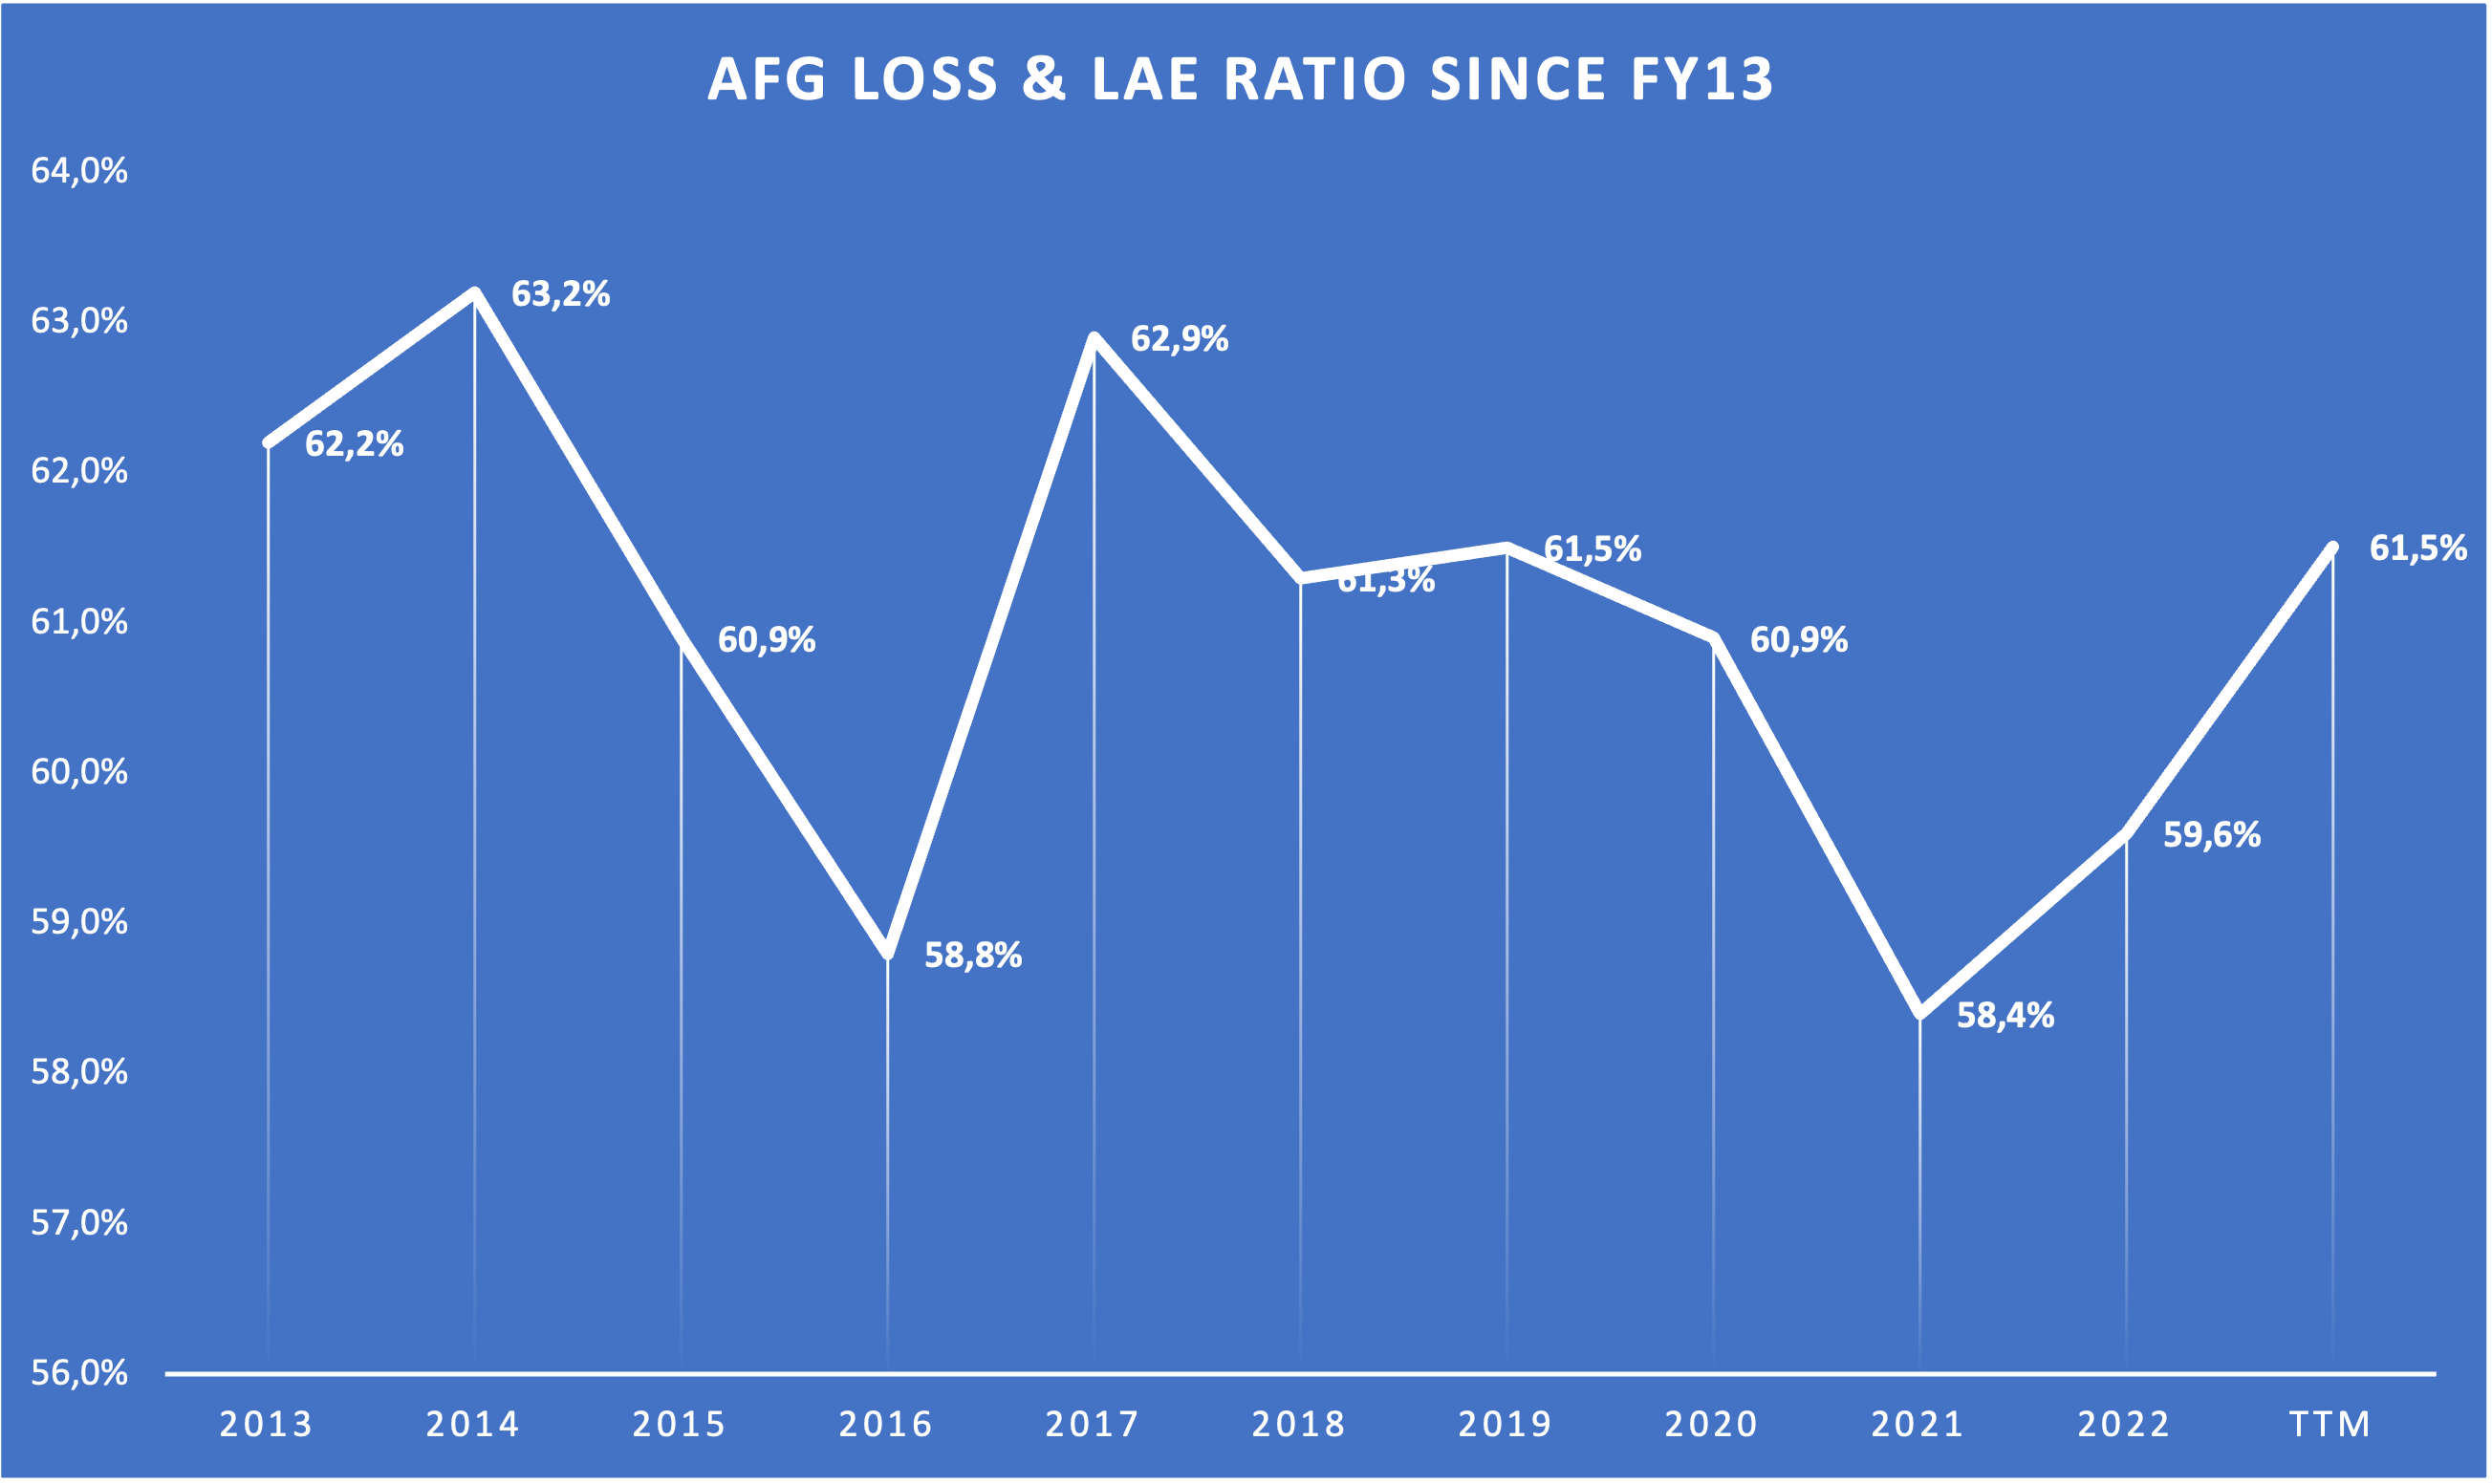
Only looking at the combined ratio isn't enough. We should also take a look at the two factors that form this ratio. Here is a chart showing the Loss & LAE ratio since FY13:
AFG Loss & LAE ratio since FY13 (Company reports - compiled by Author)
The average is 61.0% and the median is 61.3%. While the Loss & LAE ratio is volatile, it seems to be overall stable in the long term. The TTM number of 61.5% is a little bit higher than the average/medium for the past decade. A stable Loss & LAE ratio is a sign of underwriting prowess, another good sign.
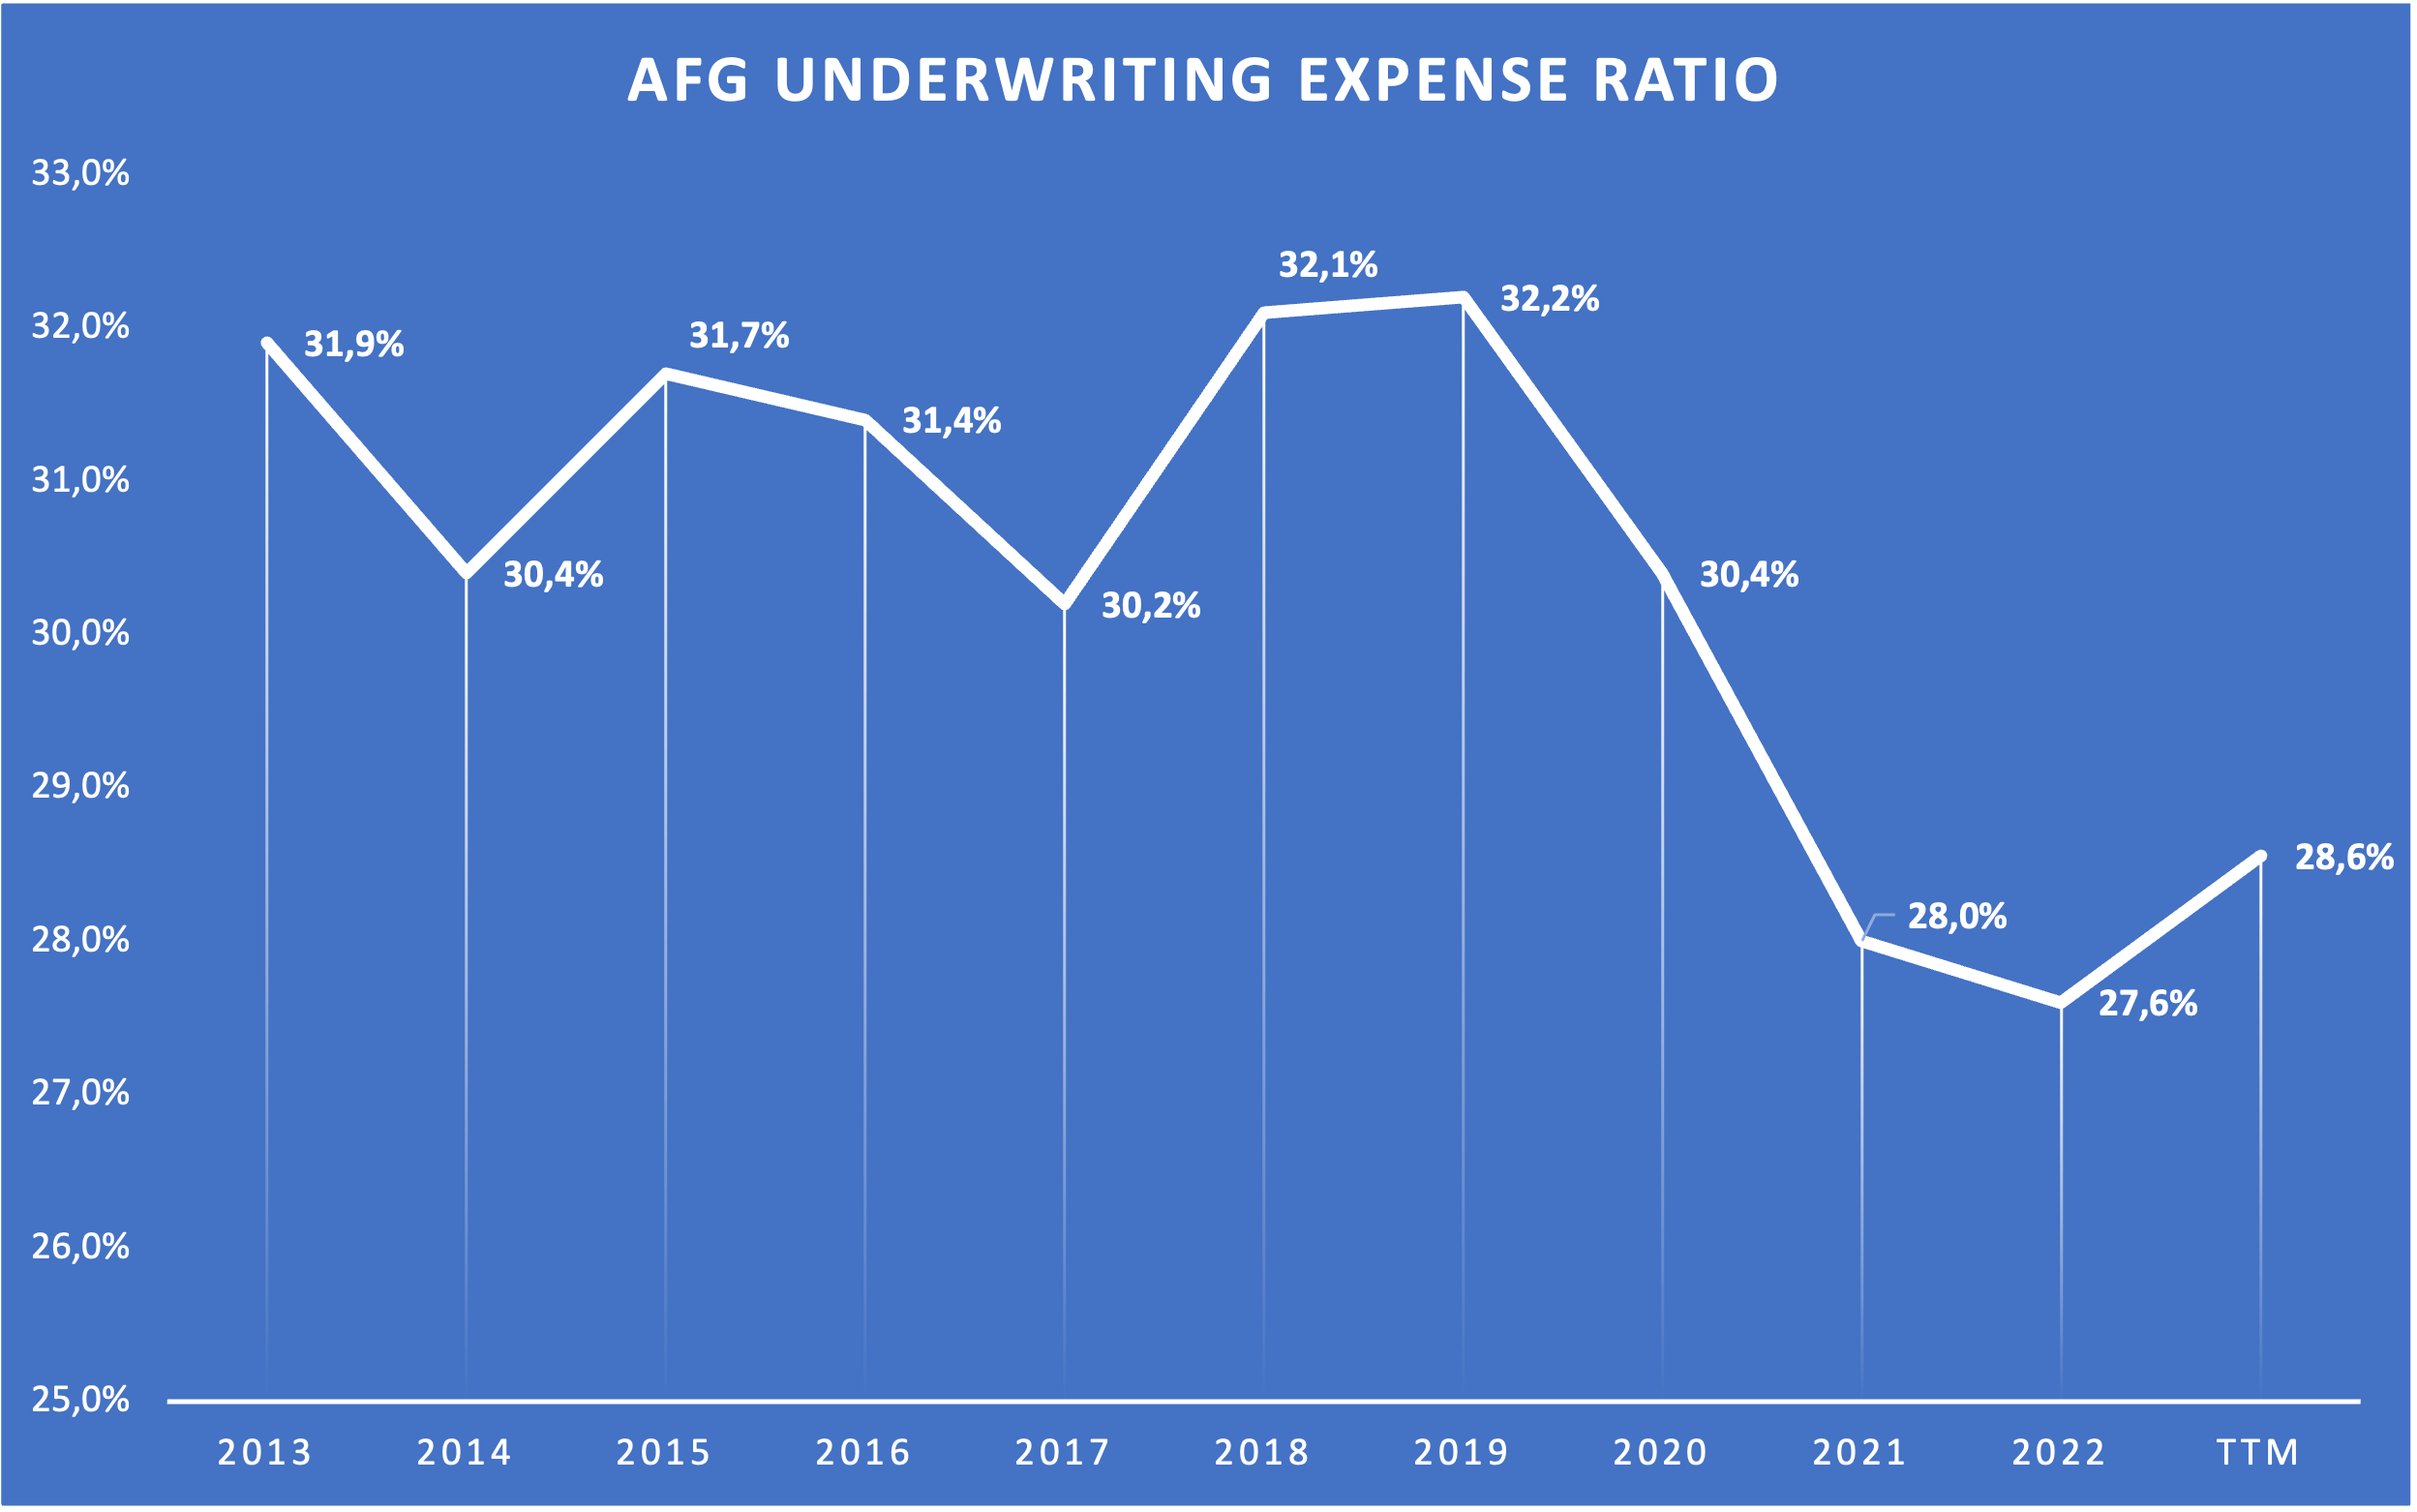
Here is another chart showing the underwriting expense ratio:
AFG Underwriting Expense ratio since F13 (Company reports - compiled by Author)
This is where it gets interesting. We have seen that AFG reported exceptionally good combined ratios in FY21 and FY22. Here we can see that the main reason for this was declining underwriting expenses. As I said earlier, we are currently seeing a normalization of the combined ratio with AFG guiding for 91% at the midpoint. Sadly I don't know if that 91% guidance assumes a rise in Loss & LAE or underwriting expenses. This will be interesting to see in the Q4 23 earnings report. However, even in the current trend toward normalization of the combined ratio, the underwriting expense ratio is still at a low level compared to the past. This could mean two things: (1) AFG achieved some operating leverage over the past few years or (2) we will see a rise in the underwriting expense ratio in the next few quarters/years. I think the truth lies something in between as both statements are probably correct. Another thing that might have been a factor is the sale of the annuity business in 2021. While I can't find a reason why this could have impacted underwriting expense ratios in the P&C segment, I still think it is suspicious that the underwriting expense ratio declined in the same year the annuity business was sold and seems to stay on this lower level. This might just be a coincidence though.
To conclude this sub-chapter:
- AFG has grown GWP and NEP at around 6% over the past decade
- Premium growth has been very steady and there are no reasons to expect a deterioration of premium growth going forward
- AFG's FY23 guidance for the combined ratio is more in line with the past but still at a low level. This might be a future headwind if AFG can't keep the underwriting costs at the current level.
Net Investment Income
Now we know that AFG generates float at a negative cost due to the consistent underwriting profits. Let's look at what AFG does with this money. I will again start with some general things.
Assuming AFG's insurance contracts have a duration of one year, the investment portfolio should approximately have the size of (1) one year of net earned premiums + (2) Shareholders' equity (assuming AFG invests its equity capital as well). Again, this is a very simple way of looking at it so please don't call me out on this in the comments.
I will just use FY22 numbers to check this:
$6,085 million (Net earned premiums)
+ $4,052 million Shareholders' equity
= $10,137 million Investment Portfolio Estimate
Meanwhile, the Investment Portfolio stood at $14,512 million according to the FY22 balance sheet. The difference is around $4.4 billion So this didn't seem to work. What is the problem here?
The answer can be found in Note O of the FY22 10-K. Let me show you:
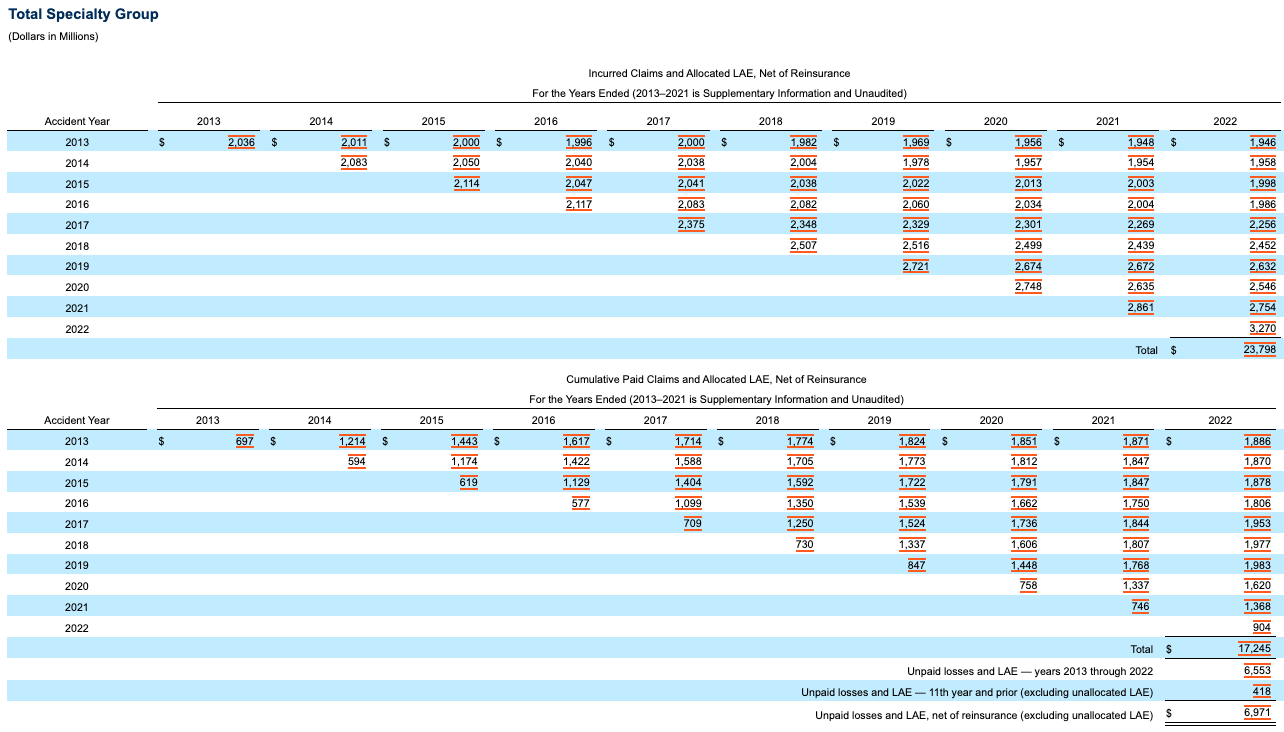
Incurred Claims vs. Cumulative Paid Claims (AFG FY22 10-K / Note O - Insurance)
This chart looks kind of intimidating but it isn't as bad as it seems. The top half shows incurred claims for the years 2013-2022 while showing the claims for every single year and the adjusted values to those claims in the following years. The bottom half shows the amount of paid claims on a cumulative basis (again for every single year). So for example we can see that at the end of FY22, there were $1,946 million incurred claims for calendar year 2013, while $1,886 million were paid for these claims throughout these years.
Now we have to look at this table while excluding the 2022 numbers:
$23,798 million Incurred claims (2013-2022)
- $3,270 million Incurred claims 2022
= $20,528 million Incurred claims (2013-2021)
$17,245 million Paid claims (2013-2022)
- $904 million Paid claims 2022
= $16,341 million Paid claims (2013-2021)
And now the result: $20,528 million - $16,341 million = $4,187 million
This means that $4.2 billion of the investment portfolio are a result of unpaid claims for "old cases". This is nearly the difference of $4.4 billion I ended up with my simplified calculation above. In conclusion, the Investment Portfolio will always be greater than NEP for one year + shareholders' equity which is a good thing because again, this is money borrowed at no cost that generates investment income for AFG.
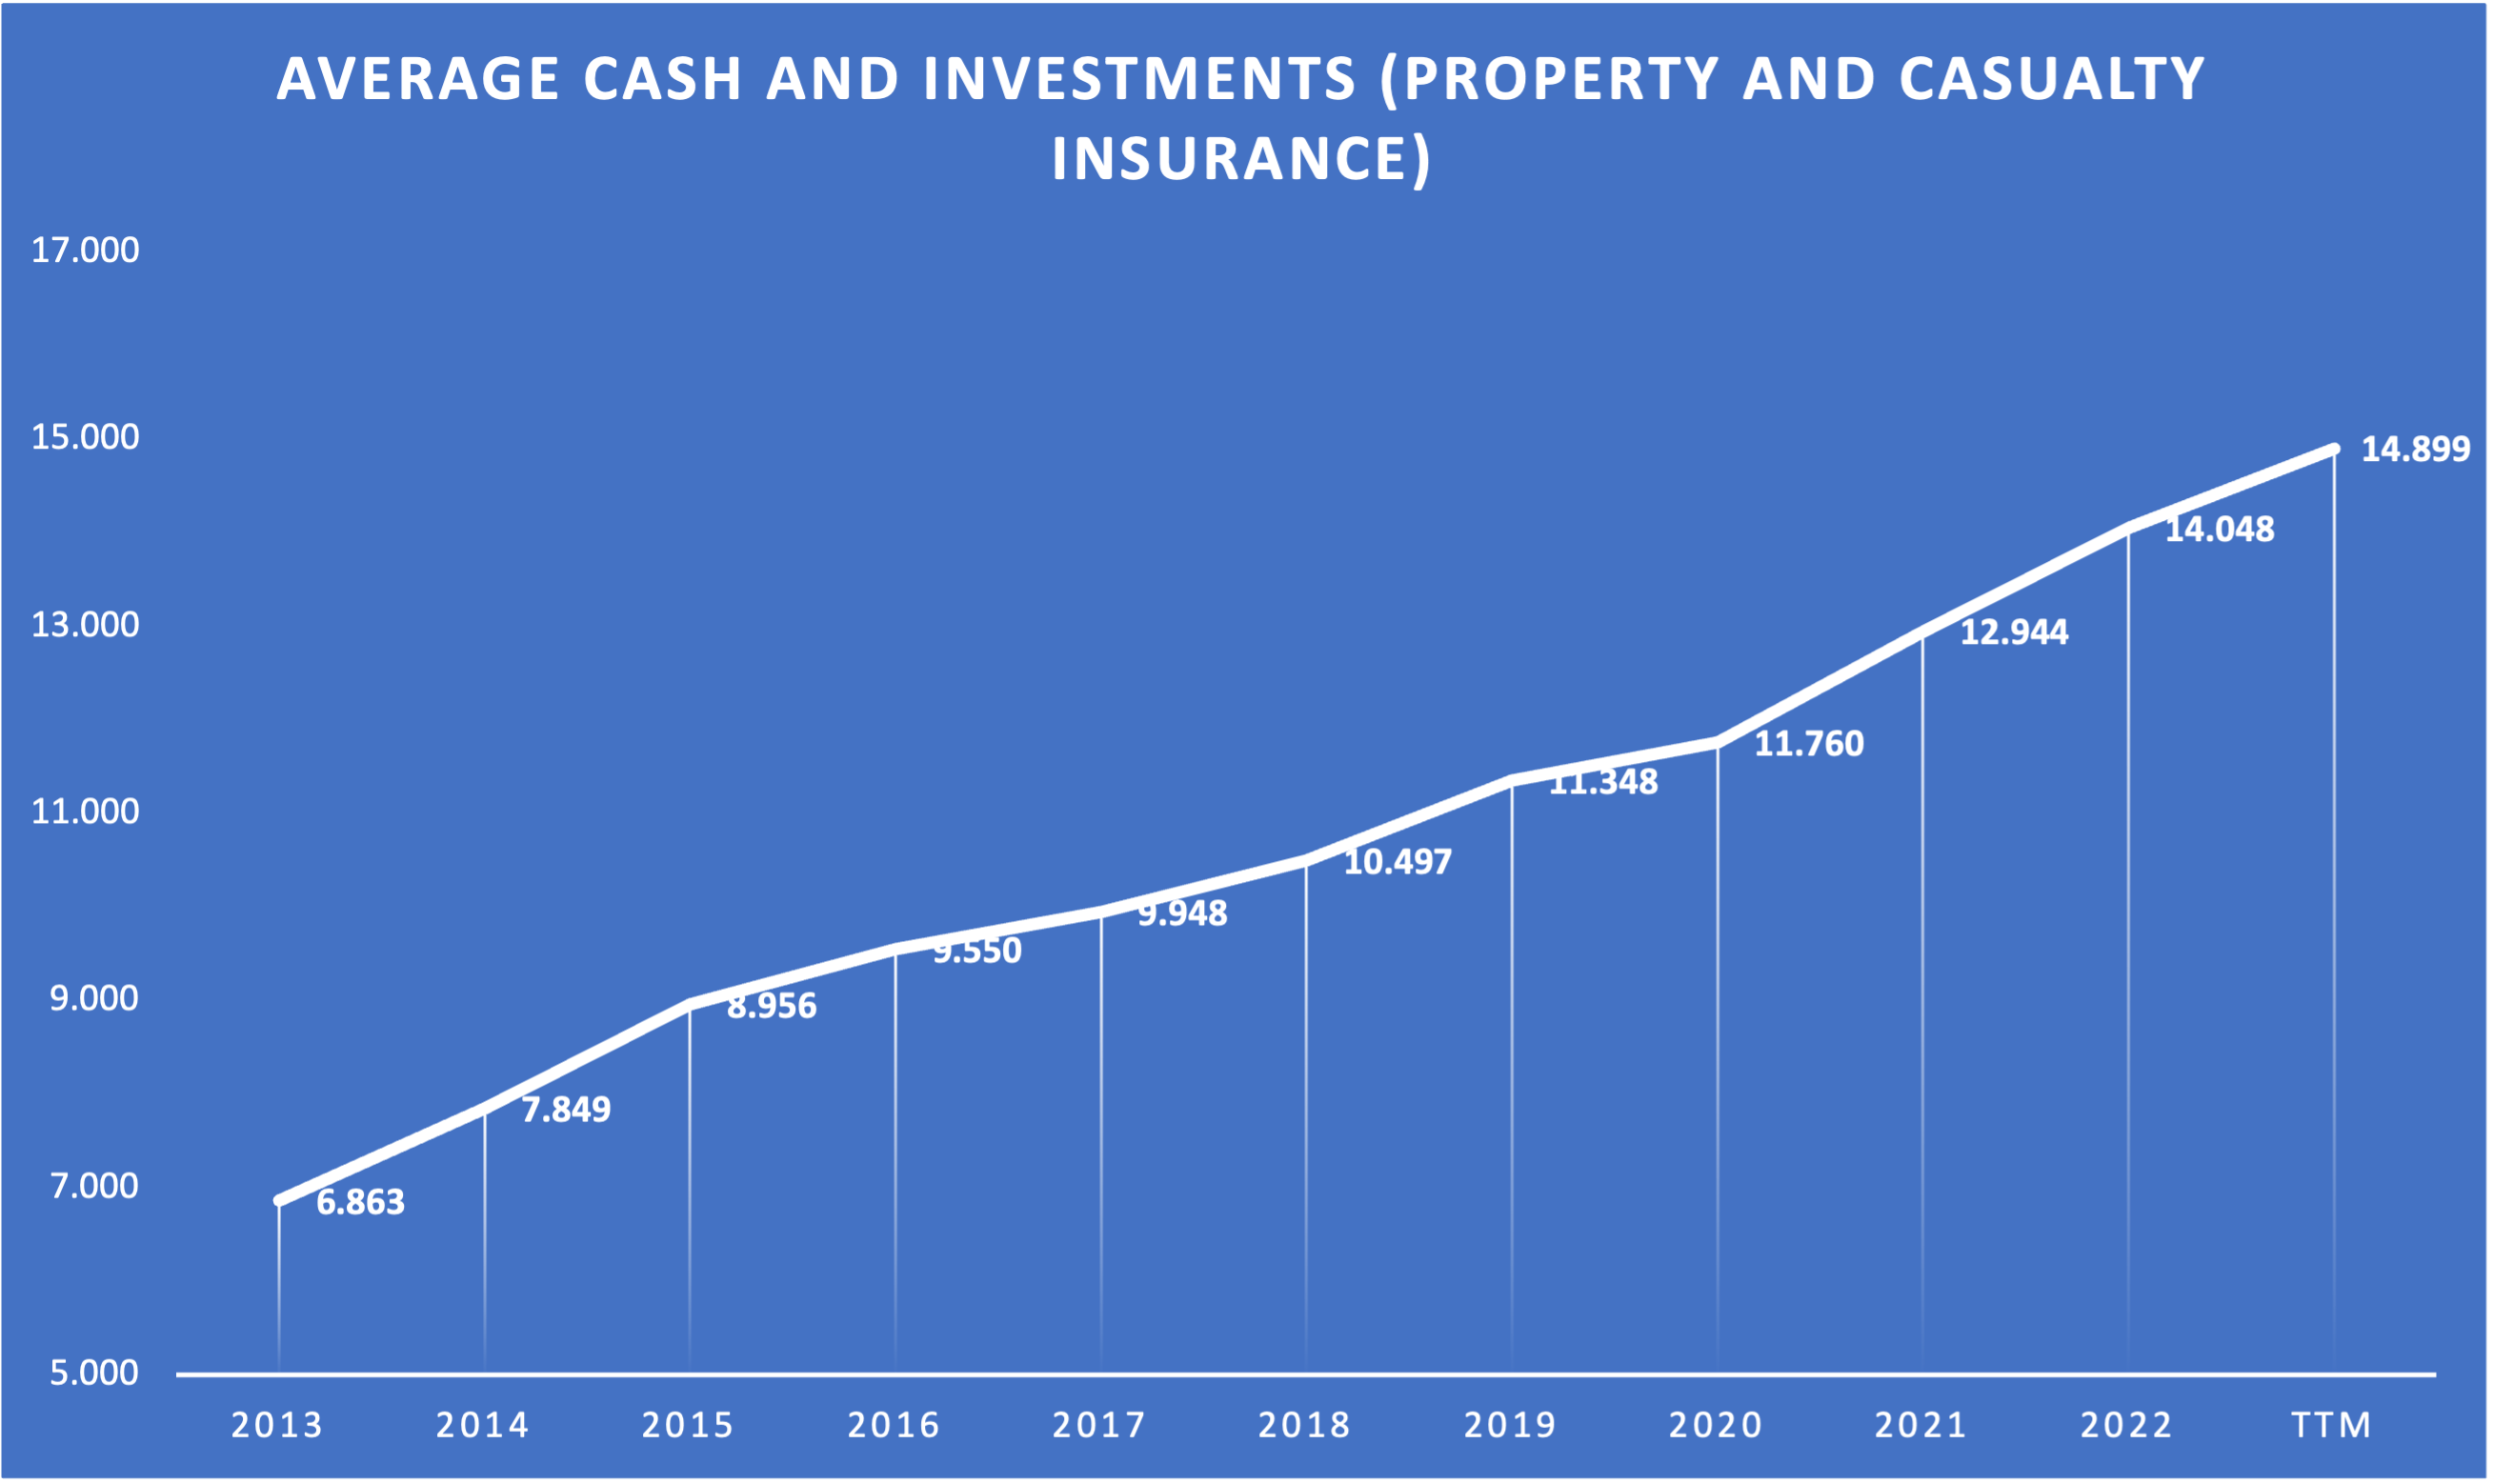
Now let's take a look at the important KPIs I laid out earlier: (1) Portfolio Size and (Portfolio Yield). Here is a chart showing the Portfolio Size throughout the years:
Investment Portfolio Size since FY13 (Company reports - compiled by Author)
AFG reports this using averages for each quarter and year. We can see the size of the Investment Portfolio has been growing steadily every single year. The growth CAGR came in at 8.28% since FY13 and 7.15% since FY17. So unsurprisingly, the portfolio grew in line with the premiums (even a bit faster). We can expect the portfolio to grow in line with premiums at around 6% going forward.
Here is the last chart for this chapter:
Investment Portfolio Yield ( Company reports - compiled by Author)
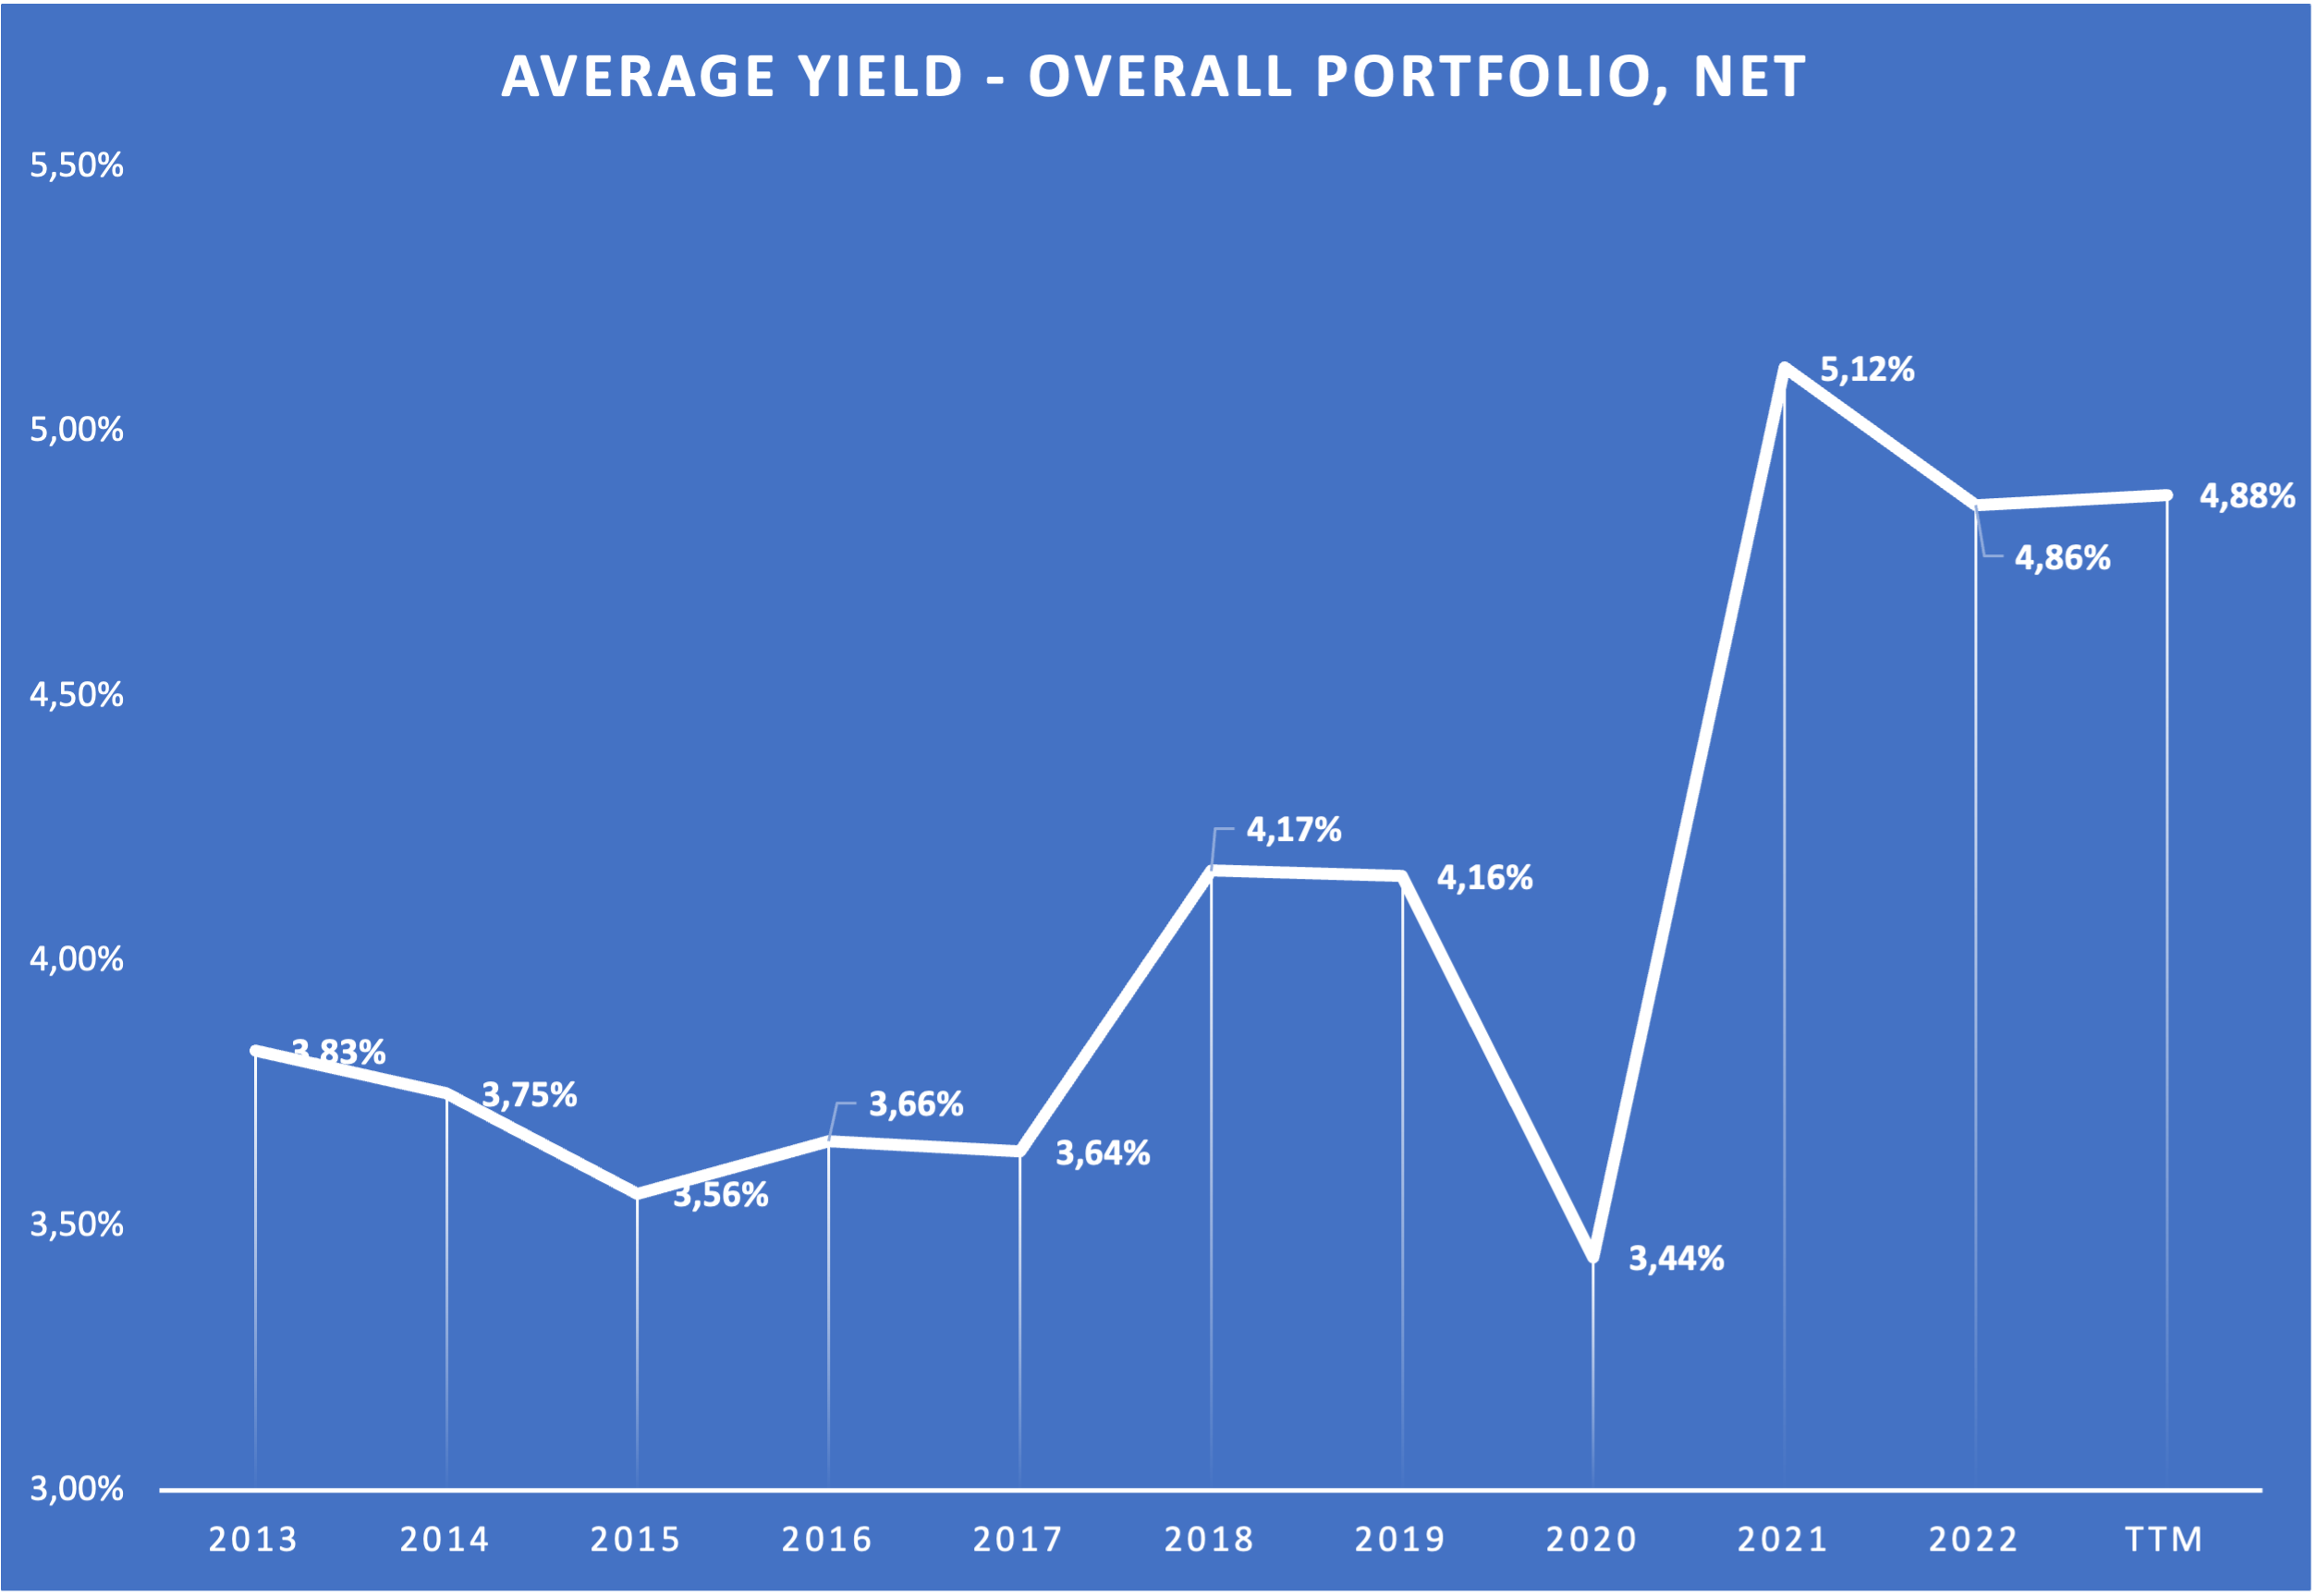
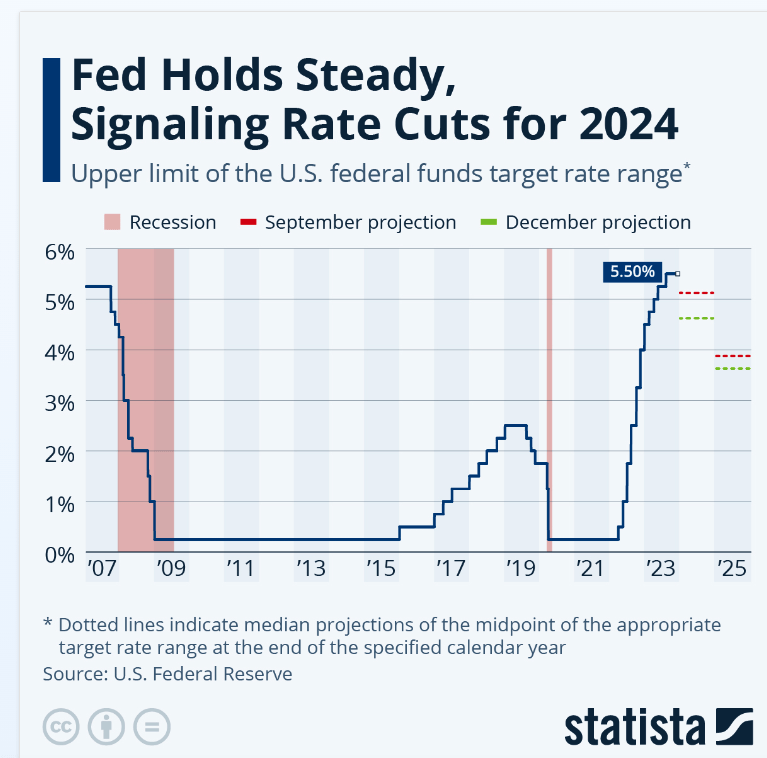
Here we can see the overall net yield of the investment portfolio. We can see that the yield has risen sharply over the past three years and a bit in FY18 and FY19. If we look at the development of the U.S. federal funds rate, we can see that AFG's portfolio yield moves in line with it:
U.S. federal funds rate (Statista)
Now this could mean two things: AFG (1) might look at higher net investment income for years to come (if rates stay elevated) or (2) might look at headwinds for the net investment income when rates start declining. I again think that it will be a combination of both. I guess that AFG will lock in higher rates as well as they can without compromising liquidity to be able to pay for incurred claims. So we might see elevated portfolio yields for at least two years. If rates were to come down, portfolio yield would ultimately come down as well. There is nothing AFG can do about it.
In the end, portfolio yield is nothing else than volatility. As long as the portfolio size keeps growing in line with premiums, a decline in the portfolio yield is a minor issue.
Financials
Let's start this chapter as I usually do, by taking a look at the most recent balance sheet:
AFG Q3 23 Balance Sheet (Q3 23 10-Q Filing)
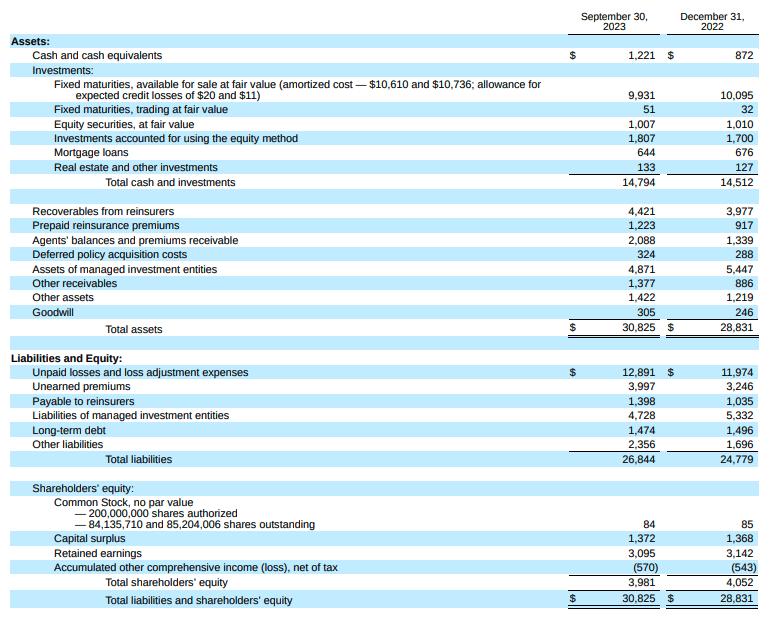
We already covered several items by now so I will focus on net debt and goodwill.
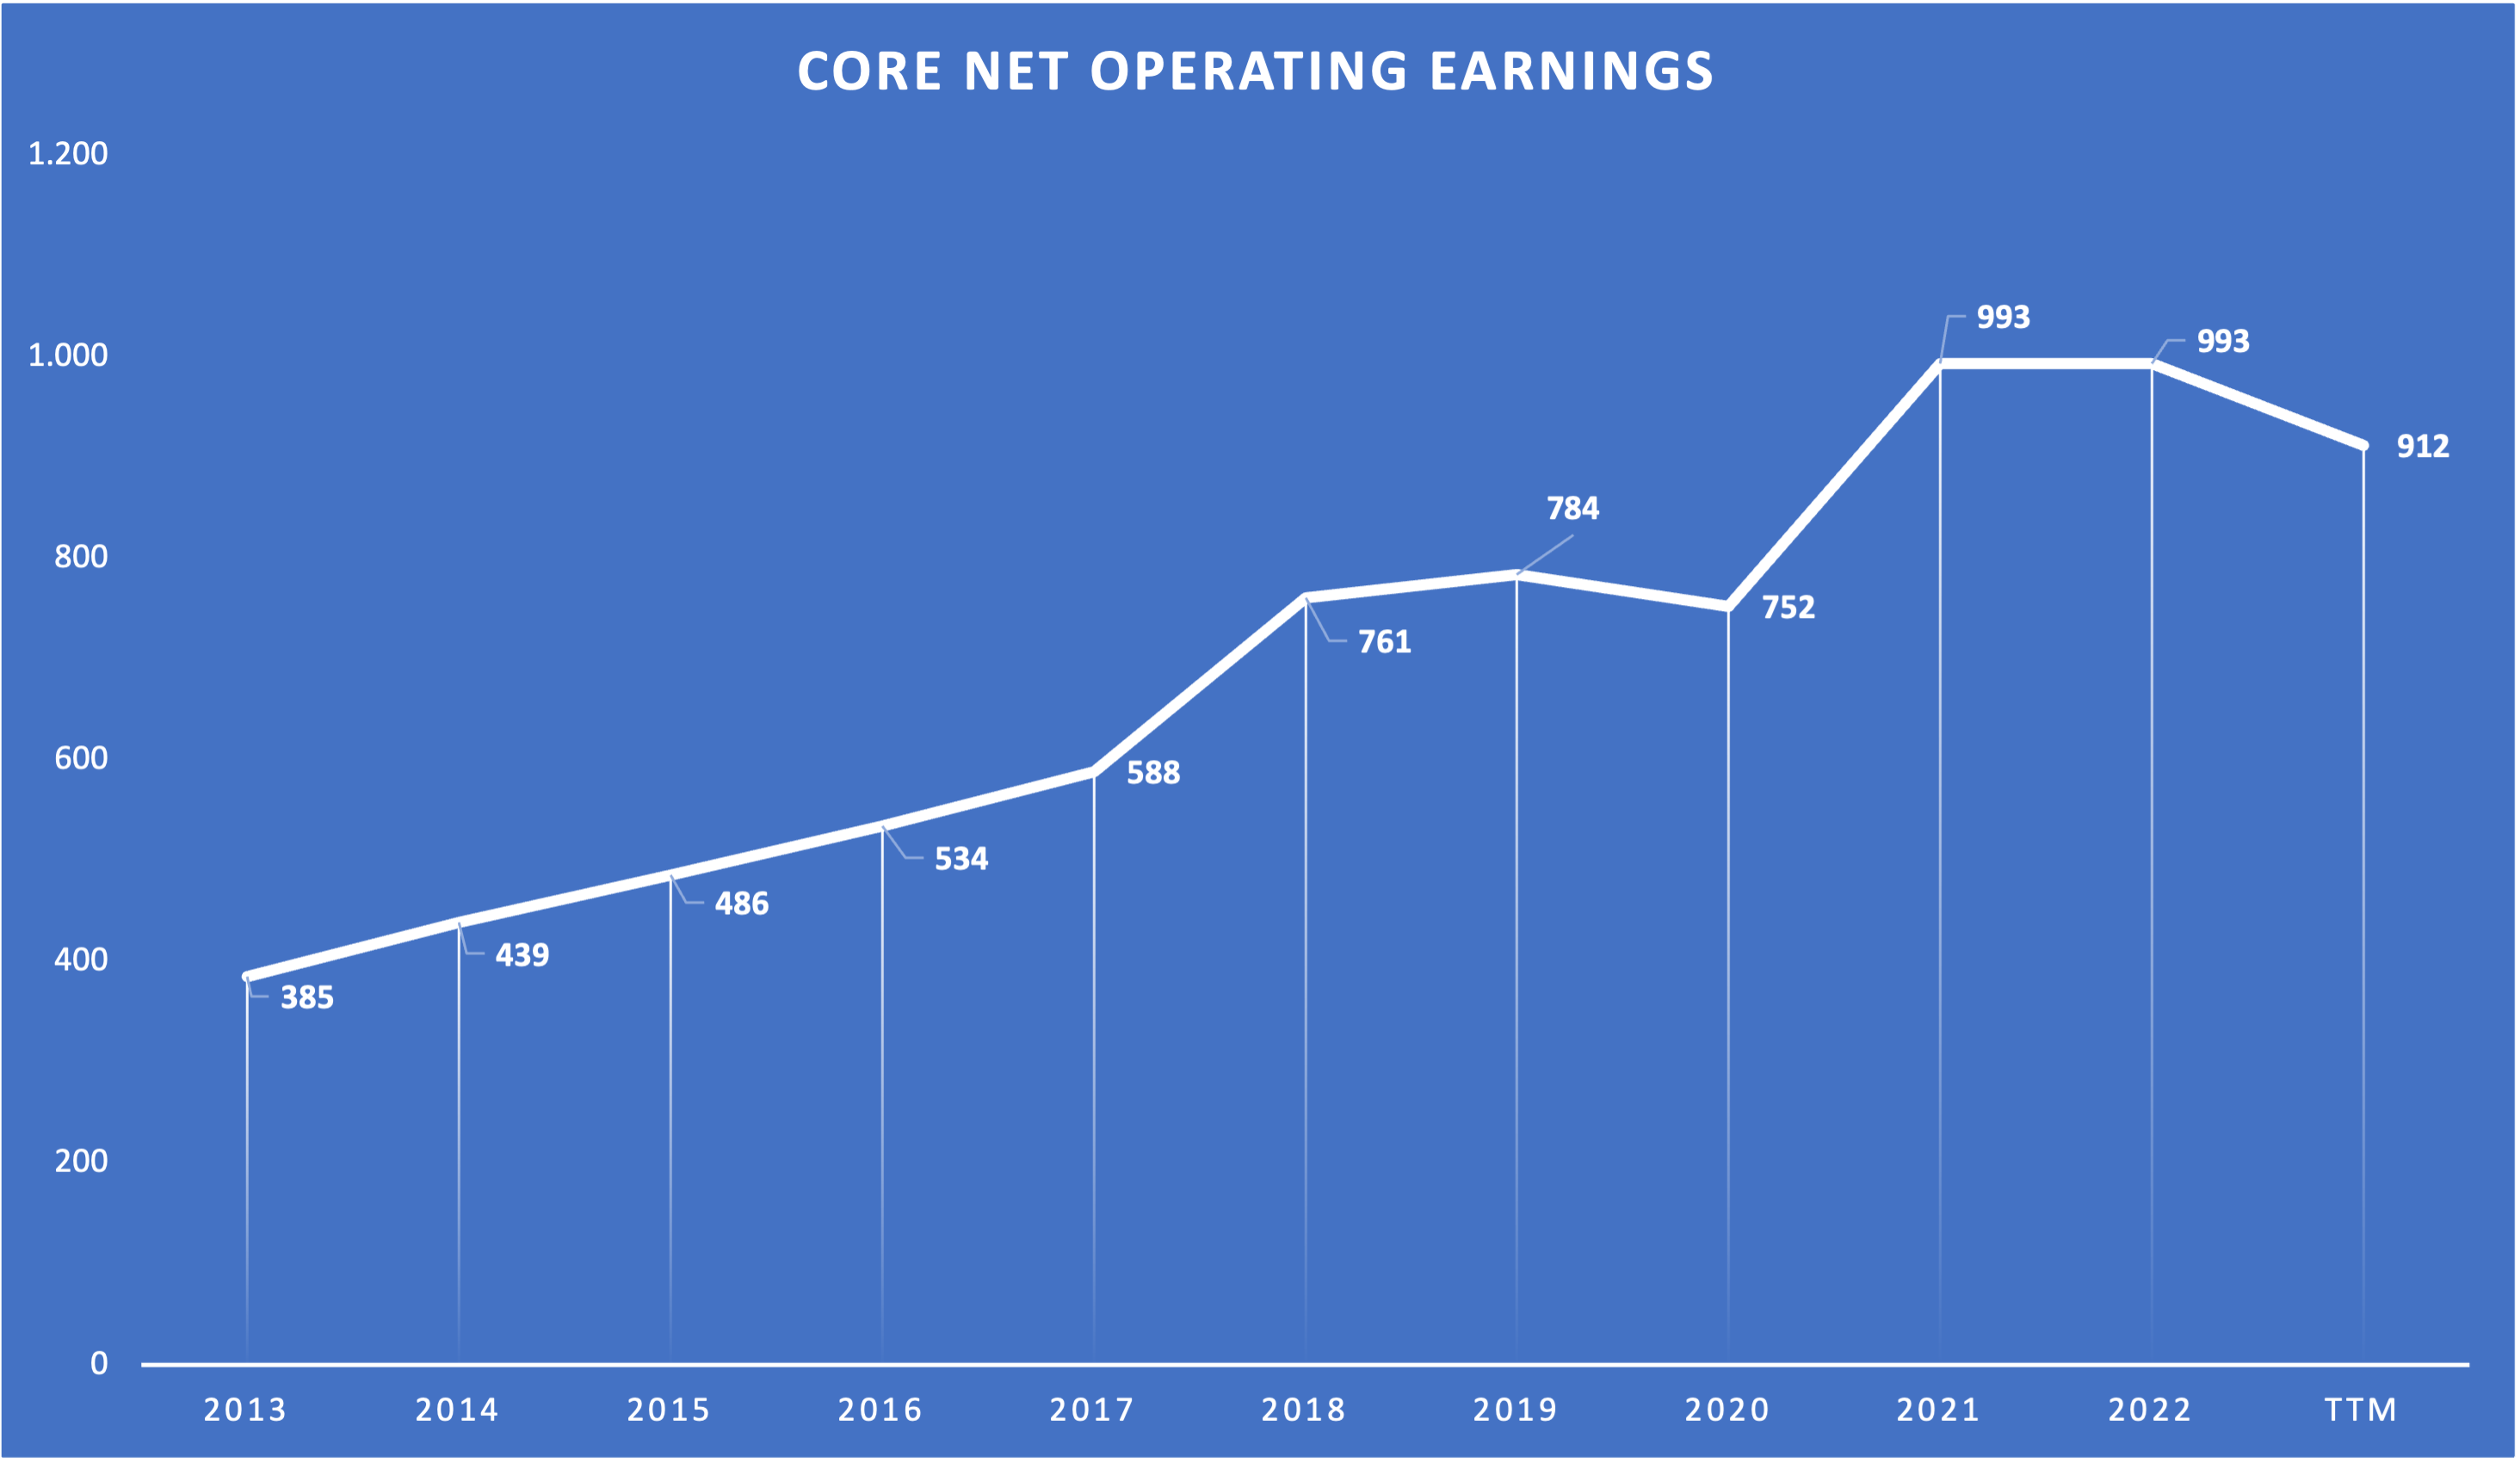
We can see that Goodwill only makes up below 1% of total Assets, something that I like to see because it shows that AFG has been able to perform as it does without the need to perform overpriced acquisitions. Cash and cash equivalents currently amount to $1,221 million while long-term debt stands at $1,474 million. This would result in a net debt position of only $253 million. According to S&P Capital IQ, net debt stands at $485 million, a bit higher than my number. It doesn't matter though because the net debt amount is negligible compared to AFG's earnings power. For the trailing twelve months ((TTM)), AFG's main reporting metric which is "Core Net Operating Earnings" (more on that soon) came in at $912 million. So AFG's net debt only stands at around 0.5x earnings, a very healthy number. In conclusion, AFG's balance sheet looks very healthy.
Now let's turn to earnings metrics and I want to start by taking a look at the aforementioned "Core Net Operating Earnings". Here is a screenshot from the FY22 Investor Supplement document:
FY22 Summary of Earnings (Q4 22 Investor Supplement - Page 4)
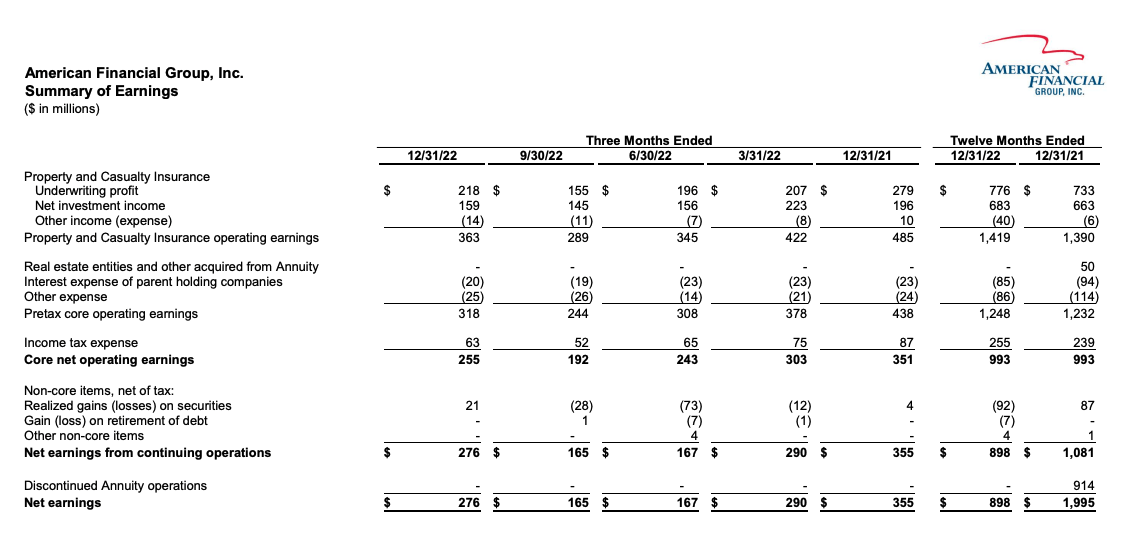
Here we can see what kind of adjustments AFG makes to net earnings to arrive at Core net operating earnings. The main thing, with the others being negligible, is the adjustment for realized gains/losses on securities. This absolutely makes sense so I have nothing to complain about here. We can use core net operating earnings (I will call it core earnings from now on) as our main earnings metric.
Here is a chart showing the development of core earnings over the last decade:
AFG Core Earnings since FY13 (Company reports - compiled by Author)
Author's Note: The Annuity business which was sold in 2021 is included in core earnings until 2020.
We can see that core earnings are in a long-term upward trend. This is not surprising since we already know that P&C premiums and the investment portfolio have been steadily growing. What we can see here though is the effect that the development of the combined ratio has on core earnings. Core earnings declined in FY20 in line with the decline in premiums. This was to be expected. Core earnings were flat YoY in FY22 and declined for the TTM despite premiums growing in this timeframe. This is due to the weakness in the combined ratio that I highlighted earlier.
Over the longer term, core earnings grew with a CAGR of 11.10% since FY13 and 11.05% since FY17. Both growth rates are higher than the growth rates we have seen for insurance premiums. This is attributable to improvements in the combined ratio. The combined ratio improved from 94.1% in FY13 to 87.2% in FY22 and currently stands at 90.1% for the TTM. In conclusion, we can't expect that core earnings will grow faster than premiums going forward. My best guess is that core earnings will grow in line with premiums at around 6%, maybe a bit faster if AFG manages to bring the underwriting expense ratio down by achieving some operating leverage (which I think is pretty likely).
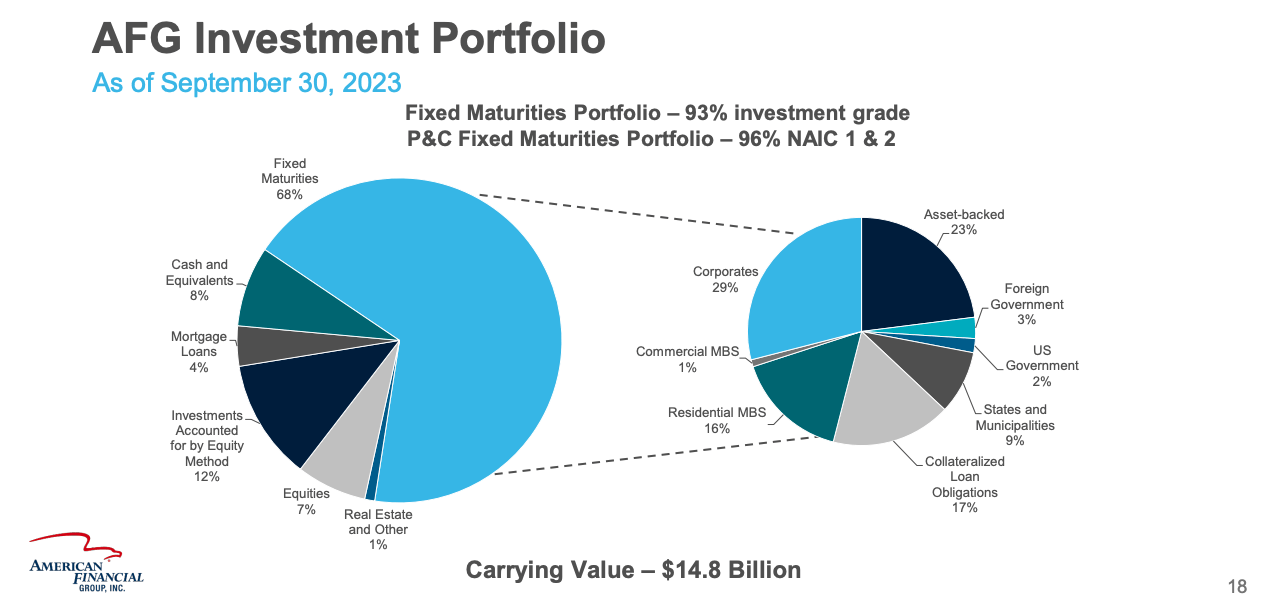
Next, I want to take a look at AFG's investment portfolio:
AFG Investment Portfolio (BMO Capital Markets Virtual Summit Presentation - Slide 18)
AFG's portfolio is concentrated on Fixed maturities. $2,378 million are invested in Alternative Investments (mainly Investments Accounted for by the Equity Method and Equities). These are supposed to generate higher investment income while the Fixed maturities fulfill the need for liquidity.
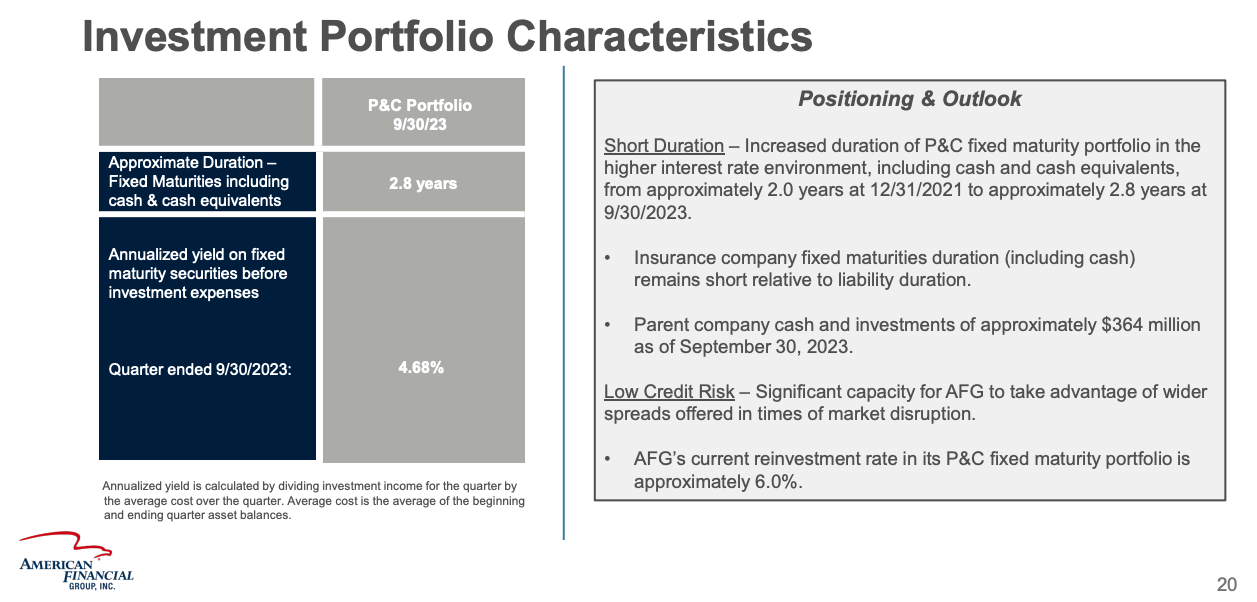
Here is another slide from the presentation showing some more Portfolio Characteristics:
Additional Portfolio Information (BMO Capital Markets Virtual Summit Presentation - Slide 20)
Here we can see something that I already guessed earlier. To catch the benefits of a rising yield environment, AFG has extended the duration of the fixed maturity portfolio from 2.0 years to 2.8 years since the end of 2021. Additionally, with the annualized yield of the fixed maturities standing at 4.68% right now and the reinvestment rates at 6%, we might see some more tailwinds from the yield side over the near term. As the older fixed maturities run out, they can be reinvested at higher rates, ultimately leading to higher net investment income over the near term. As I said earlier though, this is just a short-term effect of volatility and we shouldn't pay too much attention to this.
Overall though, I like AFG's approach of investing a part (around 15%) of the portfolio into higher-yielding alternative investments, especially as I have shown earlier that AFG's float can be very long-term. With the portfolio's carrying value at $14.8 billion and close to $10 billion in short-term fixed maturities, the liquidity side of the portfolio covers 1.5x times NEP, a healthy ratio in my opinion.
Valuation
There are currently 84.7 million shares outstanding while the price per share stands at $118.96. So AFG's market capitalization stands at close to $10.1 billion right now. With core earnings for the TTM coming in at $912 million, AFG currently trades at 11x core earnings which looks cheap.
Valuing a company like AFG isn't so easy though. There are three ways of valuing AFG in my opinion and I will go through all of them.
(1) Return on Equity (RoE) and Price-to-Book ratio (P/B)
This one is pretty simple and it is also the most inaccurate in my opinion. One could argue that Insurance companies could be valued like banks. We need two values for this: Book Value ((BV)) and Return on Equity (RoE). In the case of AFG, we can just take the adjusted BV that they report in every Investor Supplement document. At the end of Q3 23 , AFG's adjusted BV stands at $4,536 million. If we divide the market capitalization by the BV, AFG trades at 2.2x BV. Meanwhile, AFG generated $912 million in core earnings for the TTM, so the RoE for the TTM comes in at 20.1%.
Now we can put it together. If AFG generates 20% RoE and we expect a 10% return from our investment, we should be willing to pay 2x BV or around $107 per share. So this indicates that AFG is overvalued right now.
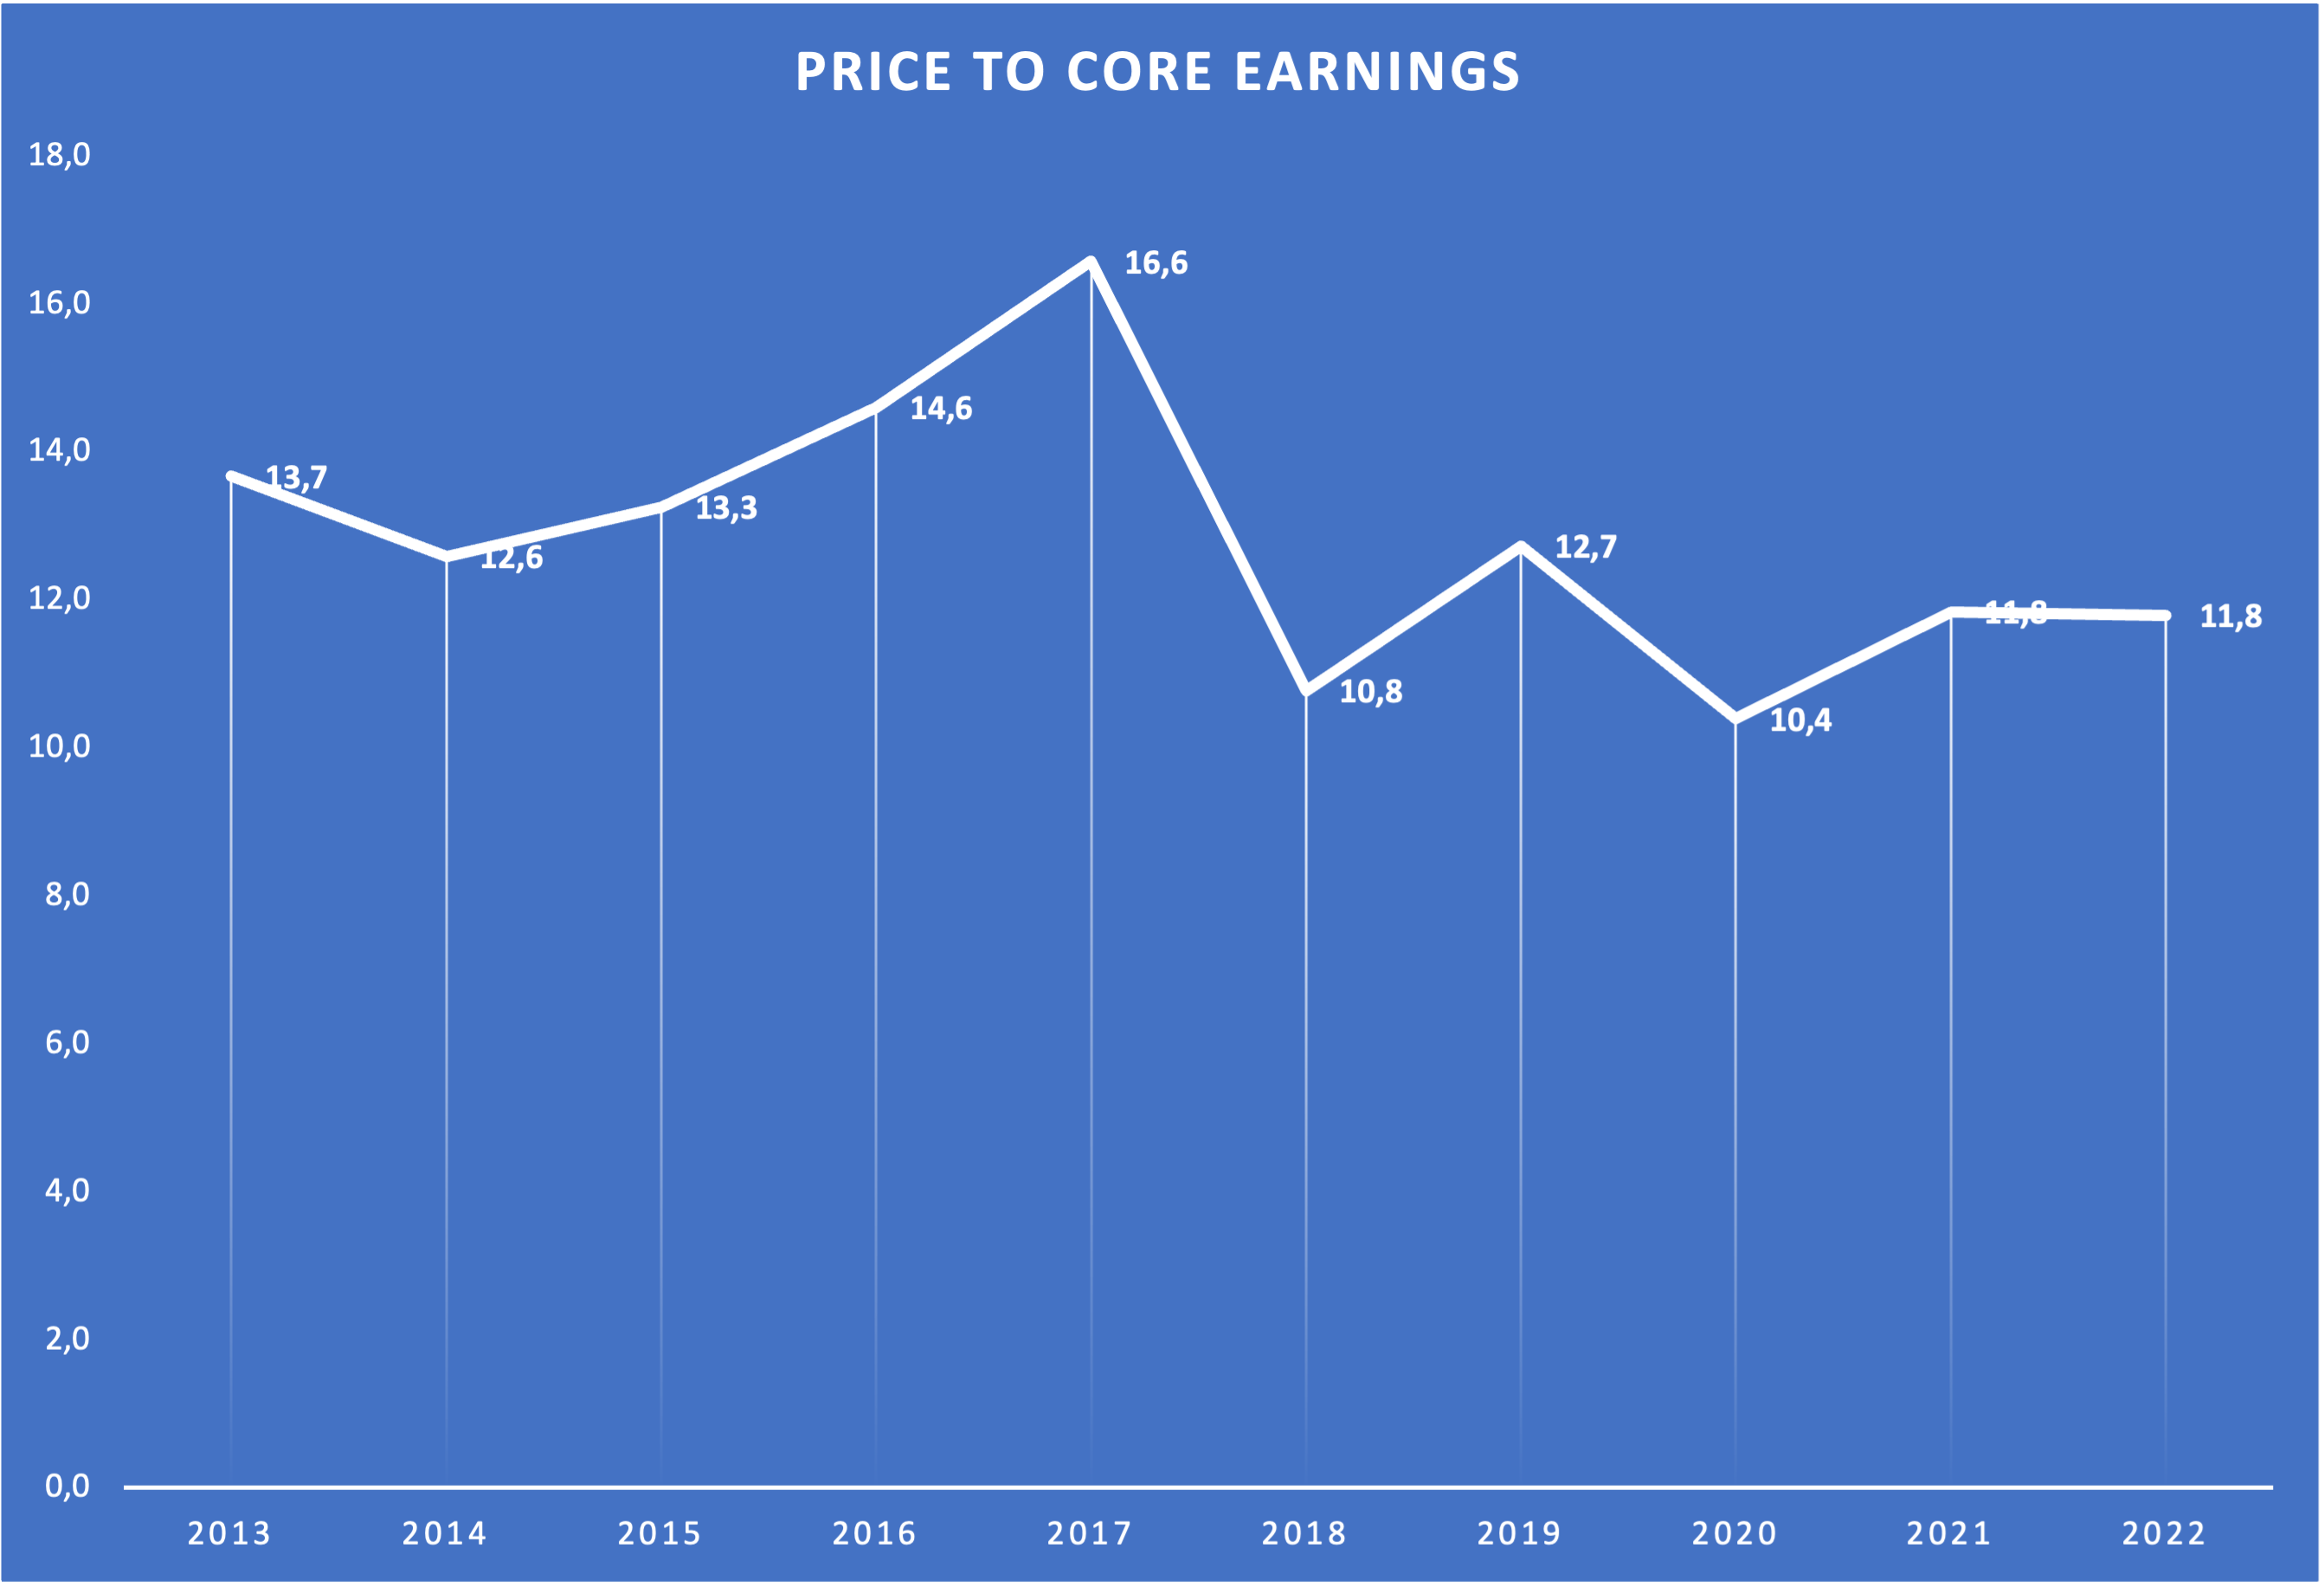
(2) Historical Price to Core Earnings ratio
We can also look at how the market priced AFG in the past. Here is a chart showing the Price/Core Earnings ratio over the past decade (the numbers are for the last day of December of every year):
Price/Core Earnings since FY13 (Compiled by Author using company earnings and per share prices)
The average is 12.8x Core Earnings and the median is 12.7x Core Earnings. If we apply 12.75x Core Earnings, AFG should trade at $137 per share. Using this valuation approach, AFG looks undervalued. I have to point out though that the above numbers also include the annuity business until it was sold in 2021. Because of this, I think that this also isn't the best approach to value AFG. This leads me to the last option.
(3) Discounted Cash Flow Valuation
This might seem odd because it isn't common to value an insurer using a DCF approach. Let me tell you why I think this is the best approach.
First of all, we need to gauge long-term return potential. I always say that I think long-term return potential is the sum of (1) the FCF Yield and (2) the future FCF growth rate. The problem is that in the case of AFG, we don't have a real number for FCF as we do for "normal companies" because of the nature of the insurance business. We can make it work though. So what does the FCF Yield normally tell us? It tells us how much cash the company can pay out to us while still fulfilling reinvestment needs ((CAPEX)). Let's apply this to AFG. I stated several times throughout this article that I think AFG should be able to grow premiums in the range of 6% in line with the past since I see no reason for the growth rate to slow down. The Investment Portfolio should grow in line with premiums at 6%. This would mean that the liability side of the balance sheet will grow at 6% as well. If AFG pays out everything it earns, liabilities will outgrow the equity part on the balance sheet, ultimately leading to a weak balance sheet and AFG not being able to take on new insurance contracts. So if AFG wants to keep this ratio up, it needs to grow equity/book value at 6% in line with liabilities. If AFG manages to keep producing RoE of 20%, it will need to reinvest 30% of core earnings back into the balance sheet. We can view this as some sort of CAPEX for AFG because it is needed to grow premiums.
I have shown earlier that AFG currently trades at 11x core earnings which is equivalent to a 9% earnings yield. Now we deduct my "CAPEX" estimate of 30%. The result is an "FCF Yield" of 6.3%. Now we are back in the usual valuation territory. If we add 6% premium growth on top of the 6.3%, AFG should be able to generate around 12% long-term returns going forward. If you think this calculation was completely delusional, let me show you a slide from the recent investor presentation:
10-Year Value Creation (BMO Capital Markets Virtual Summit Presentation - Slide 7)
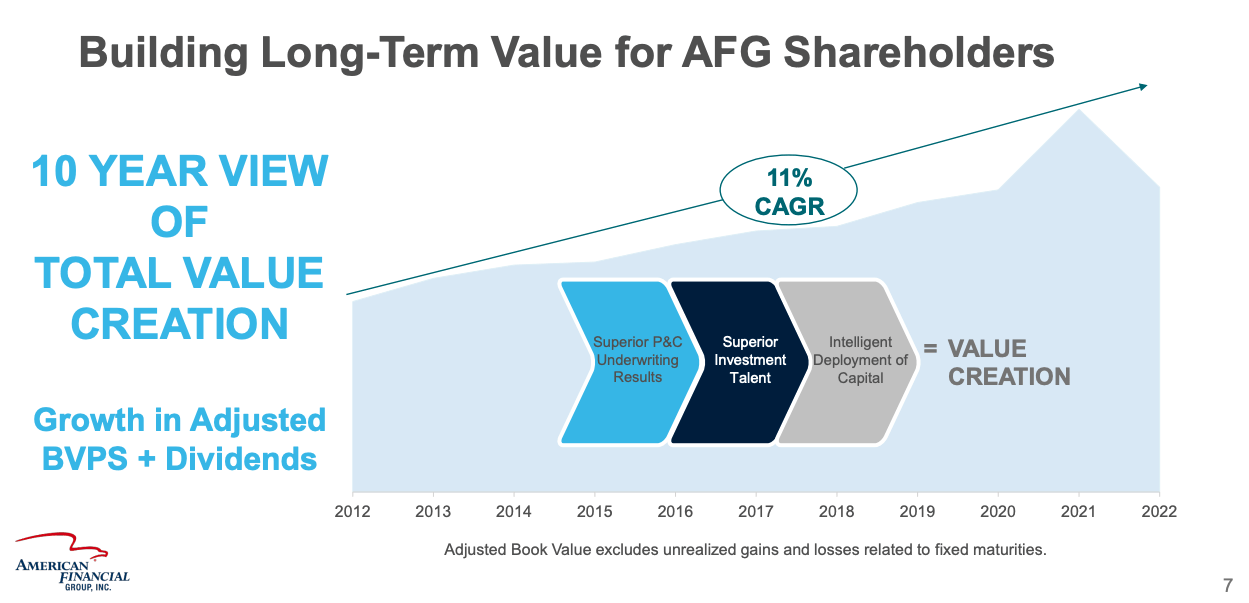
Here we can see that AFG delivered growth in adjusted BV + Dividends of 11% since 2012, a bit below my expectations. If AFG would be valued at 12.75x core earnings as it did in the past, my calculations would result in an 11% return potential in the future, in line with the past. If you are a dividend investor, be informed that the 6.3% "FCF Yield" I mentioned will probably be close to 100% dividends. So AFG is a high-yield stock with mid-single-digit growth, making it an interesting choice for dividend investors who want to diversify their portfolio without compromising on total return prospects.
Now to finish this section up, let's perform a DCF calculation. I will assume $10.65 core earnings per share (as AFG guides for FY23). After deducting the 30% "CAPEX" mentioned above, the starting FCF should be $7.46 per share. I will use a 10% discount rate (as I always do), 6% growth over the next decade and 3% growth into perpetuity (a bit above global GDP growth). Here is the result:
DCF Calculation (Moneychimp.com)
Surprisingly, my estimates leave me to assume that AFG should be worth $137 per share. This is exactly the same value that I derived using the Price/Core Earnings ratio, indicating that the market priced AFG fairly reasonably over the past decade.
In conclusion, I think that AFG is undervalued at the moment with an upside potential of around 15%.
Risks
After thinking about it for quite some time, risks seem to be low. The only two risks I see are (a) a permanent decline in the combined ratio and (b) a permanent decline in the portfolio yield.
Risk (a) would mean that AFG suddenly starts to lose its underwriting prowess or experiences deterioration of underwriting costs. This would lead to lower underwriting profit or in the worst case even to underwriting losses. Since underwriting accounts for a huge part of AFG's profits, this would be very bad for the company and subsequently also for the share price.
Risk (b) is far more likely and would come into play if the federal funds rate goes back to zero. This would lead to a sharp decline in AFG's net investment income which can't be made up for by the growth of the portfolio size. If you want to bet on declining rates, AFG is not the right investment to do so.
Conclusion
AFG has been able to grow net earned premiums ((NEP)) at above 6% per year over the past decade and there is no reason to expect this growth rate to materially decline. The investment portfolio generated net investment income and grew in line with NEP (even a bit faster) while the portfolio yield followed the federal funds rate. AFG's balance sheet and investment portfolio look healthy. Net debt stands at 0.5x core earnings, a very good ratio.
The insurance business is defensive by nature and AFG operates in several niche markets while being well diversified throughout the sub-sectors of its three main reporting segments.
I estimate that AFG may be able to pay out at the "FCF Yield" of 6.3% while growing earnings in line with premiums at around 6% going forward. Using several valuation approaches, I concluded that AFG is undervalued and should be worth around $137 per share.
Risks seem low and the only two risks I see are permanently declining margins (expressed through a deteriorating combined ratio) and a permanent decline in the portfolio yield in the case of a return to the zero-rate policy.
Taking everything into account, I initiate coverage on AFG with a buy rating and a fair value estimate of $137 per share.
For further details see:
American Financial Group: High Yield Without Compromising On Total Returns?