TEL - Aoris International Fund Q2 2023 Report
2023-07-20 08:45:00 ET
Summary
- Aoris is a specialist international equity manager and manages a single international equity portfolio. Our investment approach is conservative, fundamental and evidence-based.
- The Aoris International Fund (Class A – Unhedged) outperformed its benchmark by 1.0% in the June quarter, returning 7.9% for the quarter.
- The Aoris International Fund (Class C – Hedged) matched its benchmark with a return of 6.4%.
- The fund purchased Microsoft in mid-2022, which has since appreciated by 45% in the first half of this year. Microsoft's strategic position in generative AI is noted as a significant factor.
- The fund sold Nike due to concerns about its long-term prospects.
Performance to 30 June 2023
| Class A (Unhedged – base fee option) inception 26 March 2018 |
| June Quarter |
| 1 Year |
| Since Inception p.a.* |
| Portfolio return (AUD) net of all fees |
| 7.9% |
| 34.0% |
| 15.5% |
| MSCI AC World Accum Index ex-Australia (AUD) |
| 6.9% |
| 20.5% |
| 10.9% |
| Excess return |
| 1.0% |
| 13.5% |
| 4.7% |
| Class C (Hedged – base fee option) inception 28th September 2018 |
| June Quarter |
| 1 Year |
| Since Inception p.a.* |
| Portfolio return (AUD) – net of all fees |
| 6.4% |
| 26.0% |
| 12.1% |
| MSCI AC World Accum Index ex-Australia 100% Hedged (AUD) |
| 6.4% |
| 14.6% |
| 6.8% |
| Excess return |
| 0.0% |
| 11.4% |
| 5.3% |
| *Past performance should not be taken as an indication of future performance. |
Market and portfolio performance
International equity markets, as measured by the MSCI AC World Accumulation Index ex-Australia, rose by 6.9% in the June quarter (all returns are in A$ unless stated otherwise). Equity markets appreciated by 6.4% in local currency terms, while changes in currency values added 0.5% to the A$ return.
As shown in the table on the previous page, the Aoris International Fund (Class A – Unhedged) returned 7.9% for the quarter, outperforming its benchmark by 1.0%. The Aoris International Fund (Class C – Hedged) returned 6.4% for the three-month period, matching the performance of its benchmark.
Three topics have received considerable attention by market commentators over the last quarter or so:
- Inflation;
- Artificial intelligence ((AI)); and
- The narrowness of equity market returns.
Inflation
Let’s start with inflation and the related topic of monetary policy. Inflation has proved more persistent than central bankers anticipated a year ago, necessitating higher official interest rates in a bid to cool economic activity and the rate of price rises. Many investors perceive tightening monetary policy as a clear negative for equity markets: it raises the prospect of economic contraction and lower corporate earnings, and may adversely impact how investors value corporate earnings.
We believe these concerns are misplaced. Equities represent ownership of businesses, not economic variables. The value of a business today is a function of its mid-cycle earnings and the rate at which those earnings can be expected to grow over time, discounted back to the present at a mid-cycle interest rate.
Over the last year, the US Federal Funds Rate has increased from 1.6% to 5.1%. Over the same period, international equities have appreciated by 20.5%, while the Aoris International Fund (Class A) has returned 34.0%.
Artificial intelligence
We’ve all heard terms such as generative artificial intelligence ((AI)) and ChatGPT a great deal over recent months. The media and investors alike have responded enthusiastically, suggesting that AI holds the promise of a transformative impact on both economic productivity and corporate profits.
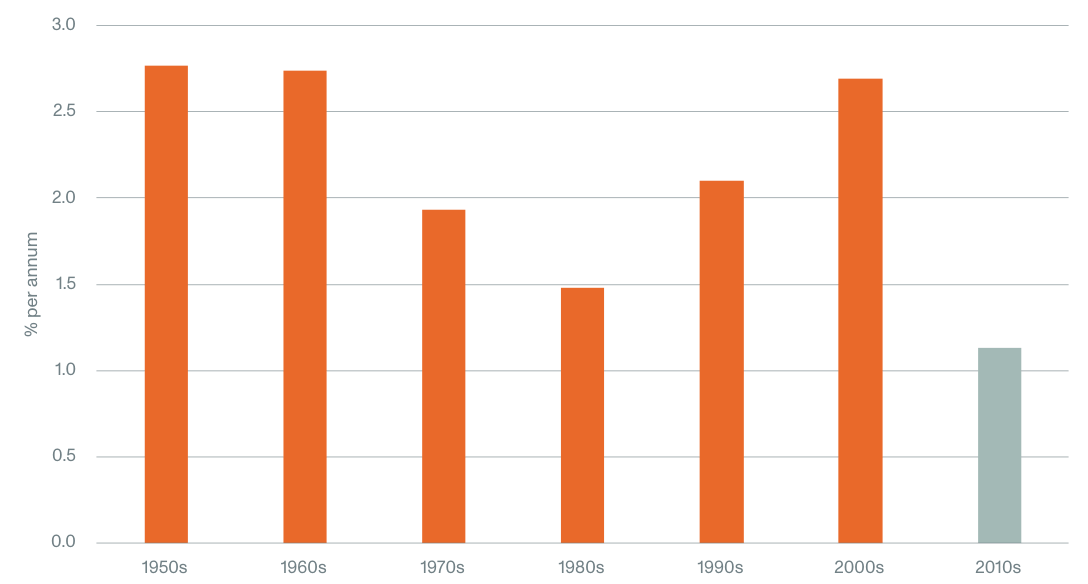
Let’s pause for a moment and consider some lessons of history. For all the wonders of the various technological innovations that became widely used in the 2010s – 4G smartphones, Google Maps, video conferencing, Bluetooth, 3D printing, and cloud computing – labour productivity in the US over the period 2010 to 2019 increased at a slower rate than in any of the six preceding decades.
US labour productivity growth
Investor excitement about AI has been accompanied by dramatic increases in the market valuation of businesses seen as direct beneficiaries, such as Nvidia ( NVDA ) and ASML . Generative AI may hold great promise; however, the conversion of great promise to great profit is not always straightforward, and it seems to us it’s very early to be identifying long-term winners and what AI might mean to the value of those companies today.
We purchased Microsoft ( MSFT ) for the Aoris portfolio in mid-2022 and it has performed very strongly since, with its share price appreciating by 45% in the first half of this year alone. Microsoft does appear to have an enviable strategic position in generative AI in three ways:
- Microsoft has a 49% ownership in OpenAI, the company behind ChatGPT.
- All the computing power used to run ChatGPT is provided by Azure, Microsoft’s cloud computing service.
- Microsoft is rapidly embedding its own version of OpenAI, called Copilot, into all its software applications. Given Microsoft’s vast global user base and the potential for Copilot to automate and improve all the tasks we use Microsoft tools for, from search, to writing documents, to writing code, the commercial opportunity here is significant.
However, AI is not the reason we own Microsoft, nor was it front of mind for us at the time of our purchase. We expect Microsoft’s future to be bright with or without AI, by continuing what it’s been doing effectively for many years: being more relevant to more users.
Equity market narrowness
The equity market has been widely described as being unusually narrow this year. According to Reuters, the percentage of S&P500 stocks outperforming the index in the six months to June was just 25%, and in the June quarter it was about 20%, the lowest on record. Moreover, all the gains of the S&P500 index so far in 2023 can be accounted for by just seven tech stocks.
This year may seem to be all about technology and AI, but that hasn’t been our experience. Of the 50 largest technology companies globally, Aoris does not own 49 of them. Yet in the six months to
June, 10 of the 15 stocks in our portfolio outperformed our benchmark. Other than Microsoft, our three strongest performing holdings were Copart ( CPRT ), a leader in online auctions for salvaged vehicles (share price up 53% in the June half); Graco ( GGG ), a leader in fluid handling and dispensing equipment (+31%); and Fastenal, a leading distributor of industrial products in the US (+27%).
As always, we see our portfolio as an owner of 15 outstanding businesses that will become progressively more valuable over time, with a low risk of disappointment. We believe them to be durable, growing in profitably, resilient to external factors, and competitively winning. These attributes are highlighted in Delian’s accompanying feature article.
Portfolio Changes
Purchases: RELX
RELX is a global provider of data, analytics and decision tools for professional customers across science and academia, legal, risk, and insurance. It is the largest publisher of scientific journals globally, the second largest provider of legal publications in the US, and one of the biggest providers of risk tools to banks and insurance companies. RELX also has an exhibitions business that hosts over 500 events across 43 sectors each year.
We had owned RELX from the inception of the Aoris portfolio until March 2019.
At the time of our sale four years ago, we were concerned about discontent by some of RELX’s academic library customers regarding the terms under which they purchased scientific research. These issues appear to have been resolved and that part of RELX has subsequently grown at a healthy rate.
Sales: Nike ( NKE )
We sold Nike during the quarter. We had become less comfortable with Nike and its long-term prospects for three reasons:
- The market share loss experienced by Adidas in the last year is a reminder that in the athletic footwear and apparel market, consumer preferences can move easily.
- In China, which accounts for around 20% of Nike’s revenue, local Chinese companies such as Li Ning and Anta have taken meaningful market share in the last three years, supported by nationalistic consumer sentiment.
- Recent years have seen HOKA and Switzerland-based On grow into successful new entrants in the performance running shoes category, suggesting that the benefits of scale in this market are not what they once were.
Why settle for second best?
by Delian Entchev, Portfolio Manager
Introduction
The attributes that separate the best businesses from their next-best peers become more apparent during tough times.
In a favourable economic environment, businesses that are the leaders in their industry may appear to be of similar quality and risk to the #2 or #3 player.
Those may be fine businesses in their own right. But during times of stress, the attributes that separate the best businesses from their next-best peers start to become more apparent, and the differences in their financial performance can be stark.
The last three years have been a valuable test of management and business quality. Companies had to contend with the pandemic, supply chain disruptions, labour shortages and inflation, among other challenges.
At Aoris, we have been reassured and impressed by the extent to which many of our market-leading portfolio companies have distinguished themselves from their second-best peers in this tough environment.
In this feature article, I bring this observation to life with five examples from our portfolio. I compare their operating performance over the last three years to that of their closest competitor, and consider some of the characteristics that have contributed to their outperformance.
Attributes that separate the best businesses from the second-best
There are three common attributes of the businesses featured in this article, and in our portfolio more broadly, which distinguish them from their next-best peers. We believe these attributes are deep-rooted and enduring sources of competitive advantage.
Size: Competitively winning businesses are often the largest in their industries. In many cases this creates economies of scale, where a business can distribute its fixed costs over a larger base of revenue.
Large businesses tend to be more profitable and well- funded, which allows them to continue investing to reinforce their size and strength. They are in an enviable position relative to their smaller peers in procuring scarce products and negotiating better terms from their suppliers, which has been particularly important during the recent supply chain disruptions and inflation. Their brand recognition and greater range of internal employment opportunities may make it easier for them to attract and retain talent, especially in a tight labour market.
Breadth: With every individual business we consider for the Aoris portfolio, a key criterion is that it serves a broad range of end markets and customers, such that weakness in any one area doesn’t bring down the whole business. Breadth can make the best businesses more resilient than their close peers, whose narrowness may introduce fragility that isn’t apparent until it’s too late.
Culture and management mindset: Companies with the #1 position in their market, who have outlasted and outgrown their competitors over many years, have often achieved that position through a culture of long-term thinking. In a fearful environment, when many companies pull back on their investments to protect near-term profits, a longer-term mindset from the best businesses can pay off enormously in the ensuing years.
Another cultural attribute we look for is customer- centricity; that the business puts its customers first and at the centre of everything it does. We want to own businesses that deliver more value to their customers year in, year out, rather than looking to extract maximal profits from them.
Examples from the portfolio
In the rest of this feature article, I explore five examples from our portfolio that have visibly exhibited these attributes and outperformed their next-best peers over the last three years.
The main measure I compare is the cumulative growth in operating profit since the start of 2020, excluding the impacts of currency movements and acquisitions where possible.
Accenture ( ACN )
For 70% of the projects it works on, clients engage Accenture without inviting bids from competitors.
Accenture is the leading global provider of IT consulting and outsourcing services. It helps the world’s largest organisations deal with change and become more efficient, which in the last three years has included modernising their IT, adapting to working from home, and navigating supply chain disruption and inflation.
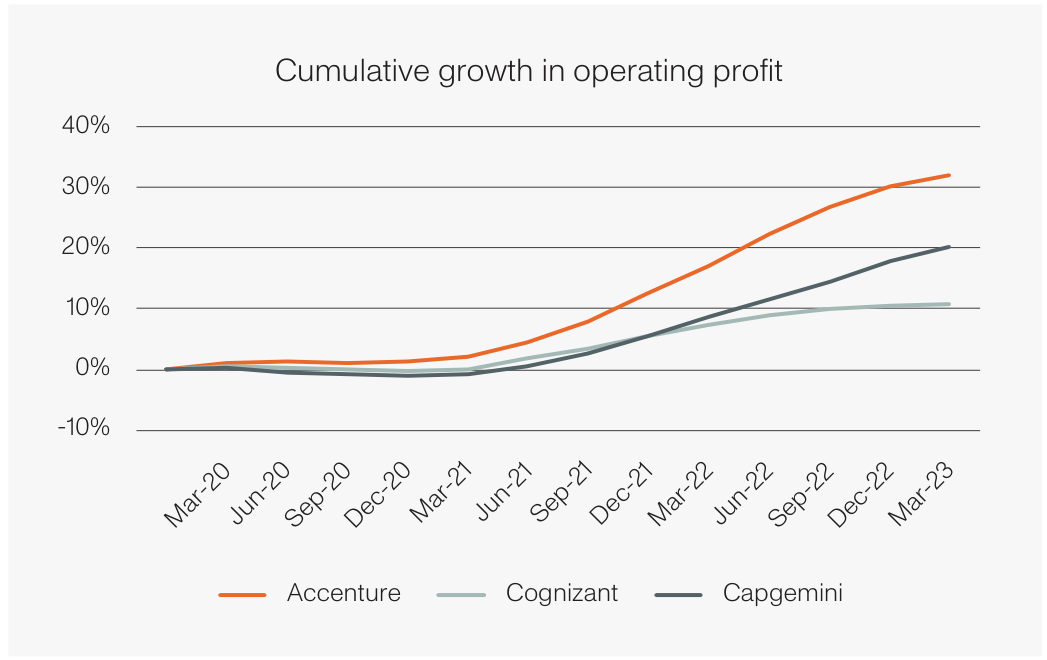
Accenture’s most comparable publicly traded competitors are the US company Cognizant ( CTSH ) and the French company Capgemini ( CAPMF ). Accenture is about 3x their size in revenue and profit.
Accenture’s size is one attribute that allows it to outperform its peers, particularly in difficult conditions when clients need to act more urgently. With over 700,000 employees around the world and deep expertise in each of its services and industries, Accenture is the first port of call when its clients need help with the most complex problems, and on a compressed timeframe.
Another advantage over its competitors is Accenture’s breadth of services, allowing it to remain relevant as clients’ needs change. Two years ago, clients may have prioritised IT consulting to adapt to work-from-home, and today their focus may be outsourcing to save on costs.
Clients increasingly want to deal with fewer vendors, which advantages the biggest consultancies like Accenture who have global reach and can solve the broadest array of problems. For 70% of the projects it works on, clients engage Accenture without inviting bids from competitors.
Both attributes also make Accenture a more attractive place to work versus its peers. Its consultants can work on a broad range of complex problems with the world’s largest organisations. Through 2021 a third of Cognizant’s employees decided to leave the business and it struggled to continue servicing its clients, while Accenture’s attrition rate remained in the teens.
The figure below shows that Accenture’s cumulative growth in operating profit over the last three years has been 2–3x that of its next-best peers.
Amphenol ( APH )
Amphenol’s decentralised structure keeps it nimble and entrepreneurial.
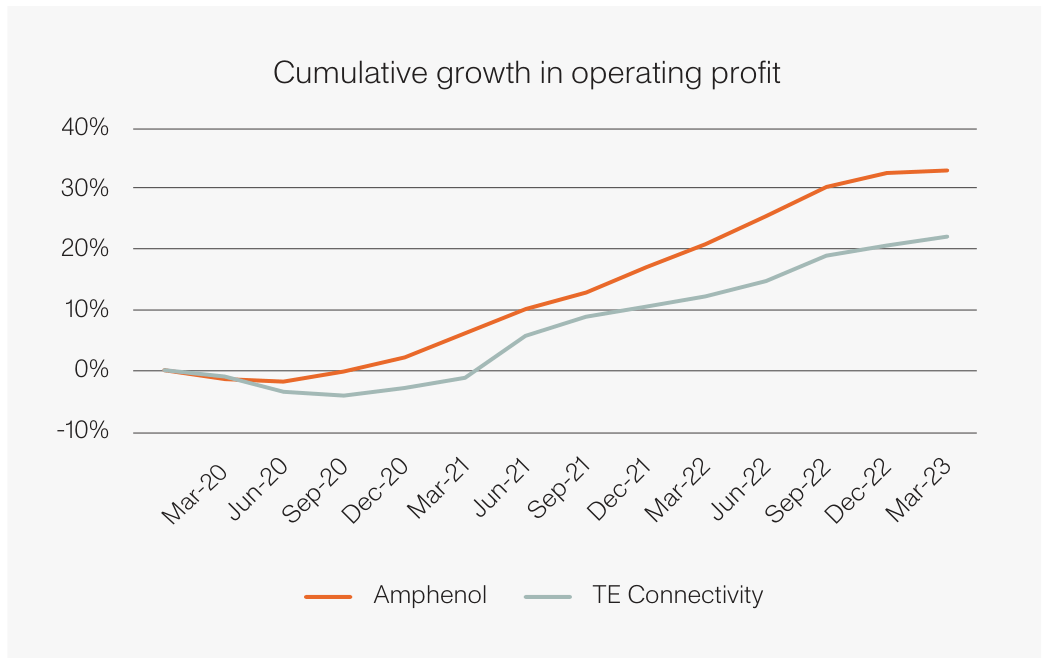
Amphenol is one of two leading makers of connectors, which transmit data between electronic components in a device. The other is the listed company TE Connectivity ( TEL ). There are also thousands of smaller connector companies, many of them private, which tend to specialise in a certain industry.
Over the last three years, Amphenol’s cumulative profit growth has been 50% higher than that of TE Connectivity.
A defining feature of Amphenol is its decentralised operating structure and culture. Under the parent company there are 130 business units, each run with full autonomy by their general manager, who can make decisions quickly on the ground as they see conditions changing. This allowed Amphenol to serve customers more reliably than its peers through the recent supply shortages. In contrast, TE Connectivity operates a more traditional corporate structure, and it was unable to fulfil $100 million worth of customer orders in 2021 when it found itself short of raw materials.
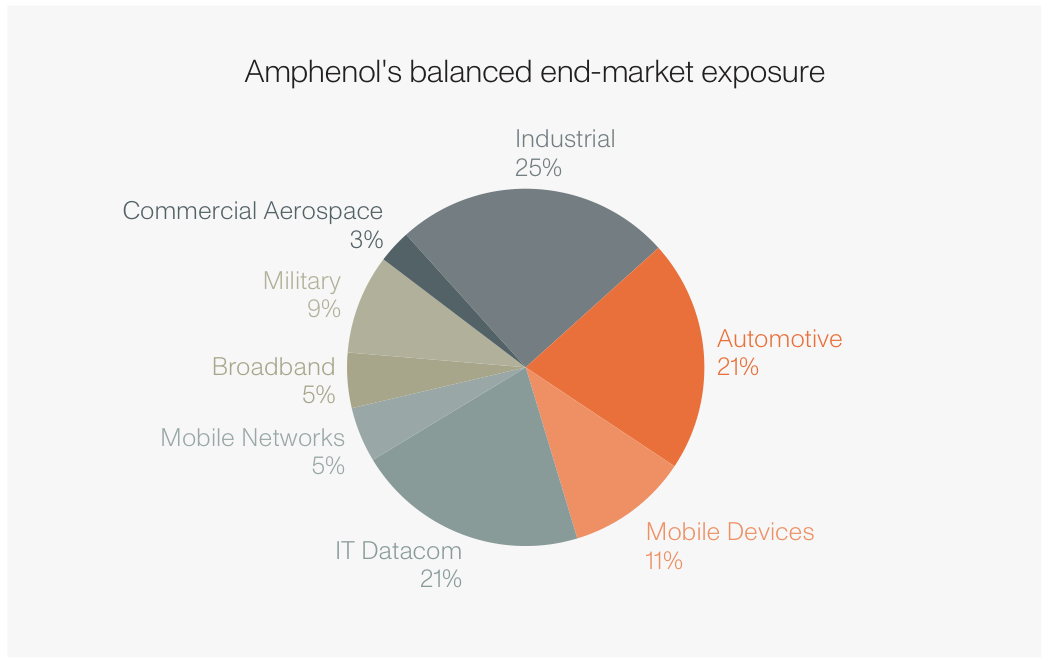
Amphenol’s growth has also been more consistent, with a less pronounced dip in profits at the start of the pandemic. The main reason is that it serves a very broad range of end markets (see chart below), so at any point in time weakness in some industries can be offset by growth elsewhere. Meanwhile, 62% of TE Connectivity’s sales are to the automotive industry, which makes it susceptible to variabilities in the production of cars, as occurred during the last three years.
Cintas ( CTAS )
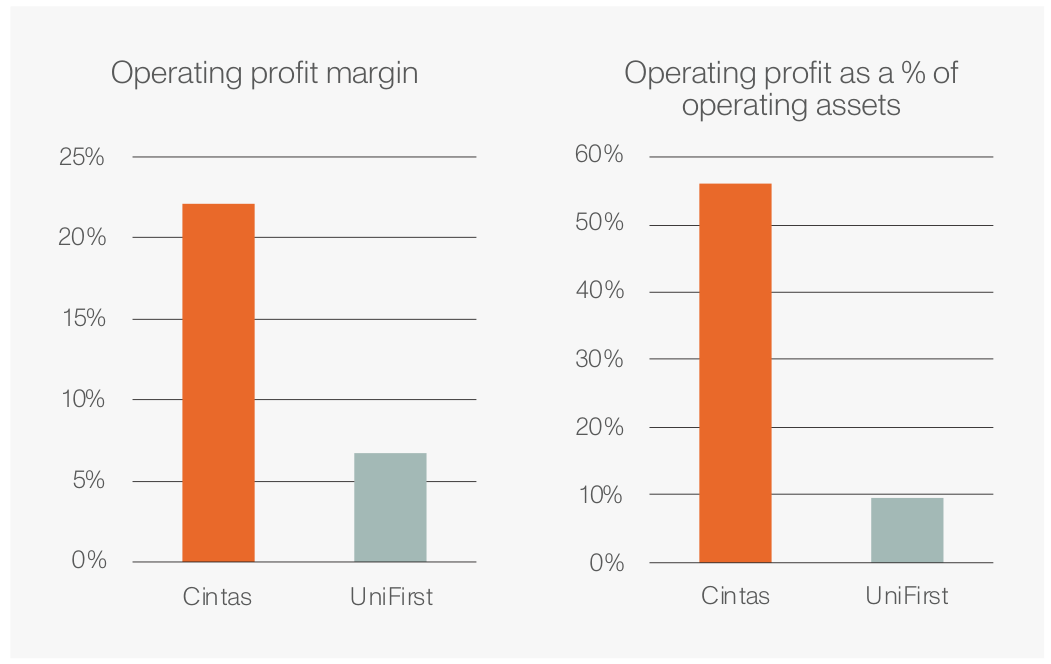
For every dollar Cintas invests into its operating assets, it earns 6x as much profit as UniFirst.
Cintas is best known as the largest uniform rental provider in the US. Businesses that use uniforms, like hotels or hospitals, can either buy and maintain uniforms for staff themselves or rent them for just a few dollars a day. Cintas drops off fresh uniforms every Monday and picks up the dirty laundry on Friday. It also provides other services, such as inspecting first-aid kits and fire protection equipment.
Cintas is by far the #1 uniform rental company, with 4x the revenue of its largest competitor, UniFirst. Cintas’ scale allows it to serve more customers on each of its routes and to spread its investments into laundry facilities and vehicles over a larger base of revenue. As a result, its operating profit margin is 3x that of UniFirst. And for every dollar that Cintas invests into its operating assets – i.e., its inventory, property and equipment – it earns 6x as much operating profit as UniFirst.
Cintas’ size also allows it to negotiate better pricing and receive higher priority from its suppliers. This became particularly relevant through COVID-19, when it was able to source supply-constrained essential consumables, such as sanitation supplies, which allowed customers to remain in business and contributed to its market share gains.
We have been impressed at the extent to which Cintas’ culture has come to the fore during this difficult period. The priority has been to take care of its customers and build their loyalty over the long term, rather than maximising profits in the short term. For instance, when Cintas experienced meaningful inflation in its labour, fuel and raw material costs in the last few years, it worked to secure better terms from its suppliers and to operate more efficiently, rather than just passing this on to customers.
In its most recent quarterly results, Cintas only raised its prices by ~4%, less than the rate of inflation, while UniFirst increased prices by nearly 10%.
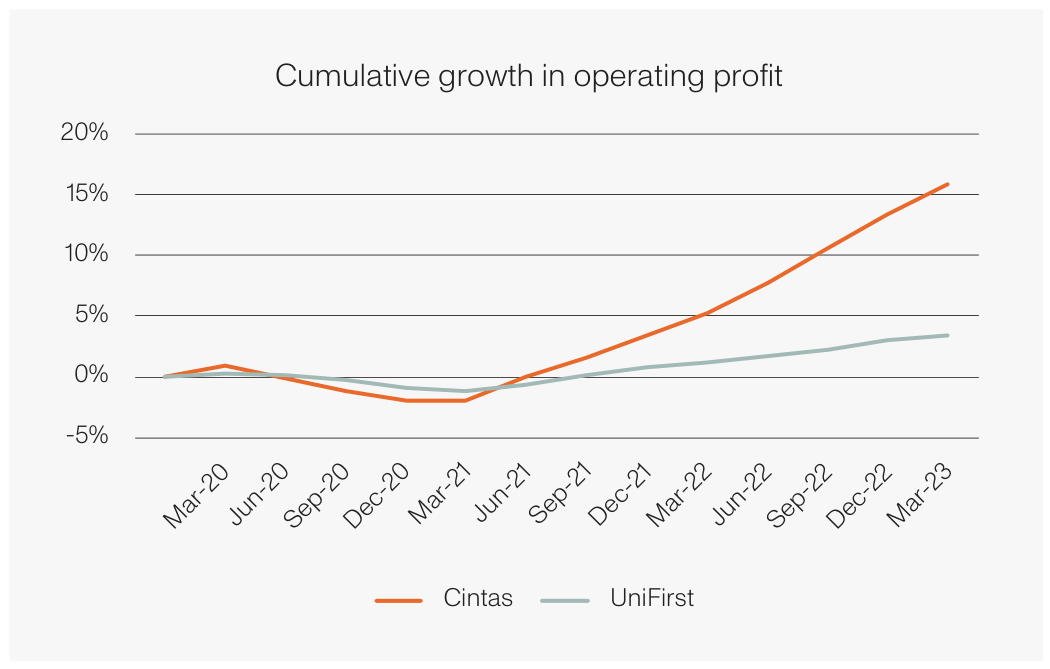
In the last three years, Cintas has cumulatively grown its operating profit by 5x as much as UniFirst. However, this understates its superior growth in economic value, as it can earn a much more attractive rate of return when it reinvests these profits. At Cintas, $1 profit growth is a lot more valuable than $1 growth by UniFirst, let alone its smaller peers.
Copart ( CPRT )
Copart is 70% larger than its main competitor IAA, which makes its marketplace more attractive to both buyers and sellers.
Copart is the world’s largest operator of salvaged vehicle auctions. When insurers need to write off a damaged car, Copart helps them sell it, typically to a salvage buyer who scraps it for parts, or to a buyer in an emerging country who can repair it cheaply.
The salvage auction market is effectively a duopoly between Copart and its competitor, IAA. Fifteen years ago Copart and IAA had an equal market share, and since then Copart has steadily grown its share to be 70% larger than IAA today.
This is another market where size is a natural advantage. Copart has the largest number of salvaged car listings, which makes it attractive to buyers; and because it attracts the largest global base of buyers, it is attractive for insurers to sell through its marketplace.
Copart’s culture and management also exhibit unusually long-term thinking, with three main areas that come to mind:
- Technology – In 1998 Copart launched the first online auction in the industry, and over the subsequent five years it completely shifted from physical auctions at its salvage yards to online. This is more convenient for its domestic buyers and makes its auctions accessible to international buyers. IAA was still heavily reliant on physical auctions when the pandemic hit.
- Land – There are currently about 300,000 vehicles listed on Copart’s website, which need to be stored in its salvage yards until they’re sold. Since its founding, Copart has placed great importance on owning the land for its salvage yards, whereas IAA has chosen to lease most of its land, with the risk that landlords increase its rent or repurpose the site. Copart’s yard locations also allow it to be more responsive in assisting insurers after natural disasters, which has been a contributing factor to its share gains against IAA in the last few years.
- Balance sheet – Copart has no debt and a healthy cash balance, while IAA has operated with high debt levels for most of its history, constraining its ability to invest in land.
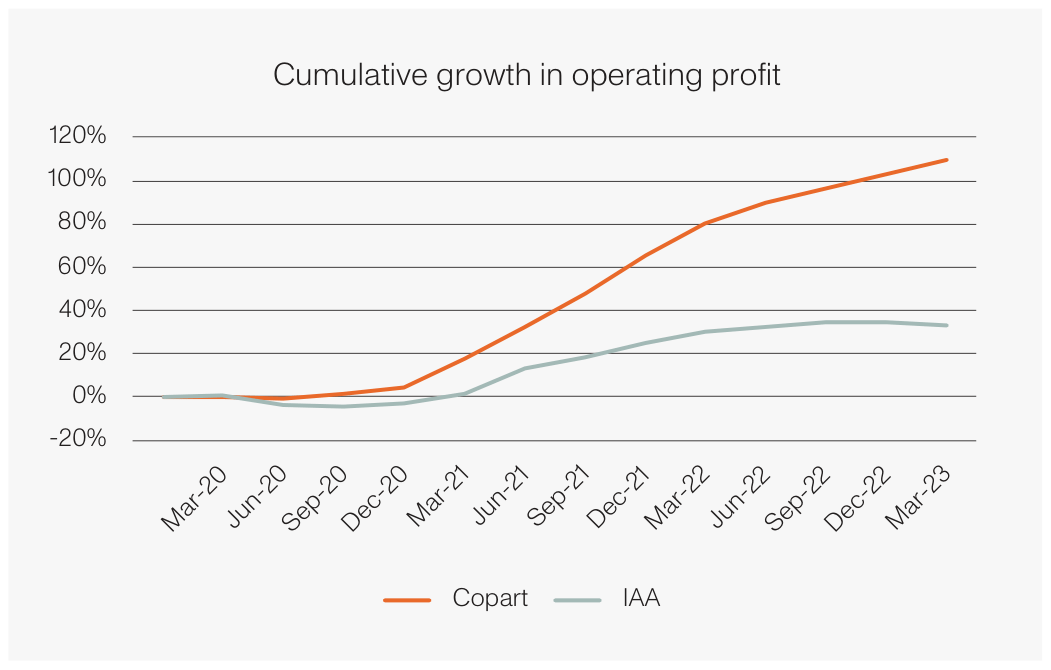
Due to its scale and control of its real estate, Copart earns double the operating profit margin of IAA. In the last three years, Copart has cumulatively grown its operating profit by 3x as much as IAA.
L'Oréal S.A. ( LRLCF )
While on the surface L’Oréal and Estée Lauder seem similar businesses, in challenging conditions their differences have become very apparent.
L’Oréal is the leading maker of beauty products, with around 13% global market share. It is 50% larger than #2, Unilever, and double the size of #3, Estée Lauder. Its size allows it to invest more in new products and marketing, to win an outsized share of consumers’ attention.
L’Oréal is often compared to Estée Lauder. Both companies are focused on the beauty market. They both still have sizeable ownership by - and influence from - their founding families. Over the last 15 years, they’ve both grown organically (excluding acquisitions) by around 6% p.a., well ahead of the global beauty market, and they earn a similar operating profit margin of 20%. The similarities end there. Two key aspects that distinguish L’Oréal from Estée Lauder are its breadth and its culture.
L’Oréal has always emphasised being present all around the world, in every beauty category (make-up, skincare, haircare) and at all price points from mass-market to luxury. Meanwhile, Estée Lauder puts most of its eggs in two baskets. Half of its sales come from skincare, which was its only profitable business in 2020, and as skincare sales started to decline there wasn’t much else to fall back on. The company has also been chasing growth in travel retail, which was a quarter of the company’s sales before it came undone during the pandemic.
There’s a reassuring consistency in how L’Oréal operates. It takes small, gradual measures each year to address any underperforming areas. Its management thinks and invests for the long term – e.g. in 2010, far ahead of its peers, its CEO committed to being a digitally native company and it has been rewarded with a higher market share in online beauty sales of 16%. Estée Lauder realised too late that it is overly exposed to selling through brick-and-mortar stores. It has booked over $1 billion of restructuring charges over the last decade as it scrambles to adapt to an increasingly online market.
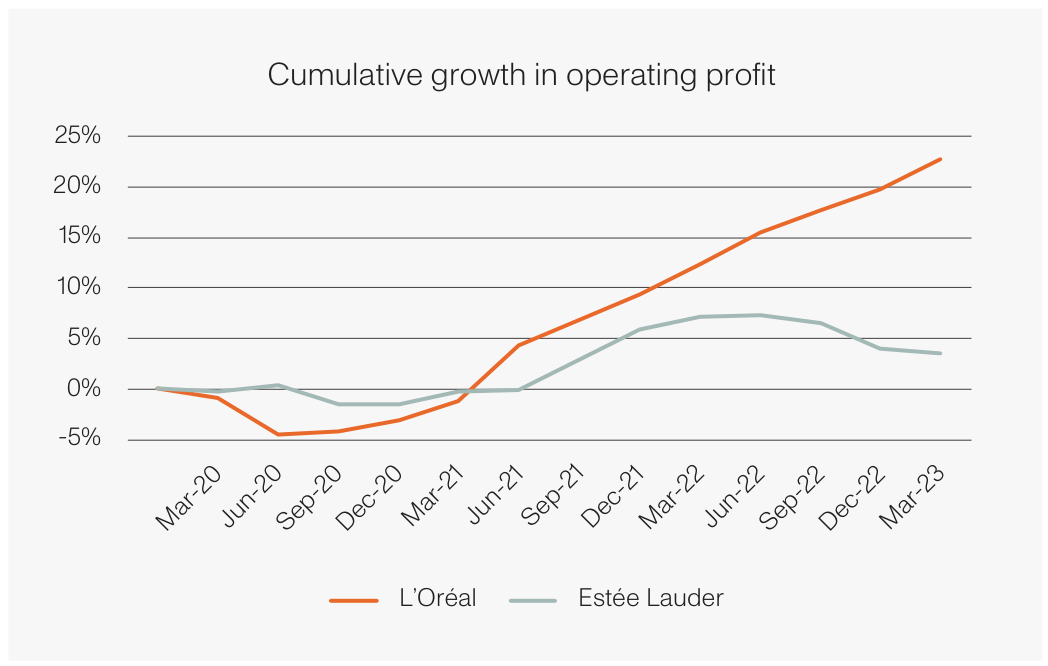
These differences may not have been as apparent in a normal year, but they are very visible through the last three years. Since 2020, L’Oréal’s operating profit has cumulatively grown by 7x as much as Estée Lauder, with the gap widening over time. And L’Oréal has grown across all regions and product categories, whereas Estée Lauder’s growth has primarily come from skincare and in China. Since that market came under pressure at the end of 2022, Estée Lauder’s operating profit has halved.
Conclusion
Businesses in the same industry are not created equal. At Aoris, we invest based on the characteristics of individual businesses, such as their scale, breadth and culture, and not the industry in which they operate.
We look for market-leading businesses with deep-rooted, competitive advantages, which become even more visible during tough conditions. We won’t settle for owning their peers if we don’t perceive them to be of sufficient quality, even if they trade on lower valuation multiples.
The rigour of our approach has been evidenced during these last three challenging years, with many of the Aoris portfolio companies continuing to outgrow not just their end markets, but also their strongest competitor. We expect the same outcome through whatever challenges may lie ahead.
| Important Information This report has been prepared by Aoris Investment Management Pty Ltd ABN 11 621 586 552, AFSL No 507281 (Aoris), the investment manager of AorisInternational Fund (Fund). The issuer of units in Aoris International Fund is the Fund’s responsible entity The Trust Company (RE Services) Limited ABN 45 003 278 831, AFSL Licence No 235150. The Product Disclosure Statement ((PDS)) contains all of the details of the offer. Copies of the PDS and target market determination are available at aoris.com.au or can be obtained by contacting Aoris directly. Before making any decision to make or hold any investment in the Fund, you should consider the PDS in full. The information provided does not take into account your investment objectives, financial situation or particular needs. You should consider your own investment objectives, financial situation and particular needs before acting upon any information provided and consider seeking advice from a financial adviser if necessary. You should not base an investment decision simply on past performance. Past performance is not an indicator of future performance. Returns are not guaranteed and so the value of an investment may rise or fall. |
Editor's Note: The summary bullets for this article were chosen by Seeking Alpha editors.
For further details see:
Aoris International Fund Q2 2023 Report