ARNC - Arconic: Fundamental Issues Coupled With No Margin Of Safety
2023-05-25 07:22:08 ET
Summary
- During its 3 years as a public-listed company, Arconic had not been profitable. This was due to annual one-off charges that may continue in the future.
- This is not a growth stock. Management even has concerns about the strategic contribution from 2 of its 3 business segments. I also have concerns about its financial strengths.
- There is no margin of safety based on a valuation using a cyclical lens and ignoring further one-off charges.
Investment Thesis
Arconic Corporation ( ARNC ) started as a public-listed company in 2020. While revenue had grown by about 2/3 since then, it had incurred losses for the past 3 years. But these losses were due to annual one-off charges. Without these, it would be profitable.
There are also concerns about its growth, financial strength and the strategic value of 2 of its business segments.
ARNC is a cyclical company. Despite its short history, its performance and valuation should be based on a cyclical lens. On such a basis and even assuming no further one-off charges, there is no margin of safety.
Thrust of my analysis
I will show that ARNC has fundamental issues and that there is no margin of safety at the current price.
ARNC was listed in 2020 following the split of its parent company into 2 public-listed companies. As such, we only have 3 years of operating history as a public-listed company. While the company provided some financials from 2017, the pre-2020 data were on a "pro forma" basis.
I thus faced the following challenges in valuing ARNC:
- Not sufficient data.
- Not all product segments are cyclical.
- For the cyclical segment, I had to differentiate between shipment volume and unit selling price.
The aluminum sector is a cyclical one and any analysis and valuation of ARNC should be via a cyclical lens. The challenge here was that even 2017 to 2022 was not a good representation of the cycle. A better one should start in 2011.
I thus had to build a cyclical picture based on the data of 2 peers that had similar products – Kaiser Aluminum (KALU) and Constellium SE (CSTM).
Secondly, although ARNC had 3 product segments, only one was cyclical. I used the sum-of-parts approach to aggregate the 3 segments’ earnings.
Finally, the cyclical revenue is a function of the shipment volume and unit selling prices. While unit selling prices are impacted by cyclical aluminum prices, shipment volume is driven by other factors.
I had to develop a financial model that linked revenue to these 2 factors. I also had to develop a regression equation linking the product selling price (dependent variable) to the aluminum price (independent variable).
Performance
ARNC comprised the rolled aluminum products, aluminum extrusions, and architectural products of the parent company. It has 3 reportable segments:
- Rolled Products. This segment produces aluminum sheet and plate products for the ground transportation, aerospace, industrial, building and construction, and packaging end markets.
- Building and Construction Systems ((BCS)). This segment focused on two product lines - architectural systems and architectural products.
- Extrusions. This segment produces a range of extruded products for the ground transportation, aerospace, and industrial markets.
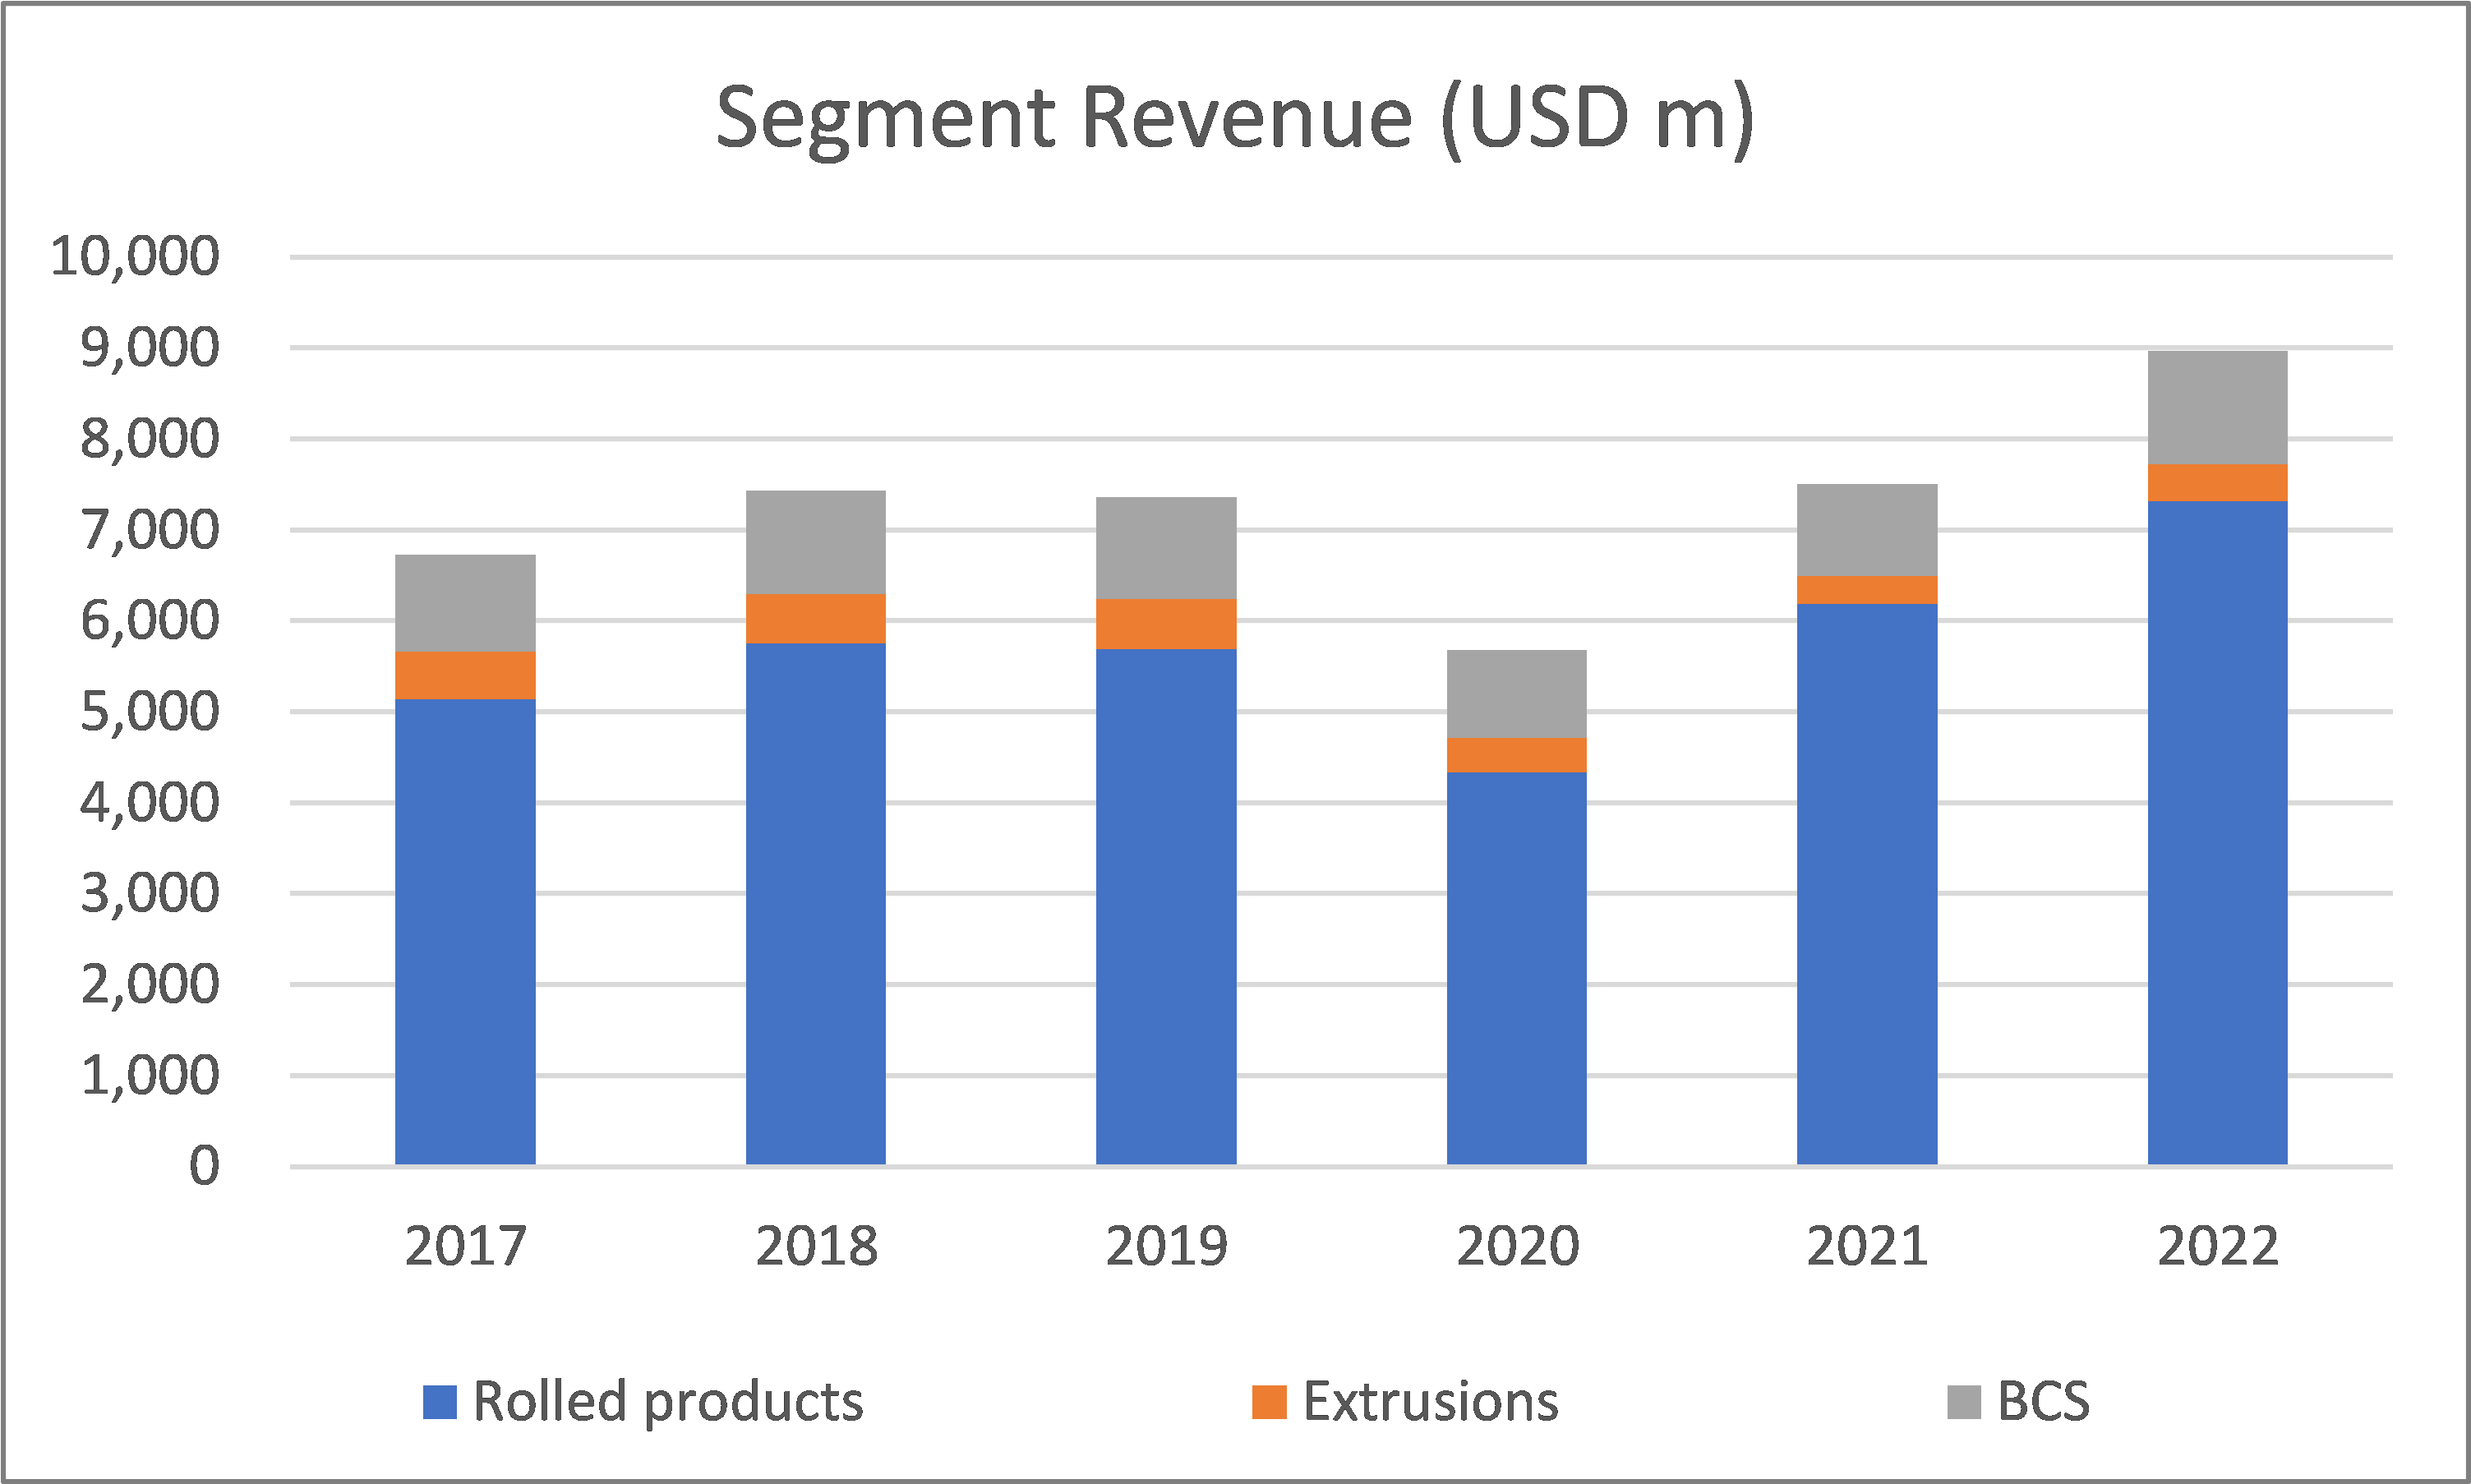
The Rolled Products segment is the largest revenue contributor with revenue growing at a 7.3 % CAGR from 2017 to 2022. The BCS segment was the next largest revenue contributor with 3.2 % CAGR during the same period. But the Extrusion segment revenue has been shrinking. The overall impact was that consolidated revenue grew at 5.6 % CAGR. Refer to Chart 1.
Chart 1. Segment Revenue Trends (Author)
But this revenue growth does not provide the full picture. In terms of shipment volume, the Rolled Products segment only grew at 1.8 % CAGR. Most of the segment revenue growth was price driven.
The Extrusion segment shipment volume shrunk by 8.4 % annually on a compounded basis. ARNC did not report physical shipment volume for the BCS segment. But if it did, I would not be surprised if this had low growth.
Annual one-off charges
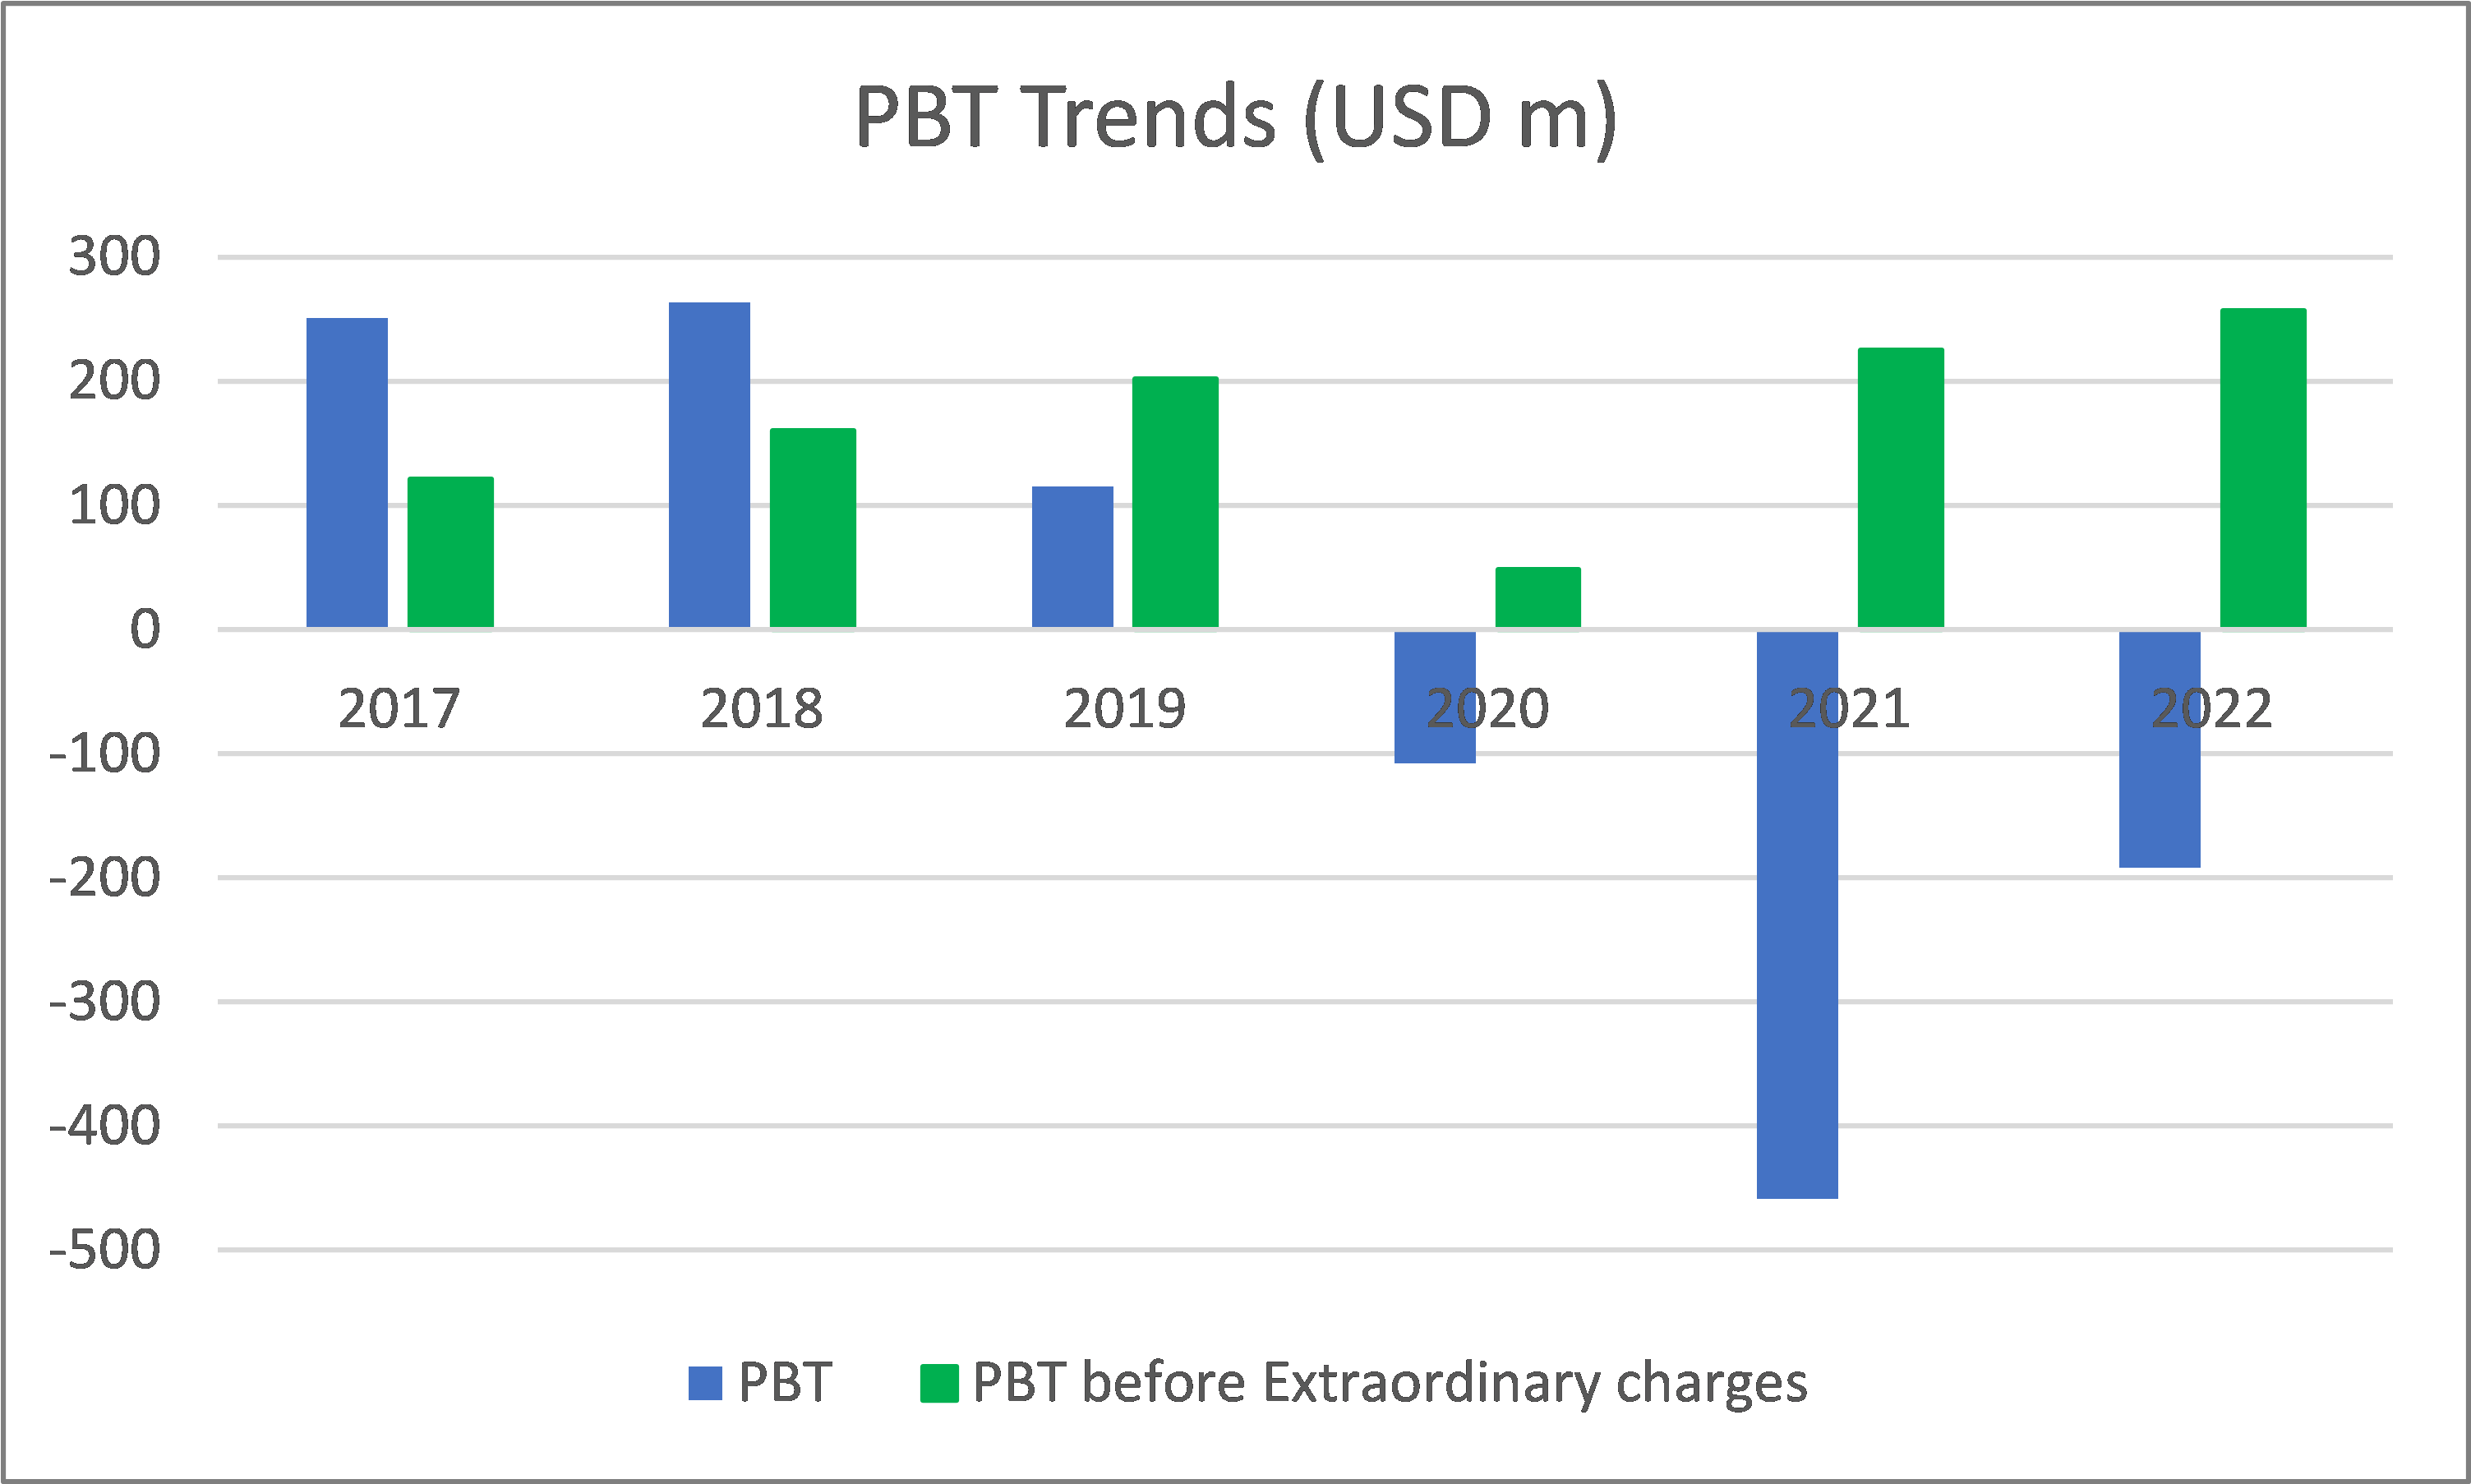
ARNC had been incurring losses since its listing. But this is a misleading picture as a significant part of the losses were due to one-off asset write-downs and restructuring charges. Refer to Chart 2. Excluding these, the company was profitable.
The past 3 years’ pre-tax one-off charges comprised the following:
- USD198 million for certain employee retirement benefits in 2020.
- USD 549 million for certain employee retirement benefits in 2021. There was also USD 65 million for the impairment of goodwill associated with the Extrusions segment.
- USD 306 million for the loss on sale of the Russian operations. Again another USD 92 million was for the impairment of long-lived assets in the Extrusions segment in 2022.
My concern is that some of the one-off charges may reoccur in the future. According to the company:
“An adverse decline in the liability discount rate, the lower-than-expected investment return on pension assets and other factors could affect...pension funding contributions in future periods.”
I also find it strange that the company incurred the asset impairments so soon following the split of the parent. Did it mean that ARNC overpaid for the assets in the splitting exercise?
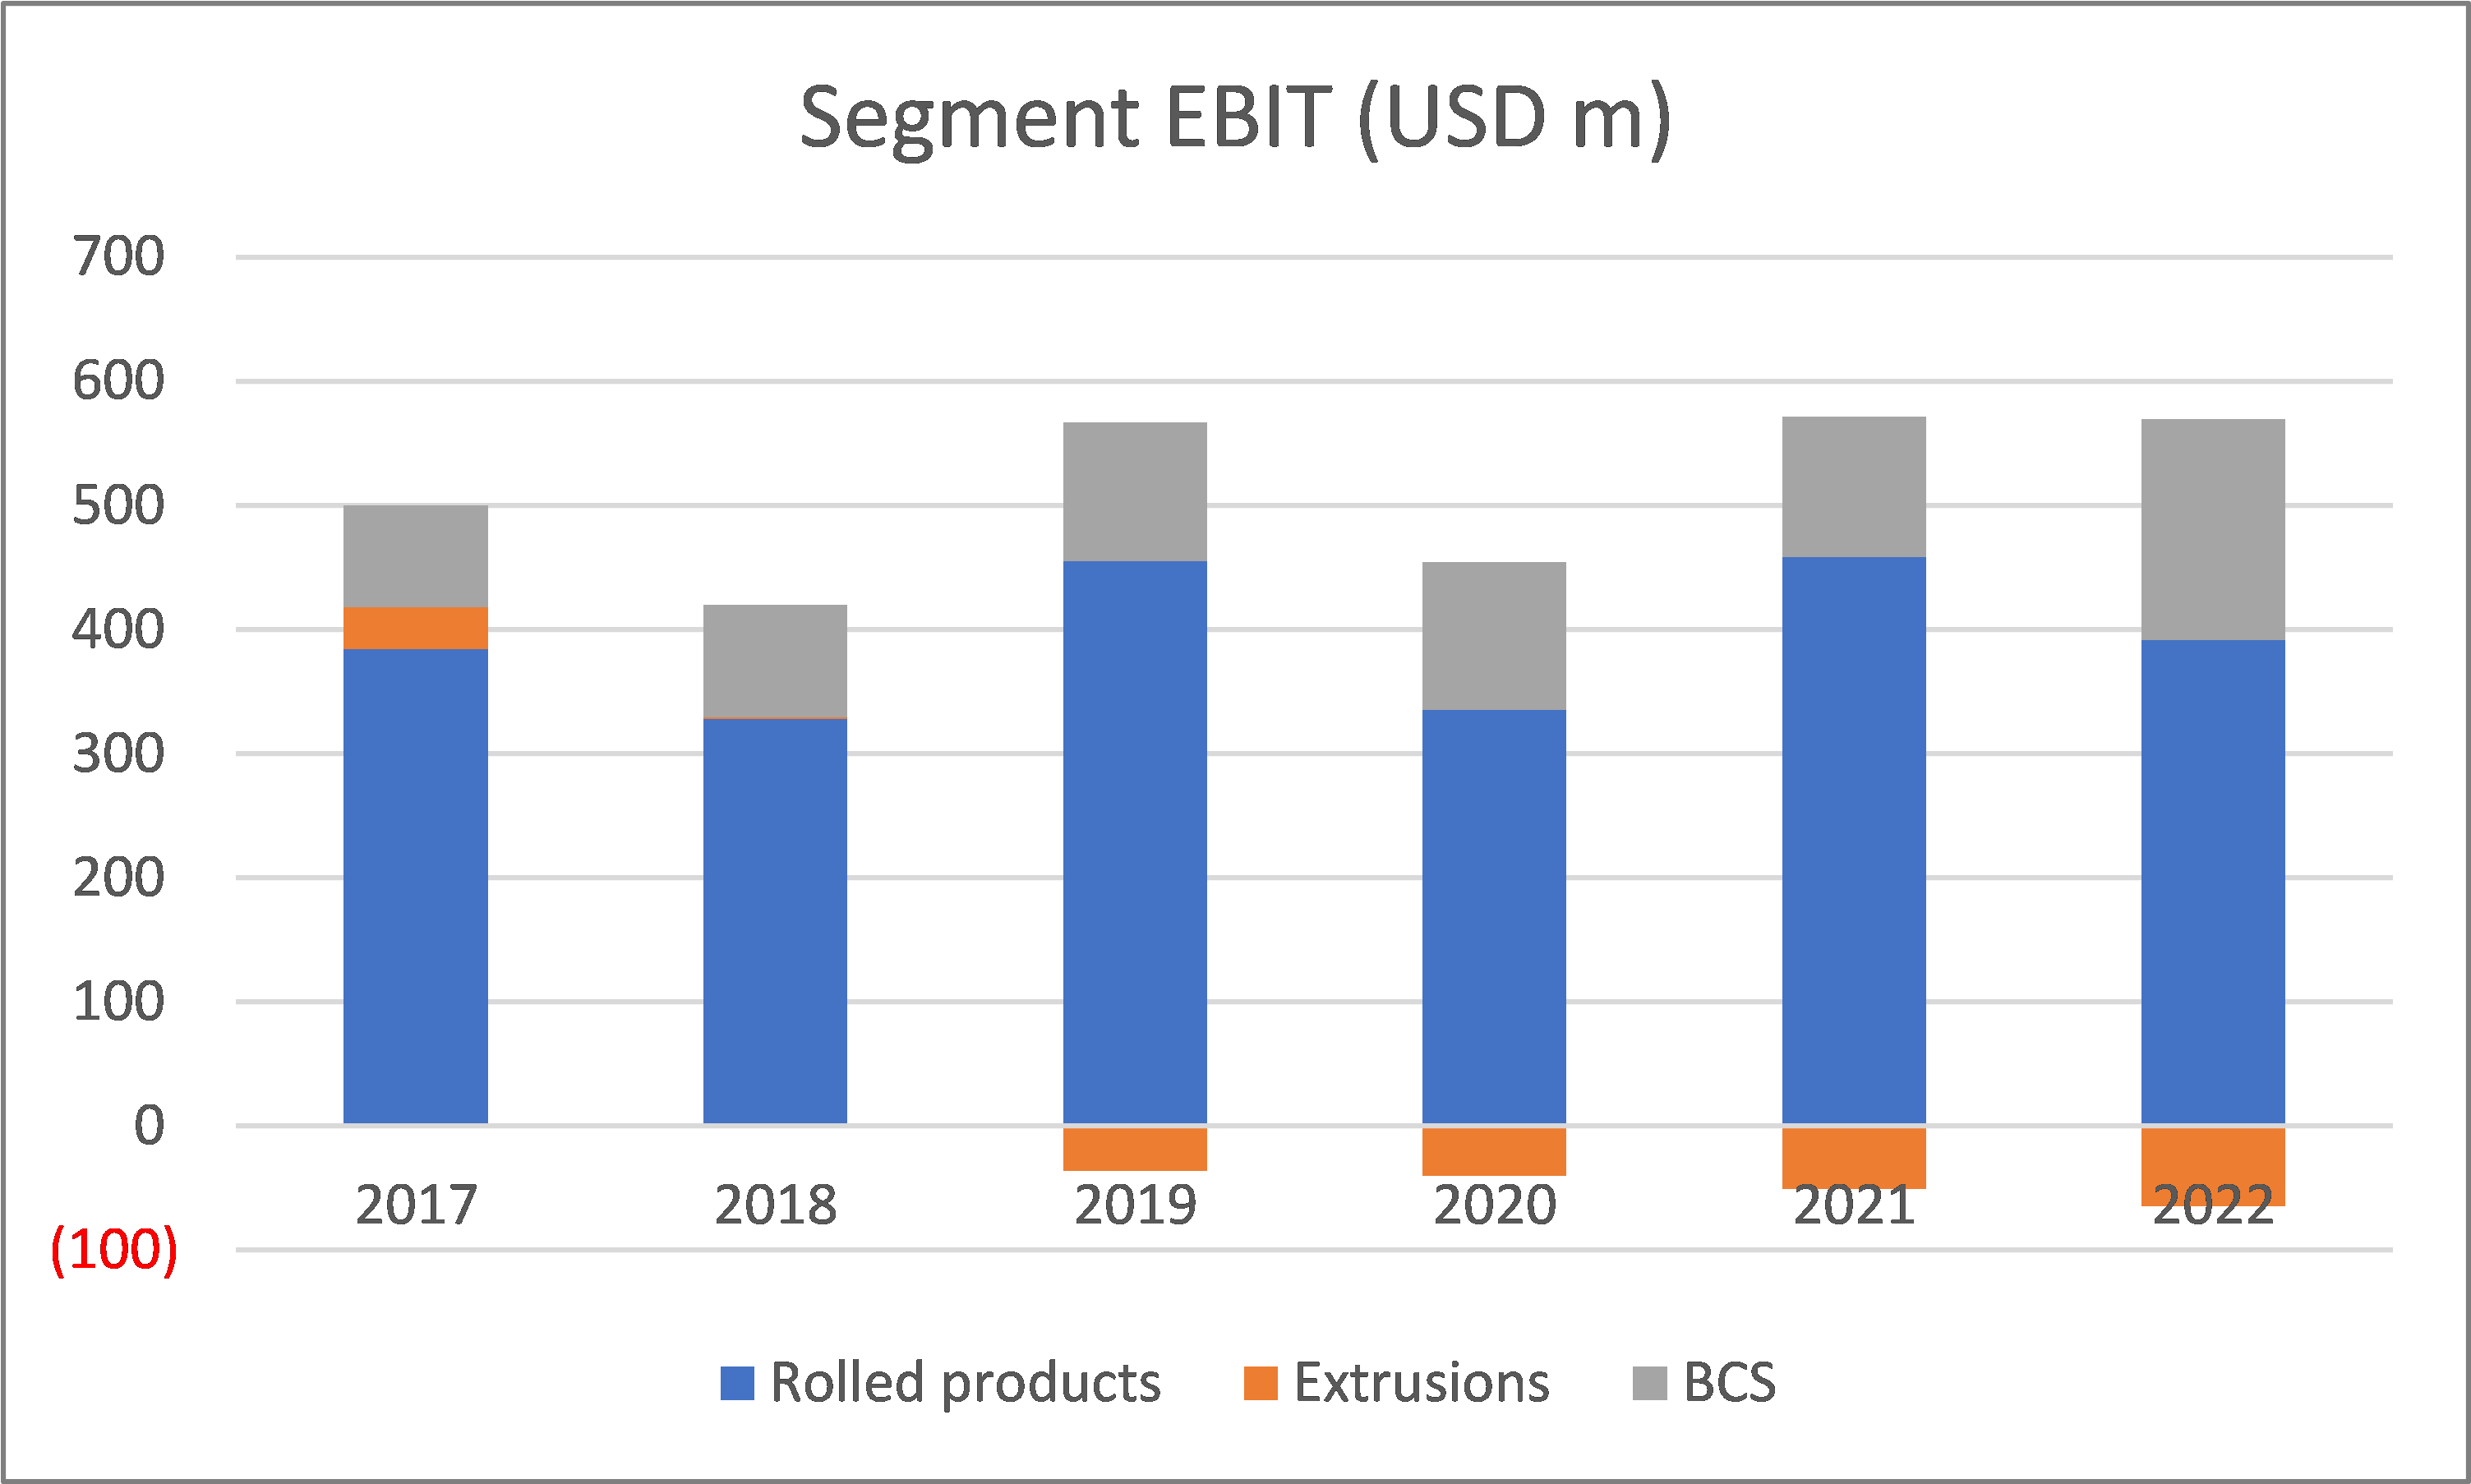
But even when looking at EBIT before the one-off charges, I found that the Rolled Products segment had a growth of 0.4 % CAGR. Not surprisingly, the Extrusion segment suffered losses over the past 4 years. Refer to Chart 3.
Chart 3: Segment EBIT Trends (Author)
Strategic reviews
The Extrusion segment’s shipment volume had been declining at a 4.6 % compounded annual rate since 2017. Management has been trying to address this segment problem as exemplified by the following from its 2022 Form 10K.
“…management initiated a business review of the Extrusions segment aimed at identifying alternatives to improve the financial performance of this segment...continues to assess alternatives and no decisions or commitments were made as of December 31, 2022.”
At the same time, management had concerns about the BCS segment.
“…the Company…is evaluating strategic options for the BSC segment… On August 2, 2022, the Company announced a pause in the sale process of this business due to current economic conditions…”
I was surprised by the BCS strategic review as this segment EBIT in 2022 was double that in 2017. Refer to Chart 3. Even its EBIT margins had doubled.
The are 2 implications with the low shipment volume growth and the possible divestments of the Extrusions and BSC segments:
- I would not model ARNC as a growth company.
- There may be future one-off charges.
Financial position
I also have concerns about ARNC’s financial strengths.
It took on a large Debt as part of the parent company splitting exercise. As of the end of Dec 2022, ARNC had a Debt Equity ratio of 1.2. This puts it in the middle position relative to its peers as shown in Table 1.
You can also see its relatively high Leverage and low interest coverage ratio.
Table 1: Peer Financials (Author)
On the positive side, the total Cash flow from Operations from 2017 to 2022 amounted to USD 1.1 billion. This was much larger than the total Cash flow used in Investing amounting to USD 0.86 billion during the same period.
Given this financial position, I am surprised that the company still repurchased shares in the past 2 years.
Cyclical sector
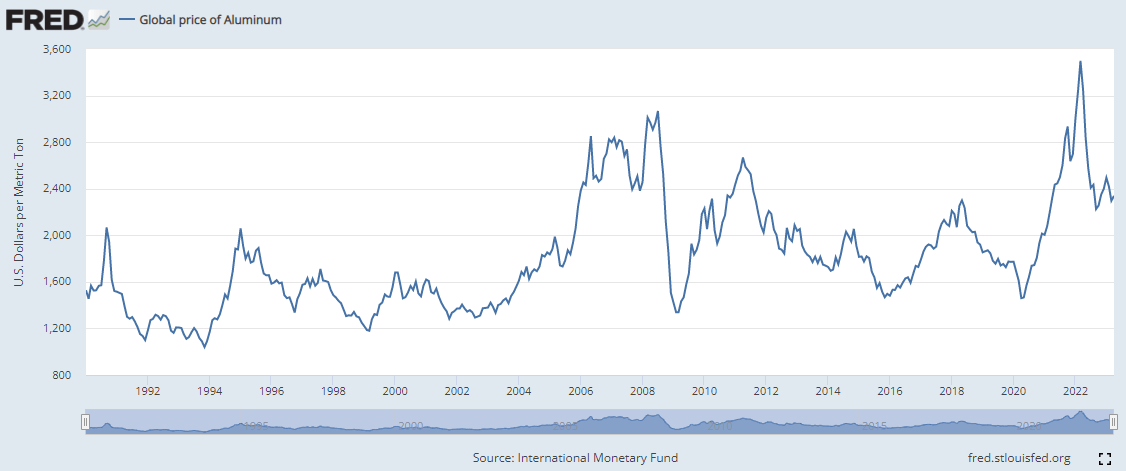
The aluminum sector is cyclical. Chart 4 illustrates this. You can see that while cyclical, there is a long-term price uptrend. But this was not a fantastic growth rate. From Jan 1990 to Jan 2023, prices grew at 2.3 % CAGR. This is not a growth sector. We have a low-growth company in a low-growth sector.
Chart 4: Aluminum Price Trends (FRED)
Valuation of cyclical companies.
Damodaran opined that the value of cyclical companies is often more dependent on the movement of the commodity price than on firm-specific characteristics. Valuing such companies based on their current earnings can lead to a misleading picture.
We should thus look at the “normalized” earnings over the cycle. If you look at Chart 4, it is obvious that any average from 2017 to 2022 would not be representative of the cyclical value as:
- The 2022 prices seem extraordinarily high.
- The period did not cover enough cycles.
A more appropriate duration would be from 2011 to 2017. The challenge is that there is not enough data for ARNC for this period.
Damodaran suggested that if there is not sufficient data for a particular company, we should use industry data.
In the case of ARNC, there are only 2 peers listed in Table 1 that appear to be a good fit. These were KALU and CSTM. This is because the other companies had bauxite and alumina operations.
ARNC cyclical performance
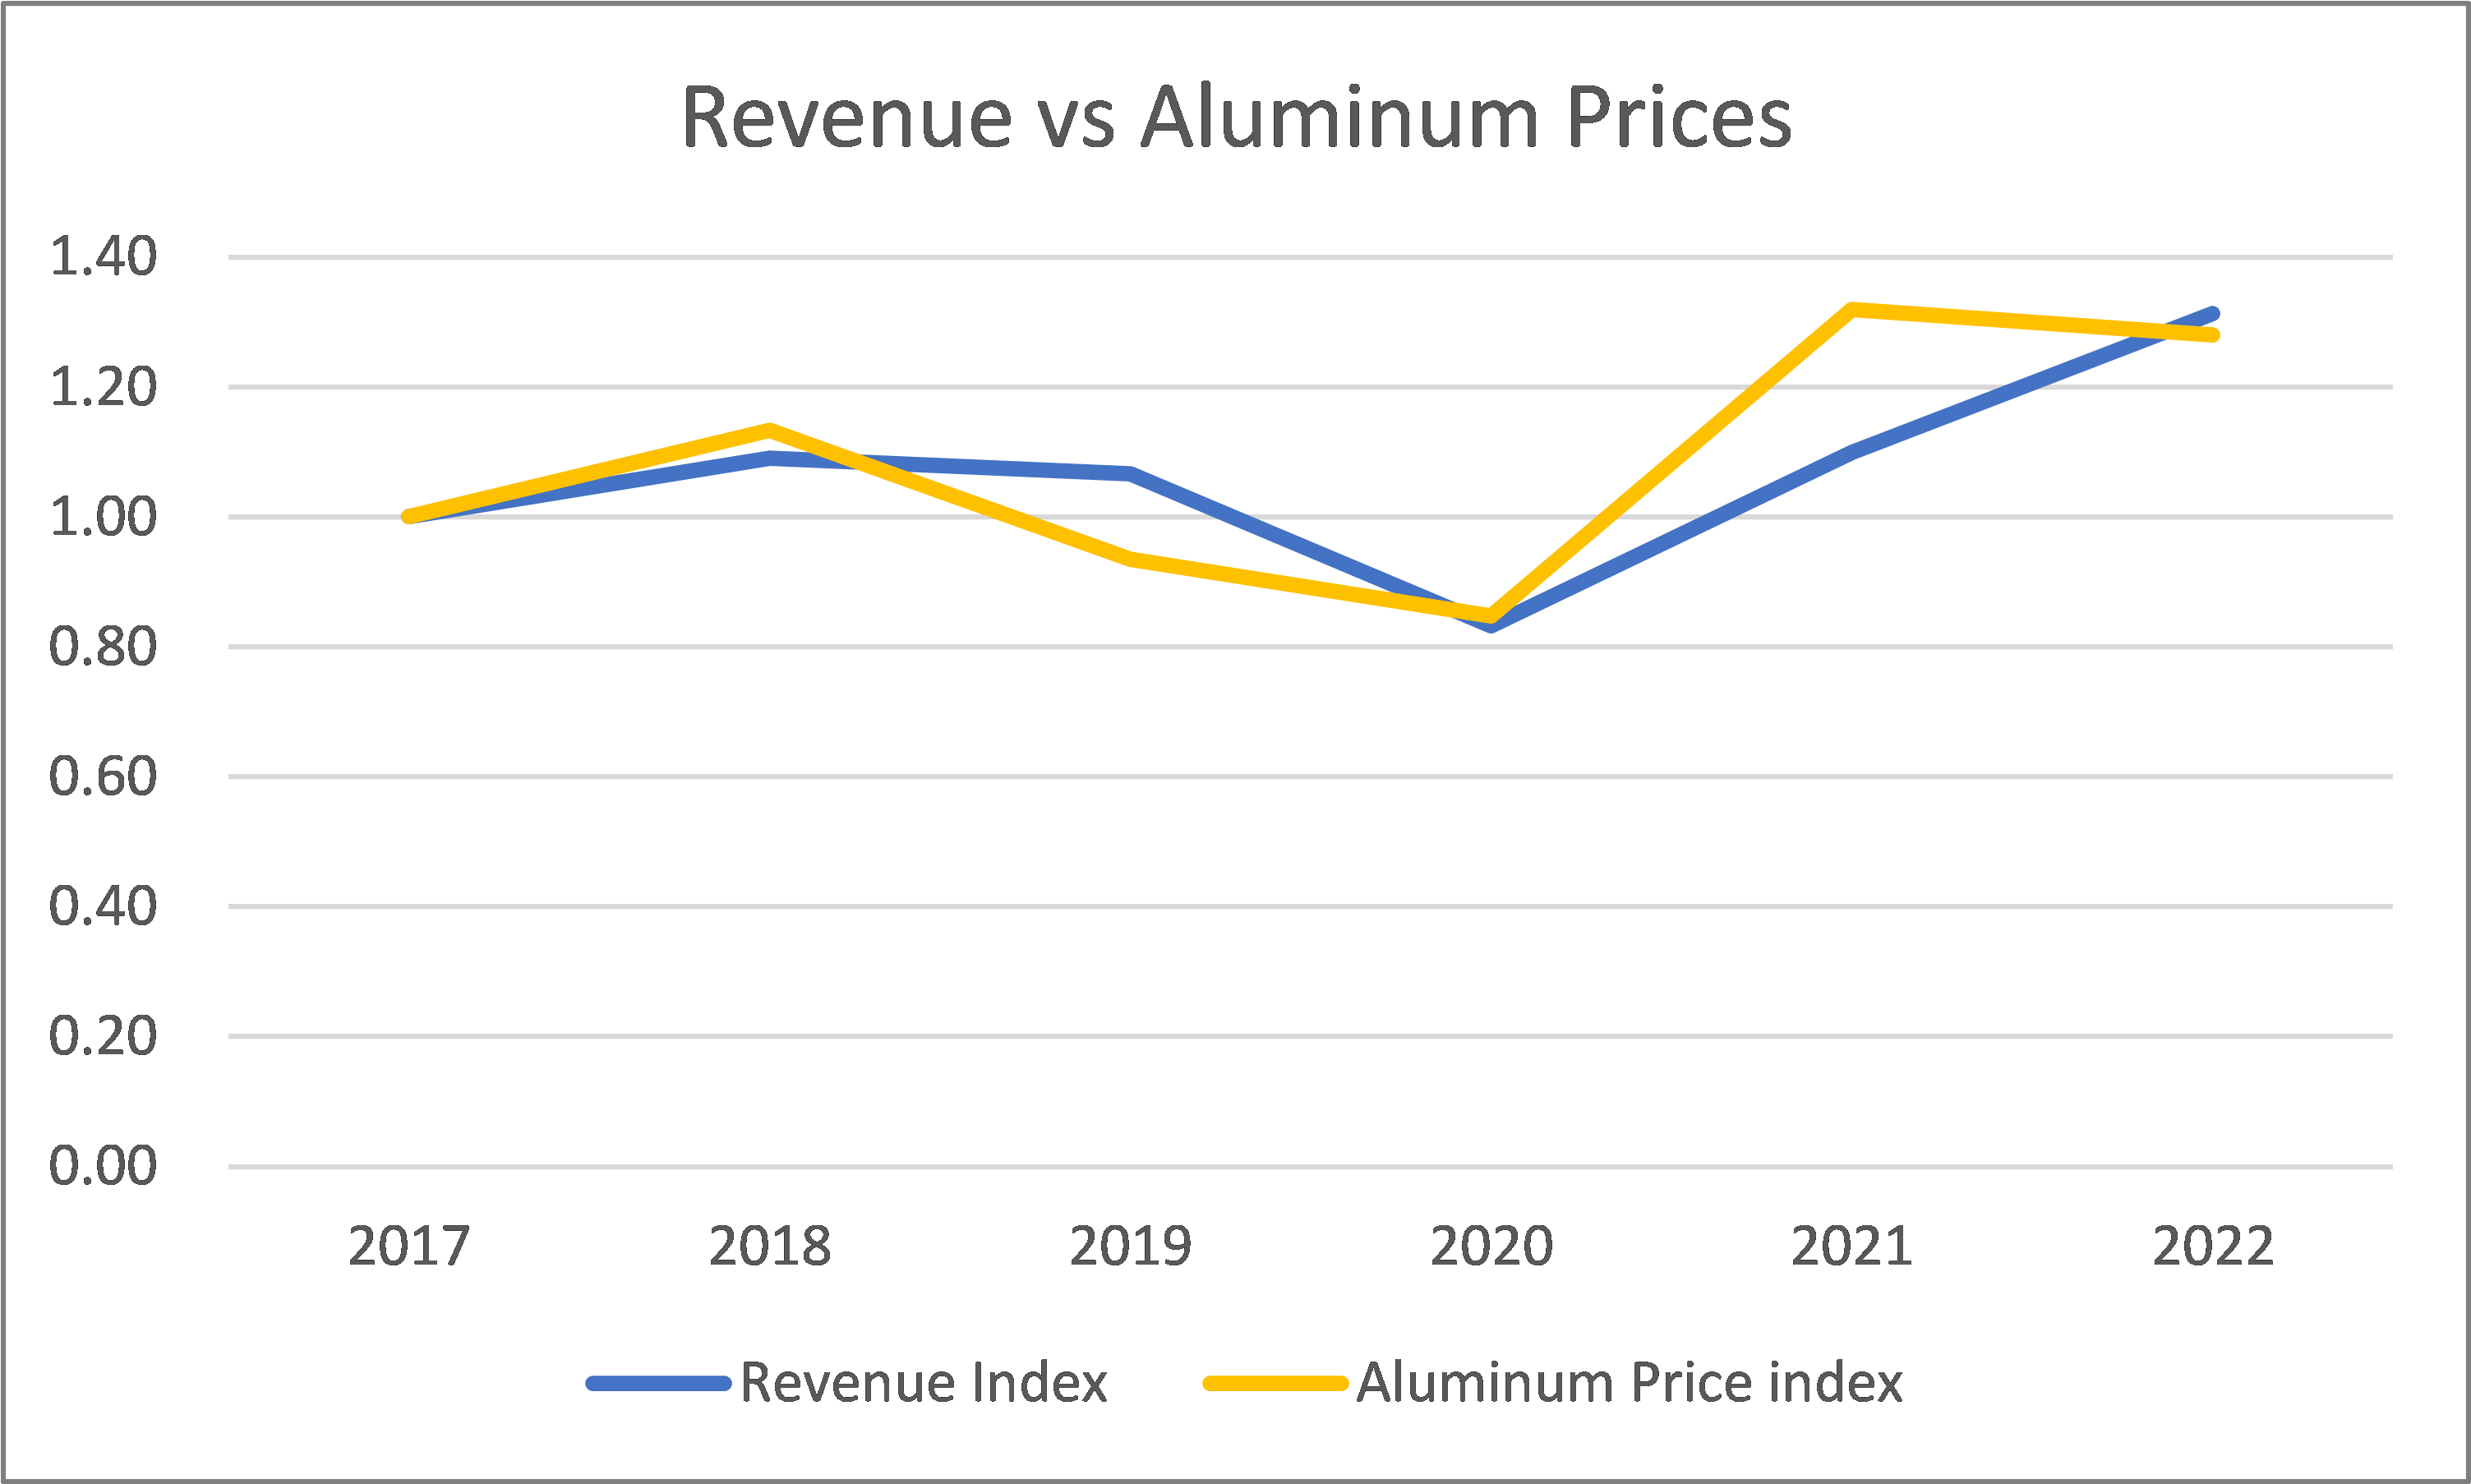
Chart 5 illustrates the link between ARNC revenue and aluminum prices. There is a 0.8 correlation between them confirming that ARNC is a cyclical company.
Chart 5: Revenue vs Aluminum Price (Author)
Notes to Chart 5:
a) To be able to chart the 2 metrics together, I had to convert them into indices. The index value of a particular year is the value for the year divided by the respective 2017 value.
b)The aluminum price was based on the FRED Global aluminum price.
But ARNC has 3 product segments. The surprising finding is that only the Rolled Products segment revenue seemed to be correlated with aluminum prices. Refer to Table 2. I only consider the correlation as significant if it is at least 0.7.
Table 2: Segment Revenue Correlation (Author)
Note to Table 2. The correlation covers the respective segment revenue from 2012 to 2022 with aluminum prices.
Because of the correlation results, I modeled the:
- Extrusions and BSC segments as non-cyclical ones.
- Rolled Products segment as a cyclical one.
For the Rolled Products segment, this meant breaking down the revenue into shipment volume and selling prices. The shipment volume would depend on customer demand while selling prices would be linked to the cyclical aluminum prices.
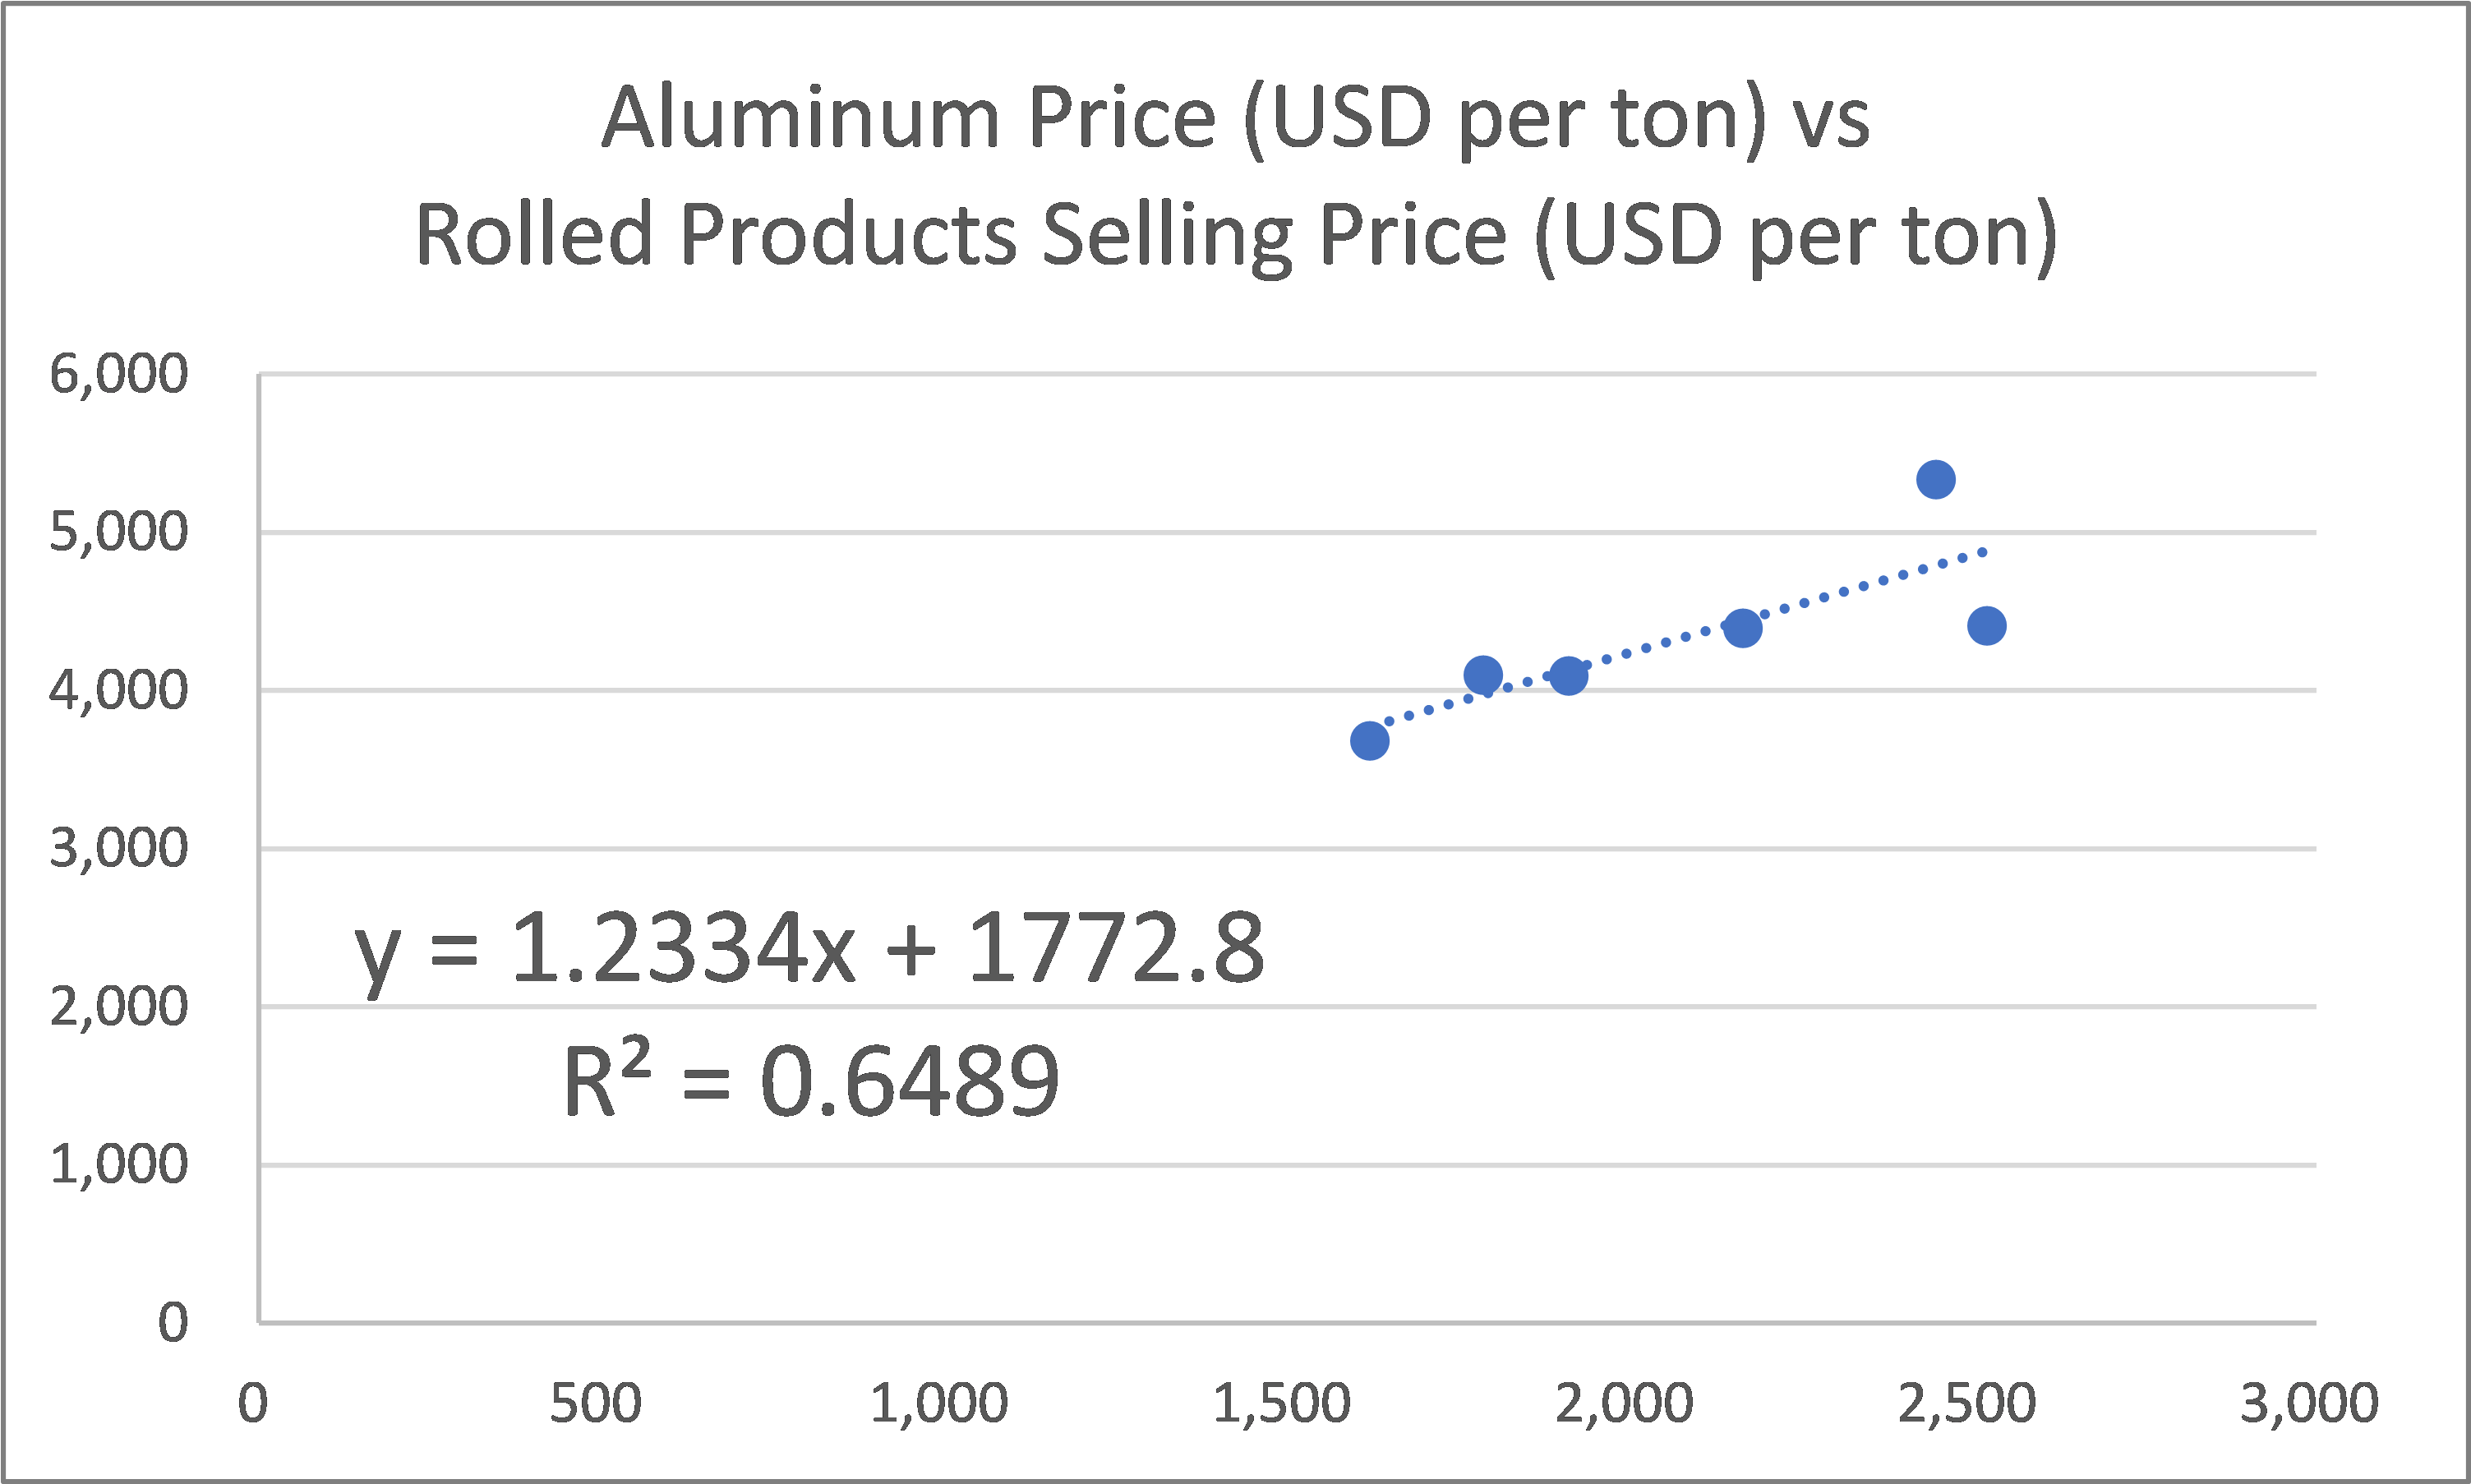
To determine the relationship between aluminum prices and the Rolled Products segment unit selling prices, I used EXCEL. The result is shown in Chart 6 with the following equation:
Rolled Product unit selling price = (1.2334 X Aluminum price) + 1772.8.
You can see that the equation can explain about 65 % of the changes in the Rolled Products segment unit selling price.
Chart 6: Determining the Regression Equation (Author)
Valuation
I valued ARNC based on the Earnings Power Value because of the low growth picture.
I focused on 2 scenarios:
- Scenario 1 – 2020 to 2022 average shipment volume with the average cycle Factor.
- Scenario 2 – Best shipment volume with best cycle Factor
Table 3 summarizes the results.
You can see that there is no margin of safety from a cyclical perspective under Scenario 1. Even the margin of safety under Scenario 2 is not sufficient.
Table 3: Summary of Valuation (Author)
Note to Table 3: The Cycle Factor refers to the multiple to scale the 2017 to 2022 average margin to represent the margin over the 2011 to 2022 cycle. Refer to the explanation in the following sections.
Valuation model
I valued ARNC based on the Free Cash Flow to the Firm (FCFF) model.
Value of the operating assets of the firm = FCFF / WACC
Where:
FCFF for Earnings Power Value = EBIT X (1 – t)
EBIT was a sum-of-parts EBIT with the Rolled Products segment EBIT based on my financial model.
t = average 2016 to 2018 tax rate. This was because these were the only periods where the company had positive earnings.
WACC = weighted average cost of capital derived from the first page of a Google search for the term “Arconic WACC” as summarized in Table 4.
Value of Equity = value of operating assets of the firm + Cash – Minority Interests – Debt.
Table 4: Deriving the WACC (Various)
EBIT for Rolled Products segment
Table 5 illustrates a sample calculation for the EBIT of the Rolled Products segment. The key inputs for this model are:
- The shipment volume.
- The cyclical unit selling price. This is dependent on the cyclical aluminum price. I used the regression equation shown in Chart 6 to determine the selling price. I used the 2011 to 2022 average aluminum price to represent the price over the cycle.
- The Cycle Factor. This is because ARNC only has data from 2017 to 2022.
Table 5: Deriving the Rolled Products EBIT (Author)
The cyclical EBIT for the Rolled Products segment = Revenue X (2017 to 2022 EBIT margin) X Cycle Factor
I determined the Cycle Factor as shown in Table 6. This Factor was to scale 2017 to 2022 average margin to represent the margin over the 2011 to 2022 cycle.
Table 6: Deriving the cycle Factor (Author)
Table 7 shows a sample calculation to determine the Earnings Power Value and the other assumptions used. You can see that I have modeled the Extrusions and BCS segments as non-cyclical ones by using the average past 3 years EBIT.
Table 7: Calculating the Earnings Power Value (Author)
Risks and limitations
The crux of my valuation is that part of ARNC business is cyclical. If you use the current prices for the cyclical portion, you would not be following Damodaran.
Having said that, you should consider the following when looking at my valuation:
- Non-cyclical WACC.
- Small number of data points.
- Computed EBIT.
- No further one-off charges.
The WACC used is based on the current situation of high inflation, a possible recession, and the Ukraine invasion. If I am going to value the company over the cycle, you could argue that I should use the cyclical WACC. The risk-free rates and the equity risk premiums would probably be lower. This meant that my valuation is conservative.
I had only 6 years of data points to develop my regression equation. With an R2 of 0.65, the aluminum prices only account for 2/3 of the changes in the unit selling prices for the Rolled Products segment. More data points would affect the regression equation and ultimately the EBIT. The impact could be positive or negative.
The company provided EBITDA and depreciation data for each segment from 2020 to 2022 in its Form 10K. I used these to compute the EBIT. But for 2017 to 2019, the Form 10K only provided the Operating profit by segments. I equated these to the EBIT.
Over the past 3 years, the company incurred an average of USD 99 million per year for one-off charges. These were mainly for assets write-down and shortfall in the retirement funds. I have assumed that there would not be any further charges for these. Looking at Table 7, item ad, you can see that the one-off charges can be significant. Ignoring them meant that my valuation is on the high side.
Given all the above plusses and minuses, I would look for at least a 30 % margin of safety when considering whether to invest in ARNC.
Conclusion
2 issues with ARNC make me avoid investing in the stock.
First, I had concerns about its fundamentals.
- It is not a growth company as it had low shipment growth in a low-price growth sector.
- There were large annual one-off charges over the past 3 years that caused it to be unprofitable. It appears that this may not be the end of the story.
- I also have concerns about its financial strength and some of the management decisions.
Secondly, an Earnings Power Value valuation showed that there is no margin of safety. I considered shipment volume and unit selling prices as independent parameters for the Rolled Products segment. This provided a better picture to see the impact of the aluminum price cycle.
Furthermore, only the Rolled Products segment was modeled as a cyclical one. The other 2 segments were treated as non-cyclical because the data showed them to be the case.
I am confident my sum-of-parts model provided a more realistic picture of ARNC value than using multiples based on the consolidated earnings.
For further details see:
Arconic: Fundamental Issues Coupled With No Margin Of Safety