MOON - ARKF: Up 43% YTD But Here's Why You Should Sell (Rating Downgrade)
2023-06-14 13:26:48 ET
Summary
- ARKF typically selects 35-55 global FinTech stocks that have the potential to disrupt the Financial Services sector. Up 43% YTD, ARKF now manages over $900 million in assets.
- However, investors shouldn't push their luck. ARKF is the fourth-worst ETF on the market in terms of profitability. There's plenty of downside risk if market sentiment turns negative again.
- ARKF investors should be traders. The statistics presented next, based on decades of research, demonstrate how holding a portfolio like ARKF for anything longer than one year is ill-advised.
- Therefore, I recommend selling ARKF now to pocket some profits, and potentially use the proceeds to buy a safer growth ETF like QQQ.
Investment Thesis
The ARK Fintech Innovation ETF ( ARKF ) has outpaced the SPDR S&P 500 ETF ( SPY ) by 29.45% in 2023 and by 10.77% since I suggested traders take a short-term position in the risky fund through the Q1 earnings season. Based on my fundamental analysis and interpretation of current market sentiment, there is still more potential upside ahead. However, shareholders are pushing their luck. I recommend taking profits before the inevitable occurs: markets get jittery and target the riskiest, speculative assets, which are many of ARKF's top holdings.
ARKF Overview: When To Buy And Sell
ARKF typically selects 35-55 companies involved in transaction innovation, blockchain technology, risk transformation, frictionless funding platforms, customer-facing platforms, and new intermediaries. ARKF is actively managed by Cathie Wood and her team at ARK Investment Management and has a 0.75% expense ratio. Up 43% YTD, ARKF manages $914 million in assets.
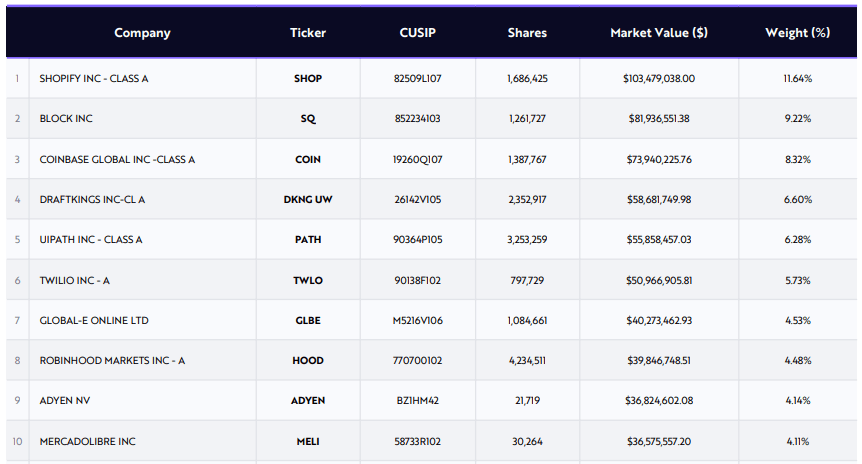
Shopify ( SHOP ), Block ( SQ ), and Coinbase Global ( COIN ) are the fund's top holdings, totaling 29%. I've listed the top ten below; the entire listing is available for download on ARKF's fund page . There has been little activity since my last review, with weighting changes of less than 1% per security.
ARK Invest
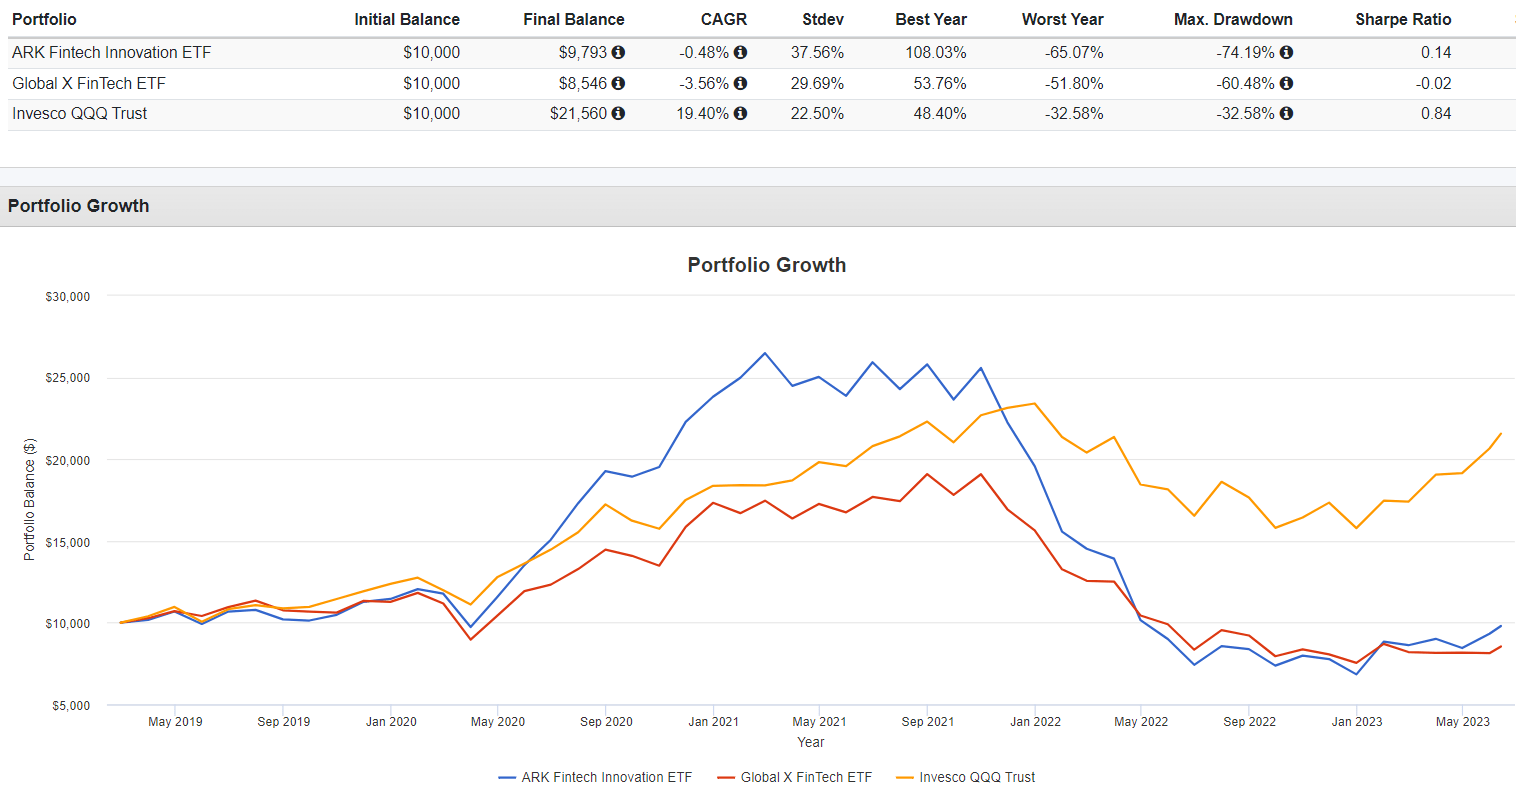
The Global X FinTech Thematic ETF ( FINX ) is one of ARKF's competitors. I previously used the Invesco QQQ ETF ( QQQ ) as an example for those wanting a safer and less expensive growth fund. Here is how the three have performed since ARKF launched in February 2019.
Seeking Alpha
ARKF outperformed FINX by 3.08% per year, but it's still yet to break even. Meanwhile, QQQ delivered an annualized 19.40% and was much more stable, leading to a strong 0.84 Sharpe Ratio.
When investors buy ARKF, they're looking for a home run similar to the 108% gain in 2020. The trick is to be mindful of what typically happens next to speculative, unprofitable baskets of stocks: gains are quickly wiped out, often in just a year or two. That's what happened with ARKF, as it lost 17.82% and 65.07% in 2021-2022.
Portfolio Visualizer
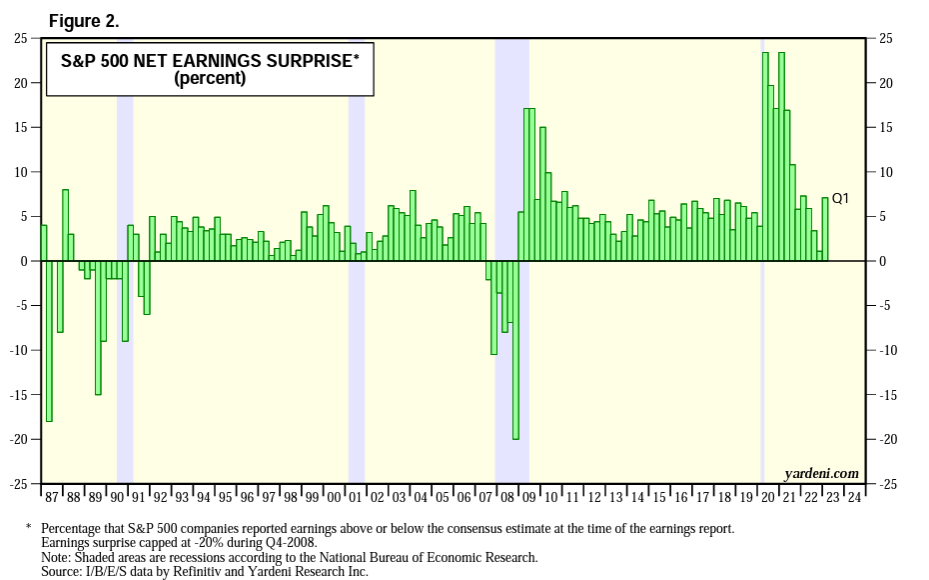
Realize that 2020 conditions were rare and weren't all related to COVID-19. The key is analyzing and understanding market sentiment, and one way is to study earnings surprise trends. A benchmark is the aggregate S&P 500 earnings surprises tracked quarterly by Yardeni Research . Notice how earnings surprises were close to or above 20% from Q2 2020 to Q2 2021, something we last came close to in 2009 when QQQ gained 55%.
Yardeni Research
That means one year of overwhelmingly positive headlines encouraging investors to buy into the hype. Low-profitable stocks have occasionally performed well for decades, but only recently were they packaged nicely into thematic ETFs. Consider the following statistics from the Ken French Data Library on equal-weighted portfolios formed on operating profitability:
1. The bottom 30% portfolio (lowest operating profitability) outperformed the top 30% portfolio (highest operating profitability) by 37.56% in 1999 at the height of the dot-com bubble. What followed in 2000 was a 23.35% underperformance, effectively undoing the prior year's gains.
2. The bottom 30% portfolio outperformed the top 30% portfolio by 53.34% in 2003, gaining 103.56%. What followed were five consecutive years of underperformance through to 2008. Investors holding the entire period from 2003-2008 would earn 26.91% compared to 41.69% for the top 30%.
3. The bottom 30% portfolio outperformed the top 30% portfolio by 9.44% in 2009, gaining 77.86% as markets recovered from the Great Financial Crisis. There was also a modest 4.22% outperformance in 2010, but it missed by 7.87% in 2011. The bottom 30% portfolio also lagged in the high-single-digits in 2016 and 2018. Investors holding from 2009-2019 would still do well, gaining 324%. However, the top 30% portfolio gained 410%.
4. The bottom 30% portfolio beat the top 30% portfolio by 35.06% in 2020. However, these gains quickly reversed in 2021-2022 by 25.52% and 20.97% in 2021-2022, just like with ARKF. These translate to annualized gains of 2.11% for the bottom 30% portfolio vs. 10.78% for the top 30% portfolio.
5. In the 25 years between 1999-2023, the bottom 30% averaged a 13.30% gain compared to 13.53% for the top 30%. This may lead you to believe that the operating profitability metric has no value. However, compounded returns for the two portfolios were 614% and 1,305%. In other words, the high-profitability portfolio is the better choice as soon as you extend your holding period beyond one year. The bottom 30% portfolio is for traders, not investors, and the same is true for ARKF. To illustrate, let's look at the profitability of its components next.
ARKF Analysis
Profitability
ARKF has a 4.48/10 Profitability Score, which I derived using individual Seeking Alpha Profitability Grades, normalizing them on a ten-point scale, and then weighting them accordingly. To explain how poor this is, I made the same calculations for 800+ U.S. Equity ETFs, and ARKF scored the fourth-lowest. It's in good company, too. The Roundhill MEME ETF ( MEME ) and the Direxion Moonshot Innovators ETF ( MOON ) are the worst at 3.48/10 and 3.60/10. The SPDR S&P Oil & Gas Equipment & Services ETF ( XES ) is third at 3.79/10, followed by a host of thematic ETFs, including these:
- ALPS Clean Energy ETF ( ACES ): 4.53/10
- ProShares S&P Kensho Cleantech ETF ( CTEX ): 4.75/10
- ARK Next Generation Internet ETF ( ARKW ): 4.95/10
- ARK Innovation ETF ( ARKK ): 5.17/10
- SPDR Kensho Clean Power ETF ( CNRG ): 5.27/10
Specifically to ARKF, only 57% of its holdings by total weight are cash flow positive over the last twelve months, and 29% have positive EBITDA margins. In contrast, QQQ's figures are 99% on both metrics. Therefore, I have no doubt ARKF would easily fall into that "bottom 30%" category.
Fundamentals
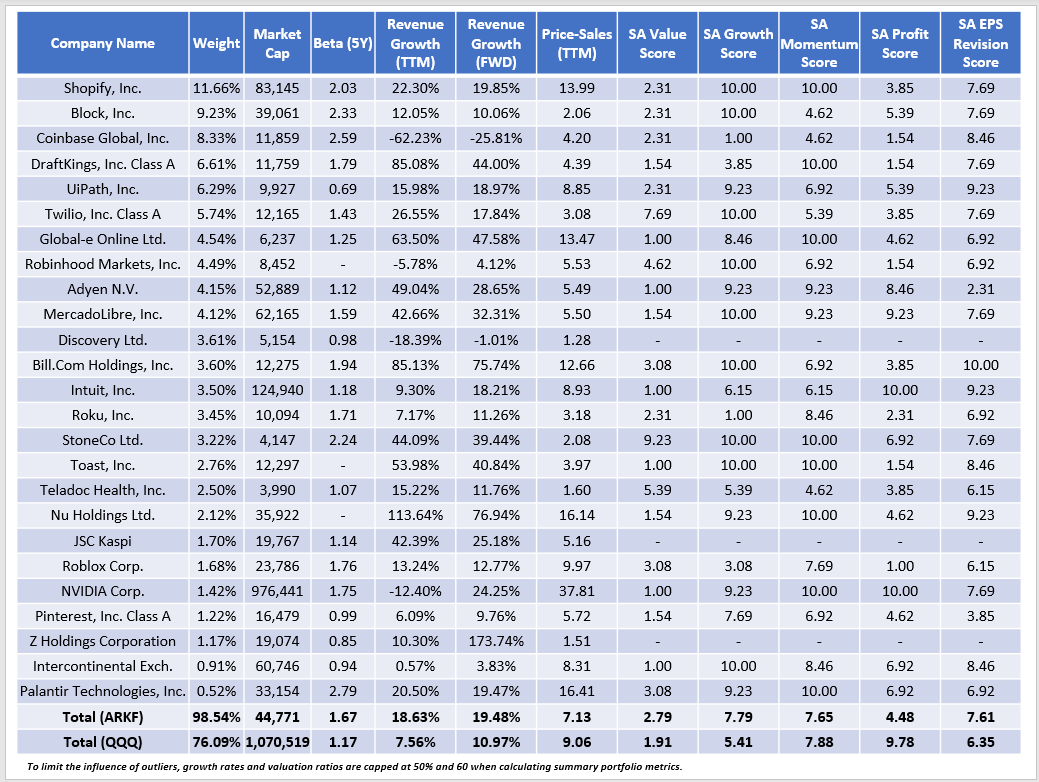
Where ARKF lacks in profitability and valuation, it excels in growth. The following table summarizes the portfolio's top 25 holdings.
The Sunday Investor
ARKF's Seeking Alpha Growth Score is 7.79/10 and has a 19.48% estimated one-year sales growth rate, both in the top 3% of all ETFs in my database. QQQ's estimated growth rate is just 10.97%, or about half of what it was in January 2022, so there are fewer growth opportunities than before. This is why investors are now leaning into more speculative stocks like those held in ARKF. Growth is in short supply, and thematic ETFs like ARKF are an easy way to gain exposure.
Still, one quarter's worth of above-average earnings surprises doesn't justify ARKF's 43% YTD price gain. It's not yet an upward trend, but shareholders are effectively betting it is. Even if Q2 2023 brings another 7% earnings surprise, we're far from the 15% and 20% figures we had in 2009 and 2020. I don't imagine there's much upside left, but as demonstrated earlier, these speculative companies have plenty of downside risks.
Investment Recommendation
Assigning a rating was difficult because I recognize how the market favors the growth factor. ARKF's 19.48% estimated sales growth rate is nearly double that of QQQ, and the ETF may continue to soar if the Q2 earnings season is successful. However, I settled on a "sell" rating to emphasize ARKF's downside risks. Low-quality portfolios like these are best for trading, not investing, and since ARKF is up 43% YTD based on just one quarter's worth of above-average earnings surprises, taking profits is only prudent. Thank you for reading, and I look forward to providing another update next quarter.
For further details see:
ARKF: Up 43% YTD, But Here's Why You Should Sell (Rating Downgrade)