ISCF - Asset Class Mean Reversion: Review And Outlook
Summary
- My December 2019 article, “Mean Reversion + Valuation = Opportunity,” cited cheap, out of favor assets including U.S. value and small caps, international, emerging markets, natural resources, MLPs and gold.
- All 13 asset classes outperformed the S&P 500 in 2022. Two of three U.S. sectors and two of three natural resources sectors beat the S&P over the last three years.
- International stocks lagged significantly over three years but outperformed in 2022.
- Mean reversion may be in the early innings, given several favorable factors.
- Not a trading opportunity, rather buy and hold for patient investors as part of an all-weather portfolio.
Here we review key findings from the article above and the sequel, Seeking Alpha editors’ pick Mean Reversion + Valuation = Portfolio Opportunities . Then we explore clues to what might lie ahead.
Mean Reversion Assets Looked Bad In Late 2019
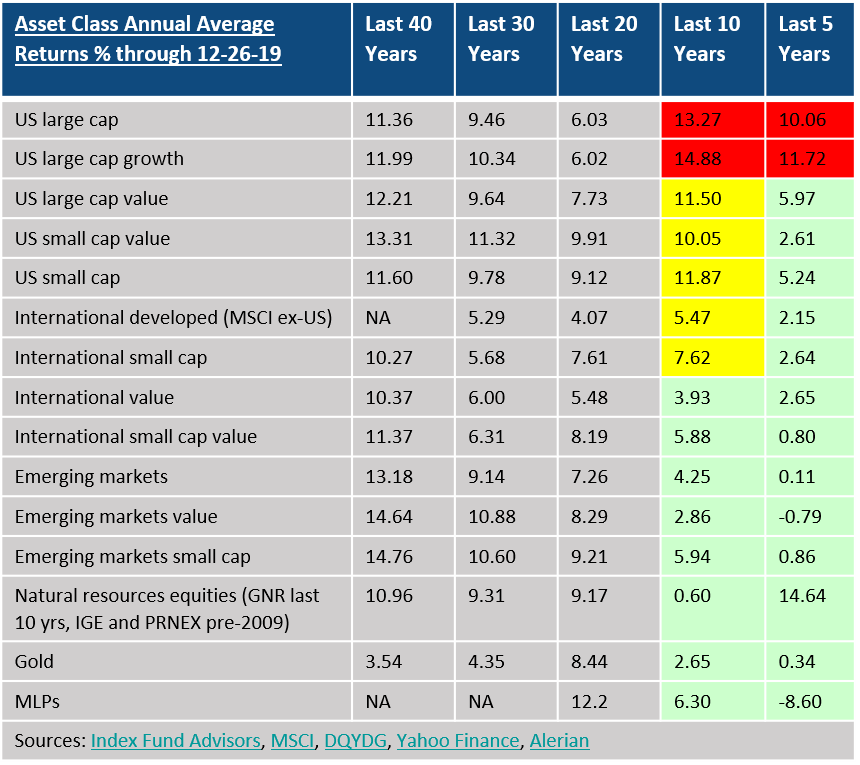
These were key takeaways and a performance table from my 2019 article:
- U.S. equities are near their highest levels in history, based on valuation metrics. This suggests meager returns of 4-5% per year over the next decade.
- However, based on reversion to the mean and attractive valuations, there are several attractive asset classes.
- U.S. value, international, emerging markets, natural resources, MLPs and gold present opportunities.
- These assets have the potential for returns in a Base Case scenario ranging from 5.5% per year to 11.6% per year.
- History has shown that it can take years or even decades for a reversal. Only patient and bold investors may reap the rewards.
IFA, MSCI, DQYDG, Yahoo Finance, Alerian
The table depicts U.S. large caps (the S&P 500) and U.S. large cap growth sectors’ returns for the five and ten year periods in red. Over the previous five and ten years they had outperformed their 20 and 30 year averages. In contrast, the periods highlighted in green depict returns for assets that were well below their longer-term averages. These were the assets with mean reversion potential. Those in yellow depict ten-year average returns that were generally in line with their longer-term averages, but had underperformed in the previous five years.
At the time I posed the following:
Will the recent sub-par performance persist? If so, for how long? ... Reversion to the mean often involves the pendulum swinging to the other side of the mean. Those assets that have outperformed swing below their long-term mean returns. Recent underperformers swing to return levels greater than the mean.”
U.S. Mean Reversion Sectors Slowly Gained on Large Caps, Then Accelerated in 2022
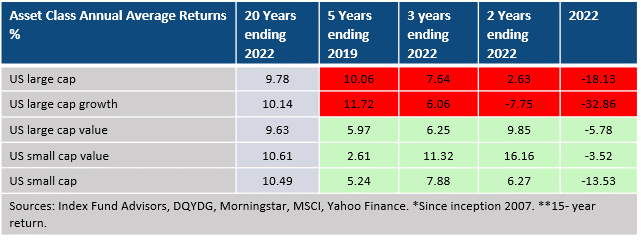
The table below is updated with recent years’ performance. The 20-year column provides a baseline of what may be considered more normalized returns.
IFA, DQYDG, Morningstar, Yahoo Finance, MSCI
After lagging for the five years ending 2019, U.S. small cap and small cap value both outperformed large cap and large cap growth over the following three years. Only U.S. large cap value failed to beat the S&P during the period, returning 6.25% per year versus 7.64% per year for the S&P. All three U.S. mean reversion sectors beat large cap growth during the last one, two and three year periods. U.S. small cap value stood out over the past three years, gaining 11.32% versus the S&P up 7.64%.
Mean reversion accelerated during 2022. Although all sectors posted losses, mean reversion assets significantly aided capital preservation. During the year, their advantage over the S&P ranged from nearly five percentage points for U.S. small caps to almost 15 percentage points for U.S. small value.
Popular Growth Stocks De-FAANG-ed
It has been well-documented that the FAANGs led the growth sector, S&P 500 and NASDAQ higher during the pre and post-pandemic bull runs. And they led the market sharply lower in 2022. After a wild roller coaster ride, the average FAANG stock gained a cumulative 9% over the three year period ending 2022. Compare that to the stodgy Vanguard Value Index fund ( VTV ), which gained 8.2% per year for a cumulative 25% during the period. Those who jumped in at the height of the bubble fared much worse, with the average FAANG stock declining over 50% from its peak to the end of 2022.
Mean Reversion Picks From My All-Weather Portfolio: VTV and SLYV
The table below depicts the returns for my U.S. all-weather portfolio picks, Vanguard Value Index ( VTV ) and SPDR S&P 600 Small Cap Value ETF ( SLYV ). VTV outperformed over three years and in 2022, while SLYV was on par with large cap growth and superior in 2022.
Vanguard, SSGA, IFA
Foreign and Emerging Markets Equities Were in the Ditch in 2019
All the foreign and emerging markets ( EM ) sectors had sub-par returns in the five years ending 2019. Annual returns ranged from 0.79% for EM value to a high of 2.65% for international value. Sentiment was dour, and the sector was unloved. Let’s see what happened after that.
Foreign and Emerging Markets Equities Struggled from 2020-2021, But Beat the S&P in 2022
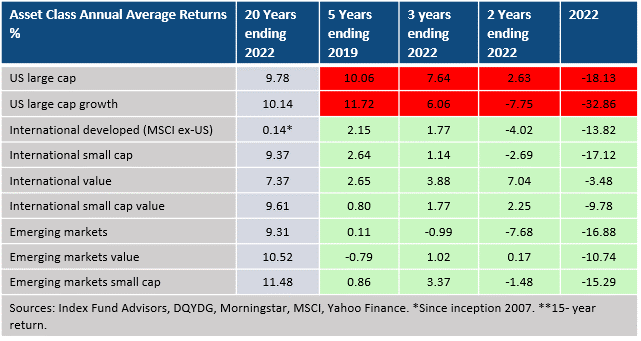
The table below shows foreign and EM equity performance compared to the U.S. large cap and growth sectors.
IFA, DQYDG, Morningstar, MSCI, Yahoo Finance
Over the three year period, all international and EM sectors lagged U.S. large caps and large cap growth. A strong dollar, the Russian invasion of Ukraine, China’s COVID and debt-induced economic slowdown all weighed on the sectors.
But international value was a bright spot, gaining 7.0% over the past two years versus 2.6% for U.S. large caps. Last year it was down only 3.5% compared to U.S. large caps which shed 18.1%. In 2022, every international and EM sector declined, but beat both U.S. large caps and large cap growth.
The anemic 0.14% annual return for international developed markets over the past 20 years is hard to believe. It’s essentially the same as stuffing your money under a mattress. Does this mean the sector is forever dead or is it a bullish sign?
Mean Reversion Picks From My All-Weather Portfolio: VEA, ISCF, DGS
The table below depicts the returns for my all-weather portfolio picks in the international and EM sectors. Consistent with the sector performance cited above, they underperformed over three years, but outperformed the U.S. averages in 2022.
BlackRock, Wisdom Tree, IFA
Natural Resources and MLPs Were Beaten Up and Unloved
Diversified natural resources equities gained only 2.9% per year in the 10 years ending 2019. With the rise of ESG and the green movement, the energy sector was scorned by investors and much of the general-public. I wrote a bullish piece about the sector in June 2020, Natural Resources Equities: Preparing for Reflation and A Dollar Decline.
MLPs have been beaten up in recent years. In 2018, the Alerian MLP Index was down 19% on a price basis, 12.4% including dividends. After a good start to 2019, MLPs have pulled back. MLP valuation, sentiment and possible reversion to the mean provide the type of setup that value and contrarian investors like.”
I was also bullish on GUNR in my July 2020 article, Load Up GUNR To Defend Against Reflation And A Dollar Decline . That was even before the Fed began its infamous “Inflation is transitory” speak. Let’s see what happened next.
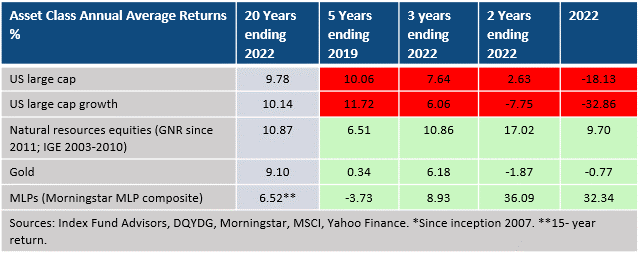
Natural Resources Equities Revived in 2020-2021, Then Trounced Large Caps and Large Growth in 2022
The post-pandemic inflation surge and Russia – Ukraine war sparked strong gains in natural resources equities. In 2022 MLPs gained 32% compared to U.S. large caps down 18%, a whopping 50 percentage point difference. The MLP return difference versus U.S. large cap growth was a staggering 65 percentage points.
IFA, DQYDG, MSCI, Yahoo Finance
Since 2019 natural resources equities have mean reverted, posting healthy gains of 9.7%, 17.0% and 10.9% per year over the past one, two and three year periods, respectively. From a portfolio diversification standpoint, the sector was extremely effective in 2022, outperforming the S&P by 28 percentage points. Since my 2020 article, GUNR has gained 76% versus 32% for the S&P 500.
Mean Reversion Natural Resources Picks: GUNR, MLPX and FPI
The table below shows my all-weather portfolio holdings in the sector. Each of them significantly outperformed U.S. large caps and large cap growth during 2022 and the past three years.
FlexShares, GlobalX, Morningstar
Reversion to the Golden Mean?
In my 2019 article I wrote:
Gold is up about 14% so far in 2019. However, it has returned only 0.3% per year over the past five years and 2.6% per year over the past ten years. Over the past 50 years, it has returned 7.2% per year… I believe investors should allocate 5-15% of their portfolio to gold, either in the form of physical bullion, gold-backed ETFs or some combination of the two.”
Gold Had Decent Gains, But Trailed the S&P Over the Past Three Years
At the time of my 2019 article, gold traded at 1509. It ended 2022 at 1823, up 21%, or 6% per year since the end of 2019. Not bad for an insurance asset, but trailing U.S. large caps, which gained 7.6% per year. However, gold again proved to be a good portfolio diversifier in 2022, despite a strong dollar. It ended the year essentially unchanged, beating the S&P by more than 17 percentage points.
SSGA, Aberdeen
My all-weather portfolio holdings are SGOL and GLD. The two ETFs did a nice job of tracking gold returns during the period.
All in all, natural resources, gold and MLPs provided excellent diversification for investors who were willing to invest counter to the conventional wisdom and negative sentiment of late 2019.
Outlook for Mean Reversion Assets
Now let’s look ahead. We will consider historical cycles, valuations, sentiment and currency effects.
Mean Reversion Runs Through Long Cycles
History indicates that asset classes run through long cycles. The chart below shows a sampling of asset classes and how they’ve changed leadership over the past four decades.
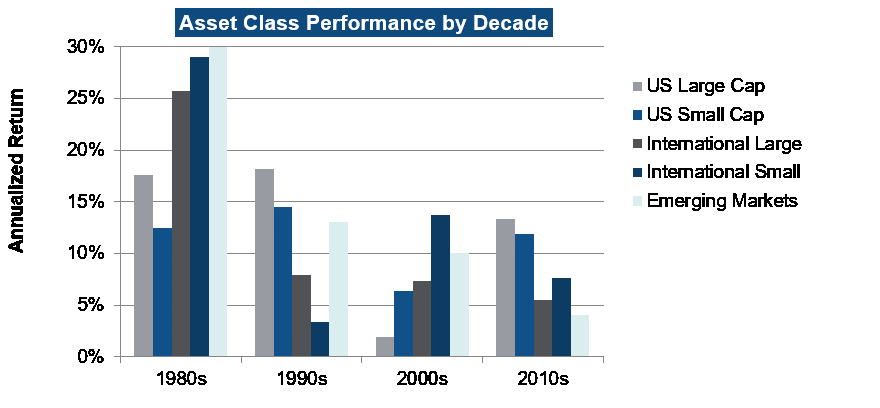
Given the recent behavior of mean reversion assets over the past few years, it’s possible we are in the early innings of a new favorable multi-year cycle. Valuations and currency effects are two of several possible tailwinds supporting this possibility.
Valuations Remain Favorable for Mean Reversion Assets
The chart below shows P/E ratios for the equity sectors. They have declined across the board, reflecting a revaluation. This makes sense given the deteriorating prospects for economic and earnings growth, and higher interest rates. Each of those factors reduces the value of discounted earnings and dividends.
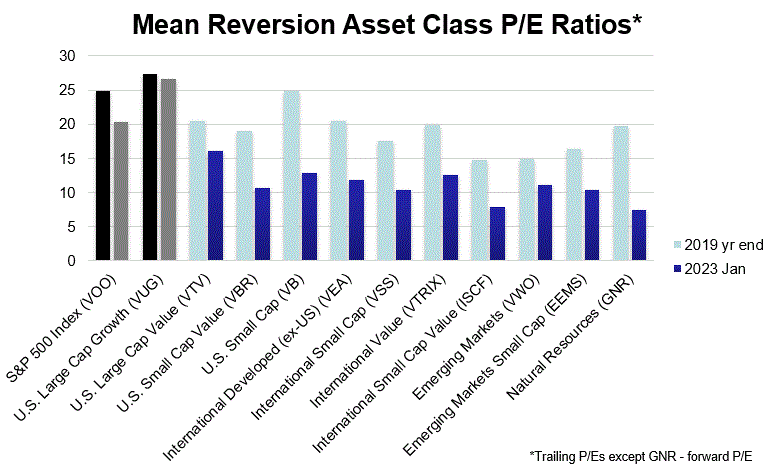
Across the board valuation declines still leave a significant gap between mean reversion assets, and the S&P 500 and large growth sectors. This suggests more runway ahead for mean reversion assets.
Given the recent relative strength in natural resources, it’s striking how cheap they remain. The sector trades at a P/E of only 7.4 versus the S&P’s 25X earnings.
Value Stocks Are About as Cheap As They Get Compared to Growth Stocks
The chart below from AQR shows that the spread between growth and value stocks sits at the 98 th percentile of the last 32-years’ data. The gap is even more pronounced given large and small value crushed large growth in 2022 by 27 and 29 percentage points, respectively. That could signal an acceleration of a trend reversal, with more room to run.
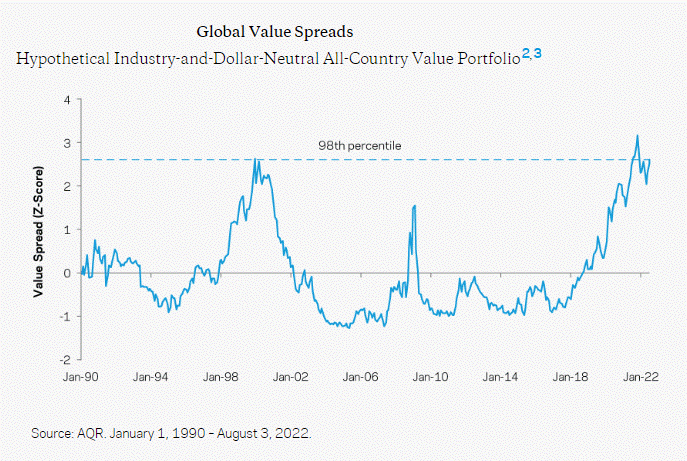
The last time the disparity was this great was 1999, the peak of the dot-com bubble. During the following decade, U.S. value returned a meager 4.4% per year while the S&P lost 0.96% per year. In 1999, valuations were way out of whack. In retrospect, with CAPE reaching 44 it’s no surprise it was hard to make money in U.S. equities during the subsequent decade. This mirrors late 2021 when CAPE peaked at 38.
In 1999 U.S. small caps, U.S. small cap value and emerging market equities also had low relative valuations. They gained 5.7%, 9.1% and 9.5% per year respectively over the following decade, handily beating the S&P. Valuations matter.
Sentiment Recently Bounced Off Extreme Bearish Levels to Risk-On
The Best Market Indicator Over The Last 34 Years analyzed the Investors Intelligence Bulls to Bears ratio, noting its efficacy as a contrarian indicator.
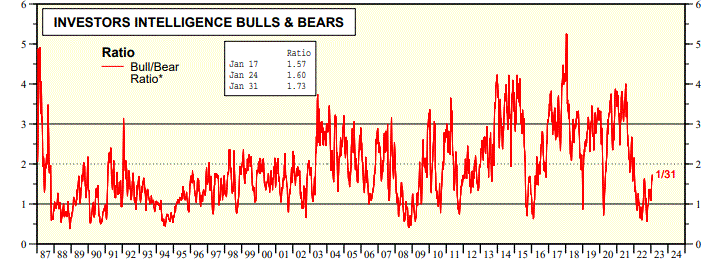
Extreme readings of less than 1 occurred at major bottoms in 2002, 2009 and 2020. The indicator has correctly signaled six of the last seven major market bottoms.
It has been bearish for much of the past 12 months, bouncing around near 1 and dipping below that late last year. Right on cue, the S&P has rallied 17% since its October low. So far this year the indicator has been moving up and now stands at 1.73, well off its lows.
The shift in sentiment is also evident in the renewed enthusiasm for the growth sector, particularly the FAANGs. An equal weight FAANG portfolio has soared 27% YTD. In such an environment, mean reversion assets have continued to perform well, but U.S. large cap growth has held the con. A continuation of the risk-on environment could result in a hiatus for mean reversion assets’ outperformance - at least for the near-term.
The Dollar May Weaken, Helping International, EM, Natural Resources and Gold
International markets could benefit from a currency sea change. In the third quarter of 2022, the euro and Japanese yen were as cheap relative to the dollar as they had been in 20 years. The euro traded at $0.96 but has since strengthened to $1.08. This is still a significant discount to historical levels. The yen has followed a similar pattern.
Research Affiliates’ The Buck Stops Here opined,
As we start 2023, the US dollar has pulled back 12% from its high in September 2022, but remains 25% elevated from its lows at the start of the last decade. The US dollar’s long march upward may be ending, squeezed by an expected shrinking interest rate differential with other developed nations that must keep hiking rates to fight inflation.”
If a secular currency trend reversal is underway, it would favor natural resources, gold, international developed markets and EM equities. However, there are many factors that can drive currency performance in either direction. That’s why I diversify currency exposure in my all-weather portfolio.
The Dow To Gold Ratio is Near 1929 and 1971 Levels, But Well Below the Dot-Com Bubble High
The gold to Dow 100 year chart gives us a long-term cycle perspective. U.S. large cap stocks, as gauged by the Dow, are close to the secular peaks of 1929 and 1971 when the dollar came off the gold standard. However, we are currently at only half the level of the Dot-com bubble peak in 1999. So stocks could push higher on a relative basis to gold.
longtermtrends.net
After a runup last month to $1951, gold has cooled to $1865. That’s still about 8% below the 2020 record of $2051. Sentiment towards gold remains muted, if not pessimistic. I discussed the long-term possibilities for gold based on its relationship to the money supply in The Case For $5,000 Gold .
Risks and Timing
As noted above, the recent shift in sentiment and return to leadership for growth stocks may signal a hiatus for mean reversion assets for some time. This wouldn’t necessarily mean they lose money, but they could significantly lag the major averages. History shows that sectors such as international and EM equities can continue to languish for years or even decades.
All-weather portfolio adherents know that tactical shifts in and out of asset classes can be hazardous to their investment health. Just when you think a sector has taken over leadership, it can reverse course.
Conclusion
As I outlined in my all-weather portfolio article series, I have held and will continue to hold positions in some of these previously out of favor sectors. The length of historical cycles, relative valuations, currency effects, and diversification benefits all bode well for mean reversion assets. Those factors should provide comfort to patient investors who carry a measured allocation as part of an all-weather portfolio.
I look forward to your comments.
For further details see:
Asset Class Mean Reversion: Review And Outlook