CWAN - Baron Discovery Fund Q3 2023 Quarterly Letter
2023-11-02 04:19:00 ET
Summary
- Baron is an asset management firm focused on delivering growth equity investment solutions known for a long-term, fundamental, active approach to growth investing.
- Baron Discovery Fund was down 5.4% during Q3, which was 2.0% better than the Benchmark. Year-to-date, the Fund appreciated 9.0%, which was 3.8% better than the Benchmark.
- Our top 10 holdings represented 29.6% of our net assets, which is in line with historical levels.
- We trimmed our positions in Kinsale Capital Group, Inc. and Boyd Gaming Corporation to manage their respective position sizes as part of our risk management efforts.
Dear Baron Discovery Fund Shareholder:
Performance
Baron Discovery Fund’s 10-Year Anniversary
On September 30, 2023, Baron Discovery Fund ® (the Fund) reached its 10-year anniversary. As long-term investors, we are most focused on our alpha creation over time. Using that criteria, investors who bought our Fund on day one would be up, on a cumulative basis, 195.3% (Institutional Shares) versus the Russell 2000 Growth Index (the Benchmark), which was up 91.6%. In other words, investors who invested in the Fund more than doubled the return of the Benchmark in the first 10 years of the Fund’s life. While there will be years in which we underperform the market, we believe our strategy shines most during economic recoveries, and we continue to position ourselves to benefit from the stock market recovery we expect during the next economic up cycle.
Performance listed in the above table is net of annual operating expenses. Annual expense ratio for the Retail Shares and Institutional Shares as of September 30, 2022 was 1.32% and 1.06%, respectively. The performance data quoted represents past performance. Past performance is no guarantee of future results. The investment return and principal value of an investment will fluctuate; an investor’s shares, when redeemed, may be worth more or less than their original cost. The Adviser may reimburse certain Baron Fund expenses pursuant to a contract expiring on August 29, 2034, unless renewed for another 11-year term and the Fund’s transfer agency expenses may be reduced by expense offsets from an unaffiliated transfer agent, without which performance would have been lower. Current performance may be lower or higher than the performance data quoted. For performance information current to the most recent month end, visit baronfunds.com or call 1-800-99-BARON.
† The Fund’s 3-, 5-, and 10-year historical performance was impacted by gains from IPOs and there is no guarantee that these results can be repeated or that the Fund’s level of participation in IPOs will be the same in the future.
1 The Russell 2000® Growth Index measures the performance of small-sized U.S. companies that are classified as growth. The S&P 500 Index measures the performance of 500 widely held large-cap U.S. companies. All rights in the FTSE Russell Index (the “Index”) vest in the relevant LSE Group company which owns the Index. Russell® is a trademark of the relevant LSE Group company and is used by any other LSE Group company under license. Neither LSE Group nor its licensors accept any liability for any errors or omissions in the indexes or data and no party may rely on any indexes or data contained in this communication. The Fund includes reinvestment of dividends, net of withholding taxes, while the Russell 2000® Growth Index and S&P 500 Index include reinvestment of dividends before taxes. Reinvestment of dividends positively impacts the performance results. The indexes are unmanaged. Index performance is not Fund performance. Investors cannot invest directly in an index.
2 The performance data in the table does not reflect the deduction of taxes that a shareholder would pay on Fund distributions or redemption of Fund shares.
3 Not annualized
Our motto is: Grind daily and celebrate rarely . As a result, it should come as no surprise to you that we didn’t even acknowledge (no less celebrate) that we had reached the 10-year mark when it happened. Truth be told, we probably would not have even remembered if not for one of our team members congratulating us on the milestone. The reason we mention this is that despite our success these last 10 years, we don’t want investors to think their managers are going to become complacent. We are aware that we are frequently getting new investors into the Fund and, while they may have chosen our Fund based on our historical performance, it is how we perform going forward that they (and we!) really care about. As a result, we continue to methodically execute our process and grind daily . Our goal remains the same: double our investors’ money every five years by investing in high-quality, fast-growing small-cap businesses (and we strive to do this in a tax efficient manner – the Fund currently has a meaningful amount of capital loss carryforwards to shield future gains.)
Third Quarter
The Fund was down 5.4% during the third quarter, which was 2.0% better than the Benchmark. Year-to-date, the Fund appreciated 9.0%, which was 3.8% better than the Benchmark. The crosscurrents we have been writing about for the past few quarters continued into the third quarter. During the third quarter, it was the bond market that became the latest headwind to stock market performance. The stock market began the quarter with gains during the month of July. However, the bond market sold off in August and September (causing long-term U.S. Treasury yields to increase during that period) on fears of rising inflation and, as a result, further rate increases by the Federal Open Market Committee. This bond market sell-off bled into the stock market with August and September being down for equities (with small-cap equities being especially hard hit).
In our last few quarterly letters, we have focused on the crosscurrents we were seeing at both the macro and individual company levels. As we move into the fourth quarter, we continue to see some positives and some negatives impacting stock prices. On the positive side, unemployment remains low, the industrial economy has shown resiliency, and, with the exception of the lower-end consumer, overall consumer spending has remained strong. Those positives are being offset by signs that deflationary forces have abated (oil increased almost 30% in the third quarter) and that some consumer spending indicators are flashing warning signs. Of course, strength in the labor market is a good thing objectively, but it is also viewed as potentially inflationary. We continue to think that these crosscurrents will continue over the next few quarters, but depressed stock prices already reflect a lot of this negativity. American Association of Individual Investors (AAII) bearish sentiment, a contrary market indicator, was at a five-month high for the week ended October 5. This is lower than the near all-time high reached last September but still reflects the fact that investors remain pessimistic. In our view, we can make the greatest profits when we buy stocks at peak pessimism, so this level of bearishness makes us more, not less, constructive on the market.
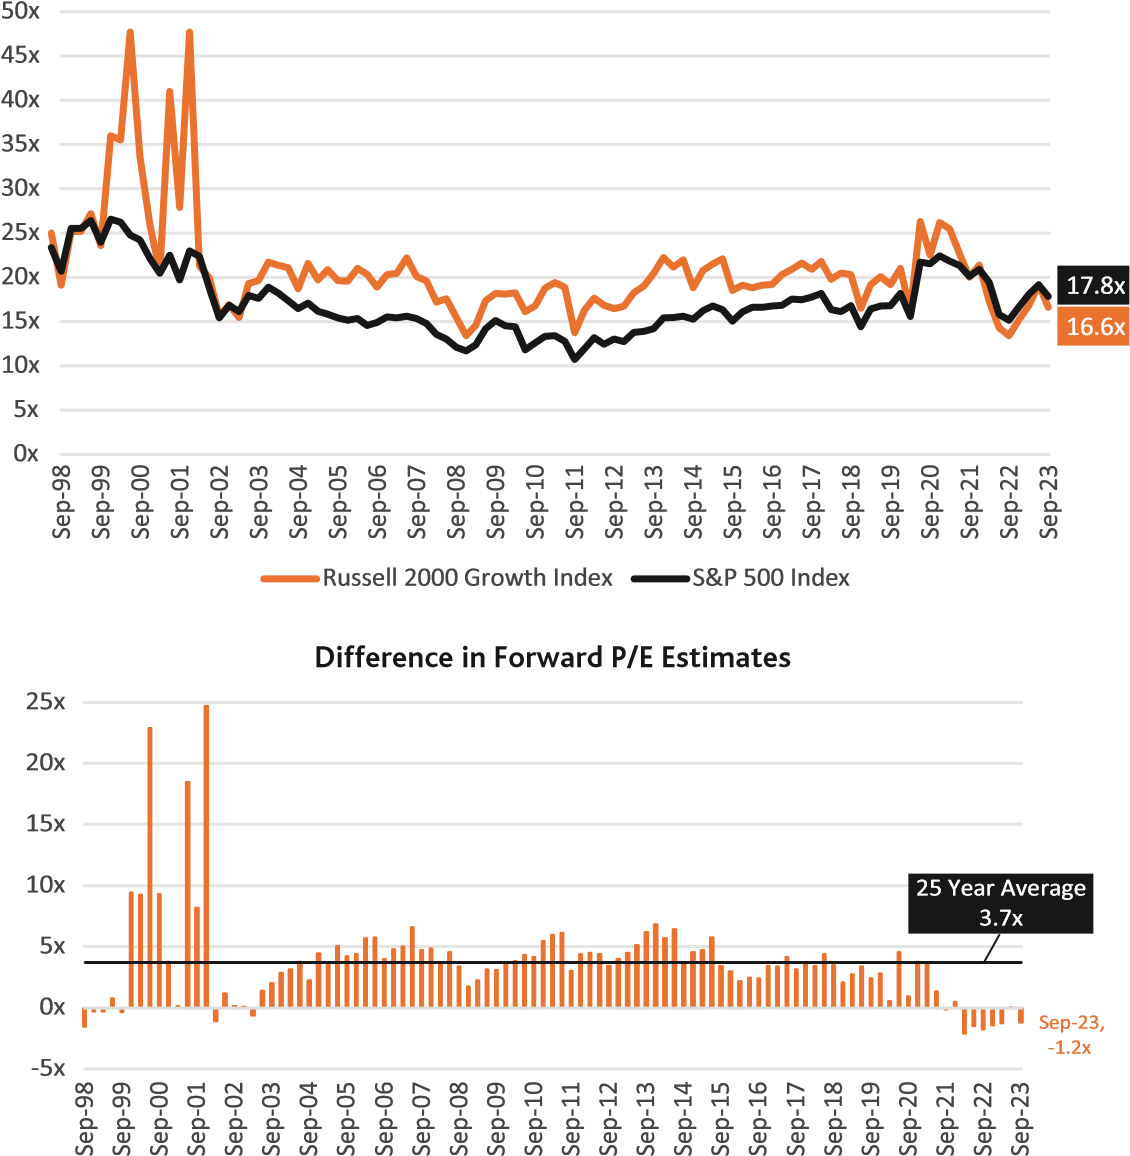
Valuations remain compelling both on an absolute and relative basis (see charts below). Despite the Benchmark still being about a third below where it peaked two and a half years ago, our individual company 2023 revenue and profit estimates have, on average, remained relatively unchanged from what we thought at the beginning of the year. Our goldilocks scenario for making outsized investment returns is an environment where investors are extremely bearish, valuations are inexpensive, and future revenue and earnings estimates are understated. Today we have the first two elements in place. The crosscurrents we have been writing about for the past few quarters are, for the time being, delaying the upward revision to revenue and earnings estimates that we expect to come eventually. While we don’t know when upward revenue and earnings revisions will happen, we do believe that they will eventually happen and we believe we have positioned the portfolio to outperform when they do.
Russell 2000 Growth Index vs. S&P 500 Index
Historical Valuation Comparison using Forward P/E Estimates
Sources: The Bank of New York Mellon Corporation using I/B/E/S 1 Year Forward EPS and FactSet Market Aggregates.
Facts from Baron Discovery Fund’s first 10 years
- Our 10-year performance ranked in the 4 th percentile (meaning we beat 96% of funds in the Morningstar Category).
- The Fund received a 5-Star 10-year Morningstar Rating ™ as of 9/30/2023. Complete Ratings are as follows:
- 4-Star Overall Morningstar Rating ™ (562 funds)
- 5-Star 10-year Morningstar Rating ™ (397 funds)
- 3-Star 5-year Morningstar Rating ™ (527 funds)
- 2-Star 3-year Morningstar Rating ™ (562 funds)
- In the 85 months that Morningstar has rated the Fund, 74% of the time the Fund received 4- or 5-Star Overall Morningstar Ratings ™ .
- The Fund has outperformed the Morningstar Small Growth Category average 100% of the time on a 5-year rolling basis and 91% of the time on a 3-year rolling basis.
O We strive for consistency and measuring our performance on a rolling basis highlights our consistency over time.
Table II.
Top contributors to performance for the quarter ended September 30, 2023
| Percent Impact |
| Kinsale Capital Group, Inc. ( KNSL ) |
| 0.50% |
| Clearwater Analytics Holdings, Inc. ( CWAN ) |
| 0.36 |
| PAR Technology Corporation ( PAR ) |
| 0.31 |
| Guidewire Software, Inc. ( GWRE ) |
| 0.22 |
| Axonics, Inc. ( AXNX ) |
| 0.22 |
Specialty insurer Kinsale Capital Group, Inc. contributed to performance after reporting consensus-beating quarterly results. Gross written premiums grew 58%, and earnings per share increased 50%. Market conditions remained favorable, with rising premium rates and more business shifting from the standard lines market to the excess and surplus lines market where Kinsale operates. The company is also capitalizing on disruption in the property market, where rates are rising rapidly after years of industry losses and a reduction in reinsurance capacity. We continue to own the stock because we believe Kinsale is well managed and has a long runway for growth in an attractive segment of the insurance market.
Clearwater Analytics Holdings, Inc. provides portfolio accounting and reporting software. Shares rose after the company reported solid second quarter earnings, demonstrating strong underlying business trends, and raised its full-year guidance for 2023. The company also hosted an upbeat Investor Day where it gave strong medium-term guidance calling for 20%-plus revenue growth and an annual margin expansion of 200 basis points. We believe Clearwater has robust competitive advantages and the potential to compound revenue at more than 20%. The company has an efficient business model that should drive 40%-plus adjusted EBITDA margins over time.
PAR Technology Corporation is a leading software-as-a-service provider to the restaurant industry. Shares rose during the quarter on news that the company is on the verge of potentially winning some contracts with large quick-service restaurants and table service customers. The restaurant industry has historically under-invested in technology, and PAR is building an all-in-one platform for enterprise restaurants to run the most critical portions of their technology stacks. PAR benefits from limited industry competition, accelerating restaurant adoption of cloud platforms, a renewed focus on R&D, and sales efficiency. As its new payments and online ordering products continue to ramp, we believe PAR will deliver on its 20% to 30% subscription revenue growth targets for the next several years. We believe the company will become profitable in the quarters ahead as it controls operating expenses while delivering strong growth and continues to bolt on targets.
| The Morningstar Ratings ™ are for the Institutional share class only; other classes may have different performance characteristics. The Morningstar Ratings are based on the Morningstar Risk-Adjusted Return measures. As of 9/30/2023, the Morningstar Small Growth Category consisted of 592, 562, 527, and 397 share classes for the 1-, 3-, 5-, and 10-year periods. Morningstar ranked Baron Discovery Fund Institutional Share Class in the 54 th , 79 th , 50 th , and 4 th percentiles, respectively. Baron Discovery Fund Institutional Share Class is in the Morningstar Small Growth Category. Morningstar calculates the Morningstar Small Growth Category Average Performance and rankings using its Fractional Weighting methodology. Morningstar rankings are based on total returns and do not include sales charges. Total returns do account for management, administrative, and 12b-1 fees and other costs automatically deducted from fund assets. © 2023 Morningstar. All Rights Reserved. The information contained herein: (1) is proprietary to Morningstar and/or its affiliates or content providers; (2) may not be copied, adapted or distributed; (3) is not warranted to be accurate, complete or timely; and (4) does not constitute advice of any kind, whether investment, tax, legal or otherwise. User is solely responsible for ensuring that any use of this information complies with all laws, regulations and restrictions applicable to it. Neither Morningstar nor its content providers are responsible for any damages or losses arising from any use of this information. Past performance is no guarantee of future results. MORNINGSTAR IS NOT RESPONSIBLE FOR ANY DELETION, DAMAGE, LOSS OR FAILURE TO STORE ANY PRODUCT OUTPUT, COMPANY CONTENT OR OTHER CONTENT. |
Table III.
Top detractors from performance for the quarter ended September 30, 2023
| Percent Impact |
| Silk Road Medical, Inc. ( SILK ) |
| –0.81% |
| Montrose Environmental Group, Inc. ( MEG ) |
| –0.70 |
| Navitas Semiconductor Corporation ( NVTS ) |
| –0.68 |
| indie Semiconductor, Inc. ( INDI ) |
| –0.65 |
| Revance Therapeutics, Inc. ( RVNC ) |
| –0.62 |
Silk Road Medical, Inc. sells medical devices used in minimally invasive transcarotid artery revascularization (TCAR) procedures. The company’s TCAR device allows placement of a stent in the carotid artery to provide better blood flow to the brain, while reducing the risk of stroke during the procedure due to its innovative reverse blood flow system. The stock detracted from performance as Medicare is updating reimbursement for an alternative carotid procedure (TF-CAS) to be equivalent to TCAR and investors are debating the competitive impact. We retain conviction as TCAR is less invasive, has an easier recovery, and causes fewer periprocedural strokes than other options, including TF-CAS and carotid endarterectomy surgery (CEA),the traditional and far more invasive method of clearing and stenting carotid arteries. Following last summer’s FDA approval of Silk Road devices in the treatment of standard surgical risk carotid stenosis patients, which expanded the company’s market, Silk Road saw rising numbers of eligible patients, accelerated use of its products, reduced reimbursement uncertainty, as well as further legitimization of TCAR in the eyes of more conservative surgeons who had been holding off switching from CEA. We think TCAR is fundamentally safer, easier to perform, and more scalable than either of the alternative procedures. Currently accounting for nearly 15% of carotid stenosis interventions, we believe the TCAR should become the standard of care for treating carotid artery disease over the long term. The company now trades for an exceedingly cheap 2 times its enterprise value/sales ratio for 2024, has significant net cash on the balance sheet, and will be cash flow breakeven by our estimates in 2024. We believe that even with conservative overall market and competitive procedure share assumptions, the company will be able to double revenues over the next five years.
Montrose Environmental Group, Inc. is a services company that provides environmental analysis, testing, and remediation consulting as well as technology solutions. Shares were weak in the quarter along with a broader decline in small-cap stocks as well as due to concerns that infrastructure investments could get pushed out while waiting for the finalization of certain government rules. We continue to believe that Montrose’s patented technology positions them well to benefit from the billions of dollars of upcoming spending by both government and industrial customers related to the clean-up of PFAS (polyfluoroalkyl substances, sometimes known as forever chemicals). In addition, Montrose’s methane emissions monitoring and detection business is poised to ramp up as the Inflation Reduction Act spurs corporate compliance by imposing a waste emissions charge. We continue to be confident around the long-term opportunity for Montrose as well as its management’s ability to execute on the company’s growth strategy.
Navitas Semiconductor Corporation is a leader in gallium nitride (GaN) power semiconductors and a smaller player in silicon carbide (SiC) power semiconductors. These are both new materials used as a base (substrate) on which to print power-oriented chip circuits. Shares fell during the quarter as the stock was trading at a premium valuation heading into the quarter, and investors were broadly concerned about underlying demand conditions in key end-markets like smartphones. Despite near-term concerns, the company reiterated its outlook to double revenues in 2023, reported strong design win momentum, and indicated opportunity pipeline growth. Navitas sells monolithically integrated GaN power integrated circuit chips (completed printed circuit systems on a chip), which provide greater reliability and performance compared to competitors that supply discrete power devices (multiple individual, larger components put together on a chip). It recently purchased a silicon control company to drive integration and performance even further, and its SiC products offer high performance across many different applications. The company’s high-power GaN product launches remain on track for data center, solar, and electric vehicle applications. We expect Navitas to gain share in the rapidly growing GaN and SiC power semiconductor markets over time, driven by its superior technology.
Portfolio Structure
| Table IV. Top 10 holdings as of September 30, 2023 |
| Year Acquired |
| Quarter End Investment Value (millions) |
| Percent of Net Assets |
| Kinsale Capital Group, Inc. ( KNSL ) |
| 2016 |
| $62.1 |
| 4.9% |
| Advanced Energy Industries, Inc. ( AEIS ) |
| 2019 |
| 40.8 |
| 3.2 |
| Chart Industries, Inc. ( GTLS ) |
| 2022 |
| 38.1 |
| 3.0 |
| Axonics, Inc. ( AXNX ) |
| 2020 |
| 35.8 |
| 2.8 |
| Boyd Gaming Corporation ( BYD ) |
| 2021 |
| 35.6 |
| 2.8 |
| GitLab Inc. ( GTLB ) |
| 2022 |
| 35.2 |
| 2.8 |
| Axon Enterprise, Inc. ( AXON ) |
| 2022 |
| 33.1 |
| 2.6 |
| SiteOne Landscape Supply, Inc. ( SITE ) |
| 2016 |
| 32.7 |
| 2.6 |
| PAR Technology Corporation ( PAR ) |
| 2018 |
| 32.6 |
| 2.6 |
| Rexford Industrial Realty, Inc. ( REXR ) |
| 2019 |
| 32.1 |
| 2.5 |
Our top 10 holdings represented 29.6% of our net assets, which is in line with historical levels.
Recent Activity
| Table V. Top net purchases for the quarter ended September 30, 2023 |
| Year Acquired |
| Quarter End Market Cap (billions) |
| Net Amount Purchased (millions) |
| SentinelOne, Inc. ( S ) |
| 2023 |
| $5.0 |
| $20.9 |
| Liberty Media Corporation – Liberty Live |
| 2023 |
| 2.9 |
| 16.7 |
| Repligen Corporation ( RGEN ) |
| 2023 |
| 8.9 |
| 12.1 |
| European Wax Center, Inc. ( EWCZ ) |
| 2023 |
| 1.0 |
| 10.9 |
| 10x Genomics, Inc. ( TXG ) |
| 2023 |
| 4.8 |
| 6.9 |
We initiated a position in SentinelOne, Inc. this quarter after the stock fell sharply on its March 2023 quarterly results. The company lowered its full-year guidance for revenue growth by about 10%, and it will still grow annualized recurring revenue by a mid-30s rate. We believe that the market over reacted to the update, and we already saw a positive update in its June 2023 results (increasing full-year revenue growth to 43%). This is a classic fallen angel investment for the Fund.
SentinelOne is a cybersecurity vendor primarily focused on endpoint protection (preventing malicious attacks on corporate laptops, mobile devices, and servers). The company collects petabytes of data from over 15 million endpoints across its customer base and uses artificial intelligence ((AI)) to learn behavior patterns, detect suspicious activity, proactively hunt threats, and roll-back devices to their pre-breach states to mitigate damage when attacks occur. SentinelOne is widely recognized as a technology leader in the $27 billion endpoint and cloud security industry due to its AI-powered detection and its ease of use. As a result, the business has been winning market share away from legacy antivirus vendors who struggle to keep up with the rapidly evolving threat environment. More than 11,000 organizations have adopted SentinelOne, with customers including half the Fortune 10, government agencies, and many of the world’s largest managed security service providers (MSSPs). MSSPs, which represent 20% to 30% of SentinelOne’s revenue, extend the company’s reach to thousands of small businesses who lack adequate IT resources to defend against cyberattacks.
SentinelOne has also leveraged its large security data set across customers to offer new products including cloud security (protecting virtual machines and applications running in the cloud), identity-based threat protection, and extended detection & response (collecting data from other sources like network scans and IT logs to provide a holistic security view). These emerging solutions represent more than a third of bookings, are growing faster than core endpoint protection, and drive much higher long-term contract values. As SentinelOne has scaled its business across these products, the company has delivered significant improvement in its free-cash-flow ((FCF)) margins, which have expanded by an average of 24% year-over-year every quarter since becoming a public company. We expect the business to generate positive cash flow next year and healthy 20%-plus margins longer term. As the threat environment continues to get worse, with more frequent and severe ransomware attacks, heightened geopolitical tension, and increased sophistication of hackers, we see ample runway for growth through both new customer acquisition and existing customer expansion. The combination of resilient end-market demand, new product traction, and margin expansion should all bode well for the stock long term.
Liberty Media Corporation-Liberty Live is a tracking stock created on 8/4/2023 representing Liberty Media Corporation’s holdings in Live Nation shares. Those holdings were previously attributed to Liberty SiriusXM and reattributed to a the newly created Liberty Live Group vehicle to reduce the complexity of the Liberty SiriusXM structure and make way for its potential combination with the underlying SiriusXM business. We believe the separation created some selling pressure on Liberty Live, creating an attractive discount of over 40% to the underlying value of its Live Nation holdings, and we took advantage of that discount to build a position. The Liberty Live Group is a small-cap vehicle through which we can own the underlying Live Nation business, which we have tracked and liked for years. Live Nation has significant competitive advantages in the live entertainment industry due to its unique combination of concert promotion, ticketing, venue management, and sponsorship businesses, which create a market share flywheel and margin structure that is difficult for competitors in any one of these underlying sub-segments to replicate independently. In addition to the upside we see in Live Nation, we think Liberty Live Group could eventually transition from a tracking stock to an asset-backed vehicle, which would pave the way for a structure consolidation with Live Nation and allow us to capture the current wide NAV discount.
We continued to build our Repligen Corporation position, which we initially purchased in the second quarter. For more detailed information, please refer to last quarter’s commentary on the company.
During the quarter, we added to our position in European Wax Center, Inc. European Wax Center is the largest and fastest-growing franchisor and operator of out-of-home waxing services in the U.S. with more than 1,000 locations. We believe European Wax Center’s scale, high-quality service, and differentiated waxing experience will enable the company to take share in the $18 billion hair removal market. As a franchisor, European Wax Center offers compelling new unit economics for franchisees with 60% cash-on-cash returns after five years. This healthy return, along with a relatively low initial investment and economic resiliency has led to a multiyear pipeline of over 400 franchisees. We believe that over time European Wax Center can grow units 10% annually with longer-term potential for over 3,000 units, roughly 3 times the current unit count. As the company’s valuation compressed during the quarter, we took advantage of this pullback to increase our position. We believe the combination of double-digit unit growth and high single-digit same-store sales growth will lead to a more than doubling of the stock price over the next five years.
We initiated a position in 10x Genomics, Inc., a company that sells innovative instruments and reagents for life sciences research. The company’s first platform, the Chromium, is dominant within the single-cell space. The Chromium utilizes advanced microfluidics to separate a sample into individual cells. Each cell is enveloped in its own droplet, where an individual reaction occurs to detect the expression profile of that cell. This occurs in parallel across tens of thousands of droplets, enabling high-throughput and granular characterization of a sample. 10x Genomics’ second platform is the Visium platform for spatial analysis. Visium employs a slide with many small dots (55 microns in diameter), each of which has a unique barcode. The barcodes are read by next-generation sequencing equipment. This enables researchers to detect expression patterns (genetic behavior) across geographic regions of a tissue sample. Finally, the company is launching its third major platform, the Xenium for in-situ analysis. The in-situ platform allows researchers to visualize biomarkers of interest right on the tissue slide, in real time. The images are processed on-instrument versus Visium, which requires barcodes that a separate sequencer reads.
Our conviction in 10x Genomics is driven by multiple growth drivers over the next several years. First, for the single-cell platform, the company has a new kit called Flex that enables sample multiplexing and working with FFPE (preserved) samples. We think this opens up translational studies that rely on archival samples. This marks an opportunity to expand into biopharmaceuticals (whereas historically the company has been predominantly conducting basic research). Second, we think there is upside from the new product cycle with the in-situ Xenium. We believe the platform is differentiated by its throughput, paired with a panel approach that allows customers to add customization to their research projects. In the near term,10X Genomics’ margins may be pressured by the bolus of Xenium boxes being placed, which are generally, lower-margin razors . This will eventually lead to a stream of consumables (razor blades) sales at much higher margins. We like 10x Genomics as a high-quality life science research company with multiple shots on goal . The company has a strong balance sheet with $400 million in cash and no debt, and with visibility to FCF breakeven in the near term. We see 10x Genomics as a consistent double-digit grower, with over 80% of revenues coming from high-margin and recurring consumables, roughly 70% gross margins, and a path to over 30% EBITDA margins longer term.
Table VI.
Top net sales for the quarter ended September 30, 2023
| Year Acquired |
| Market Cap When Acquired (billions) |
| Quarter End Market Cap or Market Cap When Sold (billions) |
| Net Amount Sold (millions) |
| Kinsale Capital Group, Inc. 2016 |
| $0.4 |
| $9.6 |
| $12.4 |
| Allegro MicroSystems, Inc. 2020 |
| 0.4 |
| 6.1 |
| 11.5 |
| Boyd Gaming Corporation 2021 |
| 7.3 |
| 6.1 |
| 9.7 |
| Qualys, Inc. 2013 |
| 0.7 |
| 5.6 |
| 7.3 |
| Abcam plc 2023 |
| 3.6 |
| 4.9 |
| 7.3 |
We trimmed our positions in Kinsale Capital Group, Inc . and Boyd Gaming Corporation to manage their respective position sizes as part of our risk management efforts. We continue to remain positive about both companies’ long-term prospects. We trimmed our positions in Allegro MicroSystems, Inc. (ALGM) and in Qualys, Inc. (QLYS) based upon our longer-term valuation estimates. We sold our Abcam plc (ABCM) investment (a leading provider of customized antibodies for biologic research and drug development) during the quarter. After a tumultuous round of public squabbling between the company and one of its founders, Danaher Corp. ultimately made an acquisition bid for the company that was accepted by Abcam’s board of directors. We believe that even though the founder continues to agitate for a higher price, the bid from Danaher was fair.
Outlook
It has been a wonderful 10-year journey for us. We want to give our heartfelt thanks to all our shareholders for your long-term support. If it were not for you, we would not be here. We also want to thank the entire team at Baron whose help and support have been invaluable to us. Our success truly is a team effort.
Randy Gwirtzman & Laird Bieger
Investors should consider the investment objectives, risks, and charges and expenses of the investment carefully before investing. The prospectus and summary prospectus contain this and other information about the Funds. You may obtain them from the Funds’ distributor, Baron Capital, Inc., by calling 1-800-99-BARON or visiting baronfunds.com. Please read them carefully before investing.
Risks: Specific risks associated with investing in smaller companies include that the securities may be thinly traded and more difficult to sell during market downturns. Even though the Fund is diversified, it may establish significant positions where the Adviser has the greatest conviction. This could increase volatility of the Fund’s returns.
The Fund may not achieve its objectives. Portfolio holdings are subject to change. Current and future portfolio holdings are subject to risk.
The discussions of the companies herein are not intended as advice to any person regarding the advisability of investing in any particular security. The views expressed in this report reflect those of the respective portfolio manager only through the end of the period stated in this report. The portfolio managers’ views are not intended as recommendations or investment advice to any person reading this report and are subject to change at any time based on market and other conditions and Baron has no obligation to update them.
This report does not constitute an offer to sell or a solicitation of any offer to buy securities of Baron Discovery Fund by anyone in any jurisdiction where it would be unlawful under the laws of that jurisdiction to make such offer or solicitation.
Alpha measures the difference between a fund’s actual returns and its expected performance, given its level of risk as measured by beta. Beta explains common variation in stock returns due to different stock sensitivities to market or systematic risk that cannot be explained by the US Country factor. Positive exposure indicates high beta stock. Negative exposure indicates low beta stock. Price/Earnings Ratio (next 12-months) : is a valuation ratio of a company’s current share price compared to its mean forecasted 4 quarter sum earnings per share over the next twelve months. If a company’s EPS estimate is negative, it is excluded from the portfolio-level calculation. Enterprise value (EV) is a measure of a company’s total value, often used as a more comprehensive alternative to equity market capitalization. EV includes in its calculation the market capitalization of a company but also short-term and long-term debt as well as any cash on the company’s balance sheet. Free cash flow ((FCF)) represents the cash that a company generates after accounting for cash outflows to support operations and maintain its capital assets.
The Morningstar Rating ™ for funds, or “star rating”, is calculated for managed products (including mutual funds, variable annuity and variable life subaccounts, exchange-traded funds, closed-end funds, and separate accounts) with at least a three-year history. Exchange-traded funds and open-ended mutual funds are considered a single population for comparative purposes. It is calculated based on a Morningstar Risk Adjusted Return measure that accounts for variation in a managed product’s monthly excess performance, placing more emphasis on downward variations and rewarding consistent performance. The Morningstar Rating does not include any adjustment for sales loads. The top 10% of products in each product category receive 5 stars, the next 22.5% receive 4 stars, the next 35% receive 3 stars, the next 22.5% receive 2 stars, and the bottom 10% receive 1 star. The Overall Morningstar Rating for a managed product is derived from a weighted average of the performance figures associated with its three-, five-, and 10-year (if applicable) Morningstar Rating metrics. The weights are: 100% three-year rating for 36-59 months of total returns, 60% five-year rating/40% three-year rating for 60-119 months of total returns, and 50% 10-year rating/30% five-year rating/20% three-year rating for 120 or more months of total returns. While the 10-year overall star rating formula seems to give the most weight to the 10- year period, the most recent three-year period actually has the greatest impact because it is included in all three rating periods.
BAMCO, Inc. is an investment adviser registered with the U.S. Securities and Exchange Commission (SEC). Baron Capital, Inc. is a broker-dealer registered with the SEC and member of the Financial Industry Regulatory Authority, Inc. (FINRA).
Editor's Note: The summary bullets for this article were chosen by Seeking Alpha editors.
For further details see:
Baron Discovery Fund Q3 2023 Quarterly Letter