ACGLN - Baron Durable Advantage Fund Q3 2023 Shareholder Letter
2023-11-05 04:40:00 ET
Summary
- Baron is an asset management firm focused on delivering growth equity investment solutions known for a long-term, fundamental, active approach to growth investing.
- Baron Durable Advantage Fund lost 0.6% in Q3, outperforming the S&P 500 Index's 3.3% loss.
- The Fund is up 27.7% year-to-date, recovering from last year's drawdown.
- The Fund's holdings experienced a multiple contraction of 7.4% in Q3 due to rising rate expectations and deteriorating investor sentiment.
DEAR BARON DURABLE ADVANTAGE FUND SHAREHOLDER:
PERFORMANCE
Baron Durable Advantage Fund ® (the Fund) lost 0.6% (Institutional Shares) during the third quarter, which compared favorably to the 3.3% loss for the S&P 500 Index (the Benchmark). Year-to-date, the Fund is up 27.7% compared to 13.1% for the Benchmark, and we have recovered nearly all of the 24.8% drawdown experienced last year.
Table I. Performance Annualized for periods ended September 30, 2023
| Baron Durable Advantage Fund Retail |
| Baron Durable Advantage Fund Institutional Shares 1,2 |
| S&P 500 Index 1 |
| Three Months 3 |
| (0.66)% |
| (0.55)% |
| (3.27)% |
| Nine Months 3 |
| 27.44% |
| 27.71% |
| 13.07% |
| One Year |
| 33.36% |
| 33.65% |
| 21.62% |
| Three Years |
| 10.68% |
| 10.95% |
| 10.15% |
| Five Years |
| 12.91% |
| 13.18% |
| 9.92% |
| Since Inception (December 29, 2017) |
| 12.53% |
| 12.79% |
| 10.48% |
| Performance listed in the table above is net of annual operating expenses. The gross annual expense ratio for the Retail and Institutional Shares as of September 30, 2022 was 1.49% and 1.10%, respectively, but the net annual expense ratio was 0.95% and 0.70% (net of the Adviser’s fee waivers), respectively. The performance data quoted represents past performance. Past performance is no guarantee of future results. The investment return and principal value of an investment will fluctuate; an investor’s shares, when redeemed, may be worth more or less than their original cost. The Adviser reimburses certain Fund expenses pursuant to a contract expiring on August 29, 2034, unless renewed for another 11-year term and the Fund’s transfer agency expenses may be reduced by expense offsets from an unaffiliated transfer agent, without which performance would have been lower. Current performance may be lower or higher than the performance data quoted. For performance information current to the most recent month end, visit Baron Funds - Asset Management for Growth Equity Investments or call 1-800-99-BARON. 1 The S&P 500 Index measures the performance of 500 widely held large cap U.S. companies. The Fund includes reinvestment of dividends, net of withholding taxes, while the S&P 500 Index includes reinvestment of dividends before taxes. Reinvestment of dividends positively impacts the performance results. The index is unmanaged. Index performance is not Fund performance; one cannot invest directly into an index. 2 The performance data in the table does not reflect the deduction of taxes that a shareholder would pay on Fund distributions or redemption of Fund shares. 3 Not annualized. |
To a casual observer, a modest pullback in the third quarter might seem par for the course. After two consecutive quarters of strong double-digit gains, a small step back and a period of consolidation would seem to be appropriate. That, of course, does not tell the entire story.
The quarter began with a steady dose of good news. Inflation continued to slow down to around 3.7%, while growth and economic activity remained surprisingly strong. Federal Reserve (the Fed) Chairman Jerome Powell pointed out in a speech that the U.S. economy has been more resilient than almost anyone expected. The probability of a soft landing was steadily increasing. The Benchmark rose 3.2% in the month of July, while Fund gained an additional 4.5% on top of the 28.4% gain in the first six months of the year. But just as night follows day, the talk of good news makes investors think of the bad news that could follow. The obvious bad news scenario is higher interest rates or as the talking heads refer to it higher for longer . And so, while the Fed kept rates on hold for now, it delivered a stern message and managed to jolt the markets into believing that borrowing costs are going to stay higher for a while, the implication being fewer rate cuts next year with a potential negative impact on the broader economy. Add to this $90 oil, the expanding auto workers strike, the prospect of a government shutdown and the increasing geopolitical uncertainty; and the context for a market pullback was set. The Benchmark lost 1.6% in August and another 4.8% in September, while the Fund declined 0.6% and 4.3%, respectively. It is unusual for any portfolio to go up more and be down less than the market for any meaningful period of time, but it is what we experienced in the third quarter and year-to-date, so far.
In our last quarterly letter, we explained how we believe stock prices have two components to them: business fundamentals, which can be measured by revenues, earnings, and ultimately cash flows, and then a multiple that investors are willing to pay for those fundamentals. During the third quarter, our analysis suggests that at the portfolio level, the fundamentals of our businesses improved with revenue and profit expectations rising, while the multiples of how much investors were willing to pay for these profits took another leg down, declining 7.4%, and making our companies even more attractive in our view.
From a performance attribution perspective, 215bps of the Fund’s 268bps of outperformance was driven by stock selection, which was positive in every sector in which we were invested, except for Industrials, which detracted 8bps. The positive effect of sector allocation was responsible for the rest. We had a consistent quarter, outperforming in all sectors except Energy, which unfortunately was the best performing sector in the Benchmark, up 12.2%, and not owning any Energy stocks detracted 65bps from relative returns. In a flattish quarter, there were not many insights from the contribution of individual investments. We had 14 contributors against 16 detractors. There were no meaningful winners or large losers. Our top five contributors – Meta, Intuit, Alphabet, Blackstone, and Arch Capital – added 160bps to absolute returns, while the top five detractors – Microsoft, Monolithic Power Systems, S&P Global, Taiwan Semiconductor, and Moody’s – detracted 186bps.
At the risk of sounding like a broken record, we continue to have a lot of confidence that the decline in stock prices of our detractors is unlikely to result in a permanent loss of capital. Consistent with that, our largest detractor this quarter was also our largest add – Microsoft. We believe the company’s competitive advantages remain extremely durable and it is well positioned to capitalize on the disruptive innovation driven by generative AI (Gen AI), benefiting from its incumbency, go-to-market advantages, leading position in the cloud (Azure), and from its investment in OpenAI (the provider of ChatGPT as well as other GenAI developer tools and APIs [1] ).
Looking under the hood, company fundamentals are stable and appear to be improving
At the portfolio level, the positive fundamental trends we observed in the second quarter continued into the third quarter. Weighted average revenue growth expectations for 2023 increased by 1.9%, or by 0.8% if we exclude NVIDIA . We wrote at length about NVIDIA earlier this year, but it is worth mentioning that the company has continued to exceed its own projections and the Street’s most optimistic expectations. After raising its revenue and EPS guidance for 2023 by 40% and 69%, respectively, following its last quarter, NVIDIA increased it further by 26% and 35%, respectively, after reporting the most recent one. Consensus expectations now call for revenues to grow 94% this year, while earnings per share are expected to increase 192%. You may have seen these kinds of growth rates before, but we doubt you saw them from a company generating $50 billion in revenues. The skeptics who continue to question and doubt the accelerating demand for Gen AI forgot to tell NVIDIA about it. But we digress…Back to the portfolio…profit expectations have risen even faster than revenues and were up 5.0% during the third quarter (or up 3.4% ex-NVIDIA) with margin expectations up 46bps (25bps ex-NVIDIA). So, broadly speaking, our companies are seeing continued improvement in overall business trends, which flow through to their bottom lines, driving higher margins. We are also starting to see the benefits of leaner cost structures and more disciplined capital allocation compared to two or three years ago when capital was both cheaper and more readily available.
Could our companies’ fundamentals start to deteriorate again? Sure, if macro headwinds intensify. Would it significantly impair their long-term value? Unlikely, in our view. The majority of the businesses we own have no financial leverage and are capital light – meaning that higher interest rates would not directly have a negative impact on their businesses (with some, like LPL Financial, actually benefiting from higher rates). They are leaders in their industries and should continue to benefit from customers consolidating in favor of their most important vendors. They are run by what we believe are great management teams and offer critical solutions to their customers, which makes them stickier and gives them pricing power.
But multiples took another leg down…
While fundamentals appear to have turned the corner, the Fund’s holdings experienced a multiple contraction of 7.4% during the third quarter [4] as we continue to operate in a challenging environment. The culprit behind the multiple contraction in the quarter was a combination of rising rate expectations or the higher-for-longer narrative, along with deteriorating investor sentiment, which led to a sell-off in high-quality, but longer duration assets. The bears argue that higher for longer will undoubtedly lead to a recession as consumers have depleted the extra savings from the COVID period, and they are now facing a resumption of student loan payments and rising credit card bills. In the meantime, the affordability of large purchases like houses or cars has deteriorated (mortgage rates are approaching 8%, while car loan rates are even higher). The bulls continue to argue that the tightening cycle is mostly over, and that the economy has proven to be resilient as is evidenced by strong GDP and employment growth numbers. Inflation has been mostly tamed, and the next major Fed move in interest rates (sooner or later) is surely down. The 10-Year inflation break-even rate, which we like to look at, has been hovering around 2.0% to 2.5%. A recession is far from a foregone conclusion, and we believe the Fed has likely threaded the needle and engineered a soft landing. While we do not belong to either camp, we would point out that if the bears are right and the economy slips into a recession, the Fed will likely lower rates sooner and will do so more aggressively, whereas if the bulls prove to be correct, inflation will likely remain stickier leading to even higher-for-longer rates than investors are currently pricing in. This logic is of course circular with each argument leading into and supporting the other, enabling both sides to continue to stand their ground.
Mega caps and the Magnificent Seven are still dominating Index returns year-to-date.
As of the end of the third quarter, large caps, which are defined as companies with market cap of $143.6 billion or above and represented 55.6% of the Benchmark, were responsible for 90% of the Benchmark’s year-to-date gain of 13.1%. Within the large-cap group lies the Magnificent Seven, which we like to classify as mega caps. The Magnificent Seven continue to lead the Benchmark’s returns – Amazon , Alphabet, Meta, Apple, Tesla, NVIDIA, and Microsoft were up an impressive 88% on average year-to-date, and they were responsible for 84.5% of the total Benchmark return, while representing 25% of its weight. We own five of the seven – no Apple, and no Tesla. Interestingly, most of the stock price gains year-to-date have been driven by improving profits rather than multiple expansion. NVIDIA’s P/E multiple (on forward 12-month consensus EPS estimates) is down 13.5%, while Amazon’s P/E multiple has declined 6.6%. For Microsoft, Meta, and Alphabet the equation is more balanced with multiple appreciation from historically low levels of last year accounting for 41% of their stock gains year-to-date.
Why have the mega caps outperformed?
During times of increased uncertainty and stress, investors’ time horizons shrink significantly. With their focus shifting to the here and now, current profitability and cash-flow generation take center stage. All of these companies have a few things in common: they are highly profitable, they have no or low debt, so they’re not highly levered, they have high returns on invested capital, and historically, they have always used recessions and economic turmoil to their advantage. As the competitors and the upstarts struggle and are forced to pull back because they’re fighting for survival, the leaders take market share, consolidate their power, and often emerge even stronger than they were before. It is also worth mentioning that growth in passive investment vehicles has led to increased allocation to the largest market cap stocks (they are biggest weights in indexes) as passive index funds and ETFs must continually buy without regard to fundamentals or valuations.
Is there anything we can do to reduce or mitigate the risk of further multiple contraction?
Sure. We could sell higher-multiple higher-quality businesses and buy lowermultiple lower-quality ones. We could rotate out of Technology, Health Care, Consumer Discretionary, and Financials into Energy, Consumer, Utilities, or Gold. We could sell and go to cash. The main reason we do not employ these tactics is that we do not rent stocks – we own businesses. A long-term ownership mindset is foundational to our investment philosophy and process, and we are willing to live with the volatility of valuation multiples and stock prices over full-market cycles.
We don’t rotate sectors, go to cash, or buy mediocre businesses because it is outside of our circle of competence, and because we believe that investing in high-quality businesses over the long term will enable us to outperform the indexes even though we may have to endure higher market volatility. Furthermore, the less attractive longer-duration stocks become to other market participants due to short-term issues and concerns, the more attractive they become to us as long-term investors – all else being equal, we would rather buy a business when its selling at a larger discount because everyone is focused on the here and now at the expense of thinking and analyzing the long-term prospects of the business. That said, since we focus on more mature and stable businesses for this Fund, it has exhibited significantly lower volatility, both up and down, than our other Big Idea strategies, and we would expect that to continue to be the case.
It is important not to lose sight that mathematically, an investor’s return will be determined by the change in multiple over the holding period, multiplied by the compounding growth in business’ fundamentals over the holding period. The longer the holding period, the less important changes in multiples become (since these multiple changes are linear, while fundamentals compound exponentially). The weighted average multiple for the Fund declined 26% in 2022, and we have recovered only a small portion of it year-to-date (though we recovered most of the drawdown due to profit growth). Fundamentals continue to compound, making current stock prices attractive for long-term investors, in our view.
Table II. Top contributors to performance for the quarter ended September 30, 2023
| Quarter End Market Cap (billions) |
| Percent Impact |
| Meta Platforms, Inc. ( META ) |
| $772.5 |
| 0.38% |
| Intuit Inc. ( INTU ) |
| 143.2 |
| 0.33 |
| 1,656.2 |
| 0.33 |
| Blackstone Inc. ( BX ) |
| 130.2 |
| 0.29 |
| Arch Capital Group Ltd. ( ACGL ) |
| 29.7 |
| 0.27 |
Shares of Meta Platforms, Inc., the world’s largest social network, were up 4.6% this quarter, driven by a reacceleration of revenue growth to over 13% year-over-year (in constant currency) as a result of a broader improvement in the digital advertising market along with strong adoption of newer advertising products such as Instagram Reels. We are also beginning to see Meta incorporating GenAI as part of the user experience in its core applications, while the company’s innovation in GenAI has resulted in some of the most popular open-source GenAI models to date (e.g., LlaMa2), which add to future optionality. Meta’s increasing focus on profitability, which drove significant layoffs and reductions in office footprint, should enable the company to benefit from operating leverage as revenues reaccelerate. Lastly, core app engagement remains healthy, with video and Instagram Reels proving to be incremental to user engagement. Longer term, we believe Meta will utilize its leadership in mobile advertising, massive user base, innovative culture, leading GenAI research, and scale to maintain durable growth for years to come, with further monetization opportunities ahead.
Intuit Inc. is the leading provider of accounting software for small businesses and tax preparation software for individuals and tax professionals. Shares increased 11.7% during the quarter after the company reported financial results that exceeded Street expectations, with 13% yearover-year revenue growth and 22% EPS growth in the recently completed fiscal year. Management also provided favorable guidance for the next fiscal year that demonstrated confidence in the business’ momentum despite macroeconomic uncertainty. Intuit is benefiting from the sale of highervalue services and is well positioned to capitalize on increasing adoption of artificial intelligence given the company’s vast and proprietary data assets. We continue to own the stock due to Intuit’s strong competitive position and numerous growth opportunities as it solves more problems over time for its consumers and SMB customers.
Alphabet Inc. is the parent company of Google, the world’s largest search and online advertising company. Shares of Alphabet were up 8.9% this quarter, reflecting solid financial results, with second quarter revenues accelerating to over 9% year-over-year (in constant currency) with 29% operating margins, along with continued product innovation in GenAI that boosted investor sentiment after the heightened initial doubt around the potential intensifying competition from ChatGPT and Microsoft. We believe Alphabet’s attractive business model and massive scale, particularly in its core assets of Search, YouTube, and the Google ad network, will enable it to sustain its competitive positioning. We continue to closely monitor the rapidly evolving GenAI space and the potential implications it may have on consumer behavior around Search, including the incorporation of AI assistants. While OpenAI was the early mover in introducing a consumer facing assistant, we believe that Alphabet’s talent in AI remains world class in both scale and quality. We also believe that Alphabet’s own GenAI innovation should lead to product improvements across Google’s existing product set and in adjacent fields (e.g., travel) while the company’s cloud business (Google Cloud Platform or GCP) would also benefit from the adoption of GenAI.
Table III. Top detractors from performance for the quarter ended September 30, 2023
| Quarter End Market Cap (billions) |
| Percent Impact |
| Microsoft Corporation ( MSFT ) |
| $2,345.9 |
| –0.56% |
| Monolithic Power Systems, Inc. ( MPWR ) |
| 22.1 |
| –0.43 |
| S&P Global Inc. ( SPGI ) |
| 116.3 |
| –0.35 |
| Taiwan Semiconductor Manufacturing Company Limited ( TSM ) |
| 420.1 |
| –0.31 |
| Moody’s Corporation ( MCO ) |
| 58.0 |
| –0.22 |
Microsoft Corporation is a software company traditionally known for its Windows and Office products. Over the last five years, it has built a $60-plus billion cloud business, including its infrastructure-as-a-service Azure business, Office 365, and Dynamics 365 (Microsoft’s CRM offering). We believe investors took some profits in the third quarter. After the stock rose over 40% in the first six months of the year, the stock was down 7.0% this quarter following the company’s earnings release in which it provided guidance for the first fiscal quarter of 2024 that was shy of investor expectations by approximately 1%. While Microsoft is continuing to see better performance in Azure for the third straight quarter and slightly better quarter-over-quarter trends captured in its guidance, the rate of improvement specifically in AI-related workloads was below investor expectations. Looking at the big picture, we remain confident that Microsoft remains well positioned over the long term to further deepen its software ecosystem, while utilizing its large installed base and go-to-market leadership to gain market share. Over time, we expect Microsoft to infuse AI across its entire product portfolio, driving strong value for customers and incremental monetization opportunities for itself. Over 100% of the stock’s decline during the quarter was driven by multiple contraction, which further contributed to our decision to add to our position.
Monolithic Power Systems, Inc. is a fabless high-performance analog and power semiconductor company serving diverse end markets across the semiconductor industry. The company, a relatively small player in the industry, leverages its deep system-level and applications knowledge, strong design experience, and innovative process technologies to provide highly integrated, energy-efficient, cost-effective, and easy-to-use monolithic products to its customers. The company’s shares declined 14.4% this quarter after rising over 50% in the first six months of the year. Shares declined due to growing investor concerns around the semiconductor cycle and weakening demand in various key end markets. While near-term growth drivers such as AI and automotive were not large enough to offset the weakness in other end markets like notebooks, industrial, and CPU power, we believe that the company should return to revenue growth of 10% to 15% above the broader industry when the demand environment improves. The company continues to expand its addressable market and drive strong market share gains by taking advantage of areas where its competition has failed to innovate. It has also started to sell more integrated, higher-priced modules as opposed to discrete products, generating additional abovemarket growth. With the entire stock price decline during the quarter driven by multiple contraction, we decided to add to our position.
Shares of rating agency and data provider S&P Global Inc. gave back some gains from earlier this year, and after rising 20% during the first half, declined 8.7% in the third quarter. The correction was due to investor concerns that rising interest rates will weigh on future debt issuance and asset-based fees. Management also removed its 2026 target for revenue from the ESG segment due to a more uncertain regulatory landscape and political climate. On a positive note, S&P Global reported strong second quarter financial results, with 7% adjusted revenue growth and 11% EPS growth as ratings issuance returned to growth for the first time in six quarters. Management maintained full-year guidance as a more favorable outlook for the ratings and indices segments offset slower growth in the market intelligence segment. We continue to own the stock and have added to our position due to the company’s long runway for growth and significant competitive advantages, while over 100% of the stock’s decline during the quarter was due to multiple contraction.
PORTFOLIO STRUCTURE
The portfolio is constructed on a bottom-up basis with the quality of ideas and conviction level, rather than Benchmark composition and weights, determining the size of each individual investment. Sector weights tend to be an outcome of the stock selection process and are not meant to indicate a positive or a negative view.
As of September 30, 2023, our top 10 positions represented 53.0% of the Fund, the top 20 represented 81.5%, and we exited the quarter with 30 investments, unchanged from the second quarter.
IT and Financials represented 61.5% of the Fund, while Communication Services, Health Care, Consumer Discretionary, Consumer Staples, and Industrials represented another 35.9%, with the remaining 2.6% held in cash and cash equivalents.
Table IV. Top 10 holdings as of September 30, 2023
| Quarter End Market Cap (billions) |
| Quarter End Investment Value (millions) |
| Percent of Net Assets |
| Microsoft Corporation ( MSFT ) |
| $2,345.9 |
| $9.2 |
| 9.2% |
| Meta Platforms, Inc. ( META ) |
| 772.5 |
| 7.3 |
| 7.2 |
| Amazon.com , Inc. ( AMZN ) |
| 1,311.6 |
| 7.1 |
| 7.1 |
| Arch Capital Group Ltd. ( ACGL ) |
| 29.7 |
| 4.8 |
| 4.8 |
| 1,656.2 |
| 4.8 |
| 4.8 |
| UnitedHealth Group Incorporated ( UNH ) |
| 467.0 |
| 4.3 |
| 4.3 |
| Nvidia Corporation ( NVDA ) |
| 1,074.4 |
| 4.2 |
| 4.2 |
| Visa Inc. ( V ) |
| 480.2 |
| 4.0 |
| 4.0 |
| S&P Global Inc. ( SPGI ) |
| 116.3 |
| 3.9 |
| 3.9 |
| Intuit Inc. ( INTU ) |
| 143.2 |
| 3.5 |
| 3.5 |
RECENT ACTIVITY
During the third quarter, we added to 28 of our holdings as we put the Fund’s inflows to work.
Table V. Top net purchases for the quarter ended September 30, 2023
| Quarter End Market Cap (billions) |
| Net Amount Purchased (millions) |
| Microsoft Corporation |
| $2,345.9 |
| $3.1 |
| Alphabet Inc. |
| 1,656.2 |
| 1.3 |
| Adobe Inc. |
| 232.2 |
| 1.0 |
| Arch Capital Group Ltd. |
| 29.7 |
| 1.0 |
| UnitedHealth Group Incorporated |
| 467.0 |
| 1.0 |
Microsoft Corporation was our largest addition during the quarter. While near-term uncertainty regarding customer cloud optimization efforts continues to cast a cloud (pun intended) around the timing of a reacceleration in the company’s Azure business, we believe it is a question of when, and not if. Additionally, we believe that the company remains well positioned in GenAI, through both its investment in Open AI, which was recently reported to have reached a revenue run rate of $1.3 billion, as well as through its own GenAI cloud solutions (from GitHub Co-Pilot, Microsoft Co-Pilot, Azure AI services and more). We continue to believe that Microsoft is well positioned to be a beneficiary of GenAI as the company adopts it across its existing product base, creating incremental monetization opportunities (for example, Microsoft Co-Pilot is priced at $30 per user per month), and as its customers further accelerate digital transformation to take advantage of GenAI.
We also added to our position in Alphabet Inc. during the quarter. While there is a range of outcomes over the potential result from the recent DOJ lawsuit as well as the potential impact of GenAI on the company’s business, we have decided to add to our position for several reasons. First, while we don’t believe it to be a high probability outcome, even in a scenario in which Alphabet is required to split up its various assets, we believe the parts may be worth more than the whole (as various parts of the business, such as Google Cloud, are under-earning today). Second, we believe that the company’s world-class talent in AI and years of being at the cutting edge of AI research will help it sustain its competitive advantages while the company’s scale and proprietary data assets should enable it to sustain a long duration of growth as it infuses AI into its products. Finally, we believe that Alphabet’s core business is on solid footing, as advertisers will continue to be attracted to it as long as user engagement remains high. Google’s market share in search is still above 90% (and has not declined) and we have not seen any data to suggest this is likely to change. We have therefore decided to add to our position.
Our next largest add was to the leading creative, document, and marketing cloud software provider, Adobe Inc. , which investors initially considered a GenAI loser, continues to execute well, introducing a host of GenAI solutions from its content creation platform, Adobe Firefly, to its marketing AI solutions that would enable personalization at scale and real time optimization of customer experiences. The company has also continued to show strong performance in its core business. The company reported a 12% beat in net new digital media annual recurring revenues in the last quarter, overall revenue growth was 13% year-over-year (in constant currency), and operating margins were over 46%.
We also put the Fund’s inflows to work with the next two largest adds into the property and casualty insurance company, Arch Capital Group Ltd. , and the health care insurance and solutions provider, UnitedHealth Group Incorporated .
Arch Capital has a long history of world-class management execution, proving itself as an exceptional capital allocator, across insurance cycles and with a strong underwriting discipline over many years. Its most recent financial results continue to show similar excellence with an 18% year-overyear growth in book value per share, while achieving a combined ratio below 80%.
UnitedHealth Group is another solid durable business that has a long history of exceptional results. The stock has been weak this year because of some near-term concerns that we viewed as an opportunity for longer-term investors. Investors were namely concerned about higher utilization trends in outpatient procedures (mostly for seniors) potentially due to pent-up demand from COVID, which led the company to guide for a medical loss ratio ( MLR ) at the higher end of their historical range at over 82%. The company’s recent third quarter results showed utilization continuing at heightened levels, but the company was able to more adequately price for it, beating expectations on MLR. We believe UnitedHealth is the bestpositioned managed-care player, with a leading franchise in Medicare Advantage, the market’s fastest growing segment. We expect continued strong growth and profitability, driven by positive demographic trends, effective cost management through economies of scale, industry-leading technology investments, enhanced expertise in population health, and a growing portfolio of providers, all of which enable UnitedHealth to keep and effectively manage more of its health care spending in-house.
Table VI. Top net sales for the quarter ended September 30, 2023
| None |
OUTLOOK
It seems that the topic du jour of financial commentators moved from “how high can rates go?” to “how long would rates need to stay at these higher levels?”, or the higher-for-longer discussion. The bond market has clearly moved in that direction with the 10-Year Treasury bond yield increasing nearly 100bps from 3.81% as of the end of the second quarter to 4.80% at the end of the third. This caused the Vanguard Long-Term Bond ETF to crater 14% from the beginning of the quarter through the middle of October. In the meantime, the 10-year break-even inflation rates remain in the 2.0% to 2.5% range, where they have been for the last three years, and real rates (as measured by 10-Year TIPS) have risen all the way up to 2.3%. We get why long-duration assets sell off on higher for longer, but we are uncertain how sustainable/persistent it will turn out to be. We think the consensus view on higher has already moved to not much higher , and we think the answer to how much longer is not much longer. In other words, it will be measured in months or quarters and not years, which for our purposes – is not much longer at all.
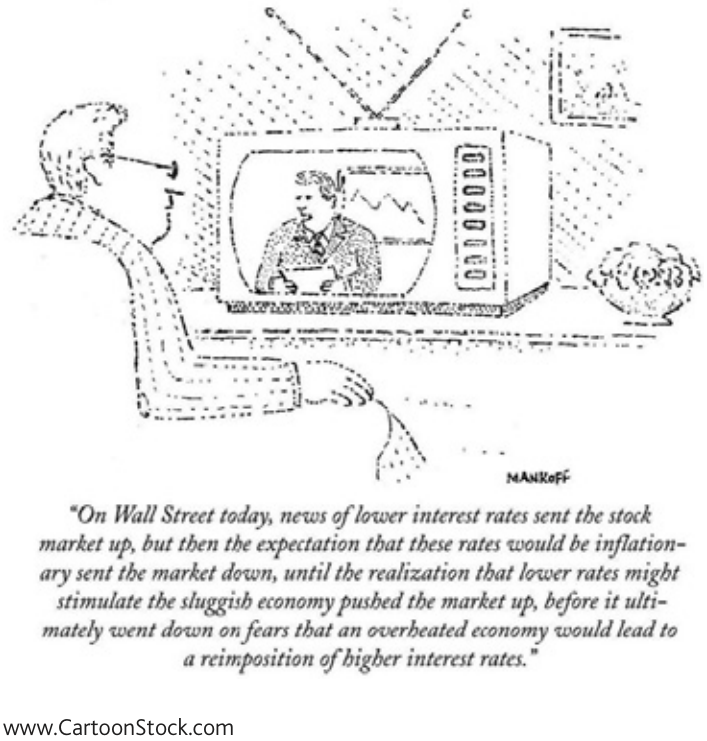
It also never stops to amuse us how the market can react to similar data one way on a good day, and in an entirely different way on a bad one. After the August job openings (JOLTS) report was published on Tuesday, October 3, showing that the economy had 9.6 million job openings, which was more than expected, the market sold off, with the Benchmark losing 1.4%, and the Russell 2000 Growth Index down 1.8%. One could make sense of this move as supporting the higher-for-longer narrative and 10-Year Treasuries did in fact spike 12bps that day in response to the news. Then on Friday, October 6, we got the nonfarm payroll report, showing again a much higherthan-expected number of 336,000 as compared to consensus expectations of 170,000. Rather a consistent data point with what we saw just three days earlier. But the Benchmark went straight up that day closing with a 1.2% gain, while the Russell 2000 Growth Index rose 1.1%, with what looked to us like very similar and consistent data causing the exact opposite effect on market movement and our stock prices.
This reminded us of the famous Mankoff cartoon from 1981:
Every day, we live and invest in an uncertain world. Well-known conditions and widely anticipated events, such as Fed rate changes, ongoing trade disputes, government shutdowns, and the unpredictable behavior of important politicians the world over, are shrugged off by the financial markets one day and seem to drive them up or down the next. We often find it difficult to know why market participants do what they do over the short term. The constant challenges we face are real and serious, with clearly uncertain outcomes. History would suggest that most will prove passing or manageable. The business of capital allocation (or investing) is the business of taking risk, managing the uncertainty, and taking advantage of the long-term opportunities that those risks and uncertainties create. We are confident that our process is the right one, and we believe that it will enable us to make good investment decisions over time. Our goal is to invest in large-cap companies with, in our view, strong and durable competitive advantages, proven track records of successful capital allocation, high returns on invested capital, and high free-cash-flow generation, a significant portion of which is regularly returned to shareholders in the form of dividends or share repurchases. It is our belief that investing in great businesses at attractive valuations will enable us to earn excess risk-adjusted returns for our shareholders over the long term. We are optimistic about the prospects of the companies in which we areinvested and continue to search for new ideas and investment opportunities.
Sincerely,
Alex Umansky, Portfolio Manager
Footnotes1 API stands for Application Programming Interface. OpenAI provides APIs for developers to tap into its GenAI solutions, enabling them to embed GenAI into their own custom software programs. 2 We calculate the weighted average change for the portfolio and either use a P/E multiple or an EV/Revenue multiple based on FactSet consensus expectations for the next 12 months for each stock (and choose which multiple to use depending on whether the company has significant near-term profits on which a meaningful P/E can be calculated). Investors should consider the investment objectives, risks, and charges and expenses of the investment carefully before investing. The prospectus and summary prospectus contain this and other information about the Funds. You may obtain them from the Funds’ distributor, Baron Capital, Inc., by calling 1-800-99-BARON or visiting Baron Funds - Asset Management for Growth Equity Investments . Please read them carefully before investing. RisksThe Fund invests primarily in equity securities, which are subject to price fluctuations in the stock market. In addition, because the Fund invests primarily in large-cap company securities, it may underperform other funds during periods when the Fund’s securities are out of favor. The Fund may not achieve its objectives. Portfolio holdings are subject to change. Current and future portfolio holdings are subject to risk. The discussions of the companies herein are not intended as advice to any person regarding the advisability of investing in any particular security. The views expressed in this report reflect those of the respective portfolio managers only through the end of the period stated in this report. The portfolio manager’s views are not intended as recommendations or investment advice to any person reading this report and are subject to change at any time based on market and other conditions and Baron has no obligation to update them. This report does not constitute an offer to sell or a solicitation of any offer to buy securities of Baron Fifth Avenue Growth Fund by anyone in any jurisdiction where it would be unlawful under the laws of that jurisdiction to make such offer or solicitation. Free cash flow ((FCF)) represents the cash that a company generates after accounting for cash outflows to support operations and maintain its capital assets. BAMCO, Inc. is an investment adviser registered with the U.S. Securities and Exchange Commission (SEC). Baron Capital, Inc. is a broker-dealer registered with the SEC and member of the Financial Industry Regulatory Authority, Inc. (FINRA). |
Editor's Note: The summary bullets for this article were chosen by Seeking Alpha editors.
For further details see:
Baron Durable Advantage Fund Q3 2023 Shareholder Letter