ARGNF - Baron Global Advantage Fund Q3 2023 Shareholder Letter
2023-11-05 10:45:00 ET
Summary
- Baron is an asset management firm focused on delivering growth equity investment solutions known for a long-term, fundamental, active approach to growth investing.
- Baron Global Advantage Fund lost 6.1% in Q3 2023, underperforming its benchmarks.
- Sector allocation and stock selection detracted from performance, with poor returns in Financials and Materials.
- The Fund remains focused on high-quality businesses and a long-term ownership mindset despite market volatility.
DEAR BARON GLOBAL ADVANTAGE FUND SHAREHOLDER:
PERFORMANCE
Baron Global Advantage Fund ® (the Fund) lost 6.1% (Institutional Shares) in the third quarter of 2023, which compares to losses of 3.4% for the MSCI ACWI Index (the Benchmark), and 4.9% for the MSCI ACWI Growth Index, the Fund’s benchmarks.
Table I. Performance † Annualized for periods ended September 30, 2023
| Baron Global Advantage Fund Retail |
| Baron Global Advantage Fund Institutional Shares 1,2 |
| MSCI ACWI Index 1 |
| MSCI ACWI Growth Index 1 |
| Three Months 3 |
| (6.11)% |
| (6.06)% |
| (3.40)% |
| (4.89)% |
| Nine Months 3 |
| 9.18% |
| 9.37% |
| 10.06% |
| 18.16% |
| One Year |
| (0.59)% |
| (0.36)% |
| 20.80% |
| 24.41% |
| Three Years |
| (14.62)% |
| (14.41)% |
| 6.89% |
| 3.76% |
| Five Years |
| 3.36% |
| 3.62% |
| 6.46% |
| 8.37% |
| Ten Years |
| 8.60% |
| 8.85% |
| 7.56% |
| 9.53% |
| Since Inception (April 30, 2012) |
| 9.21% |
| 9.46% |
| 8.32% |
| 9.94% |
| Performance listed in the table above is net of annual operating expenses. The gross annual expense ratio for the Retail Shares and Institutional Shares as of December 31, 2022 was 1.19% and 0.93%, respectively, but the net annual expense ratio was 1.15% and 0.90% (net of the Adviser’s fee waivers), respectively. The performance data quoted represents past performance. Past performance is no guarantee of future results. The investment return and principal value of an investment will fluctuate; an investor’s shares, when redeemed, may be worth more or less than their original cost. The Adviser reimburses certain Fund expenses pursuant to a contract expiring on August 29, 2034, unless renewed for another 11-year term and the Fund’s transfer agency expenses may be reduced by expense offsets from an unaffiliated transfer agent, without which performance would have been lower. Current performance may be lower or higher than the performance data quoted. For performance information current to the most recent month end, visit Baron Funds - Asset Management for Growth Equity Investments or call 1-800-99-BARON.
† The Fund’s 5- and 10-year historical performance was impacted by gains from IPOs. There is no guarantee that these results can be repeated or that the Fund’s level of participation in IPOs will be the same in the future. 1 The MSCI ACWI Index Net is designed to measure the equity market performance of large and midcap securities across 23 Developed Markets and 24 Emerging Markets countries. The MSCI ACWI Growth Index Net is designed to measure the equity market performance of large and mid cap securities exhibiting overall growth style characteristics across 23 Developed Markets countries and 24 Emerging Markets countries. MSCI is the source and owner of the trademarks, service marks and copyrights related to the MSCI Indexes. The indexes and the Fund include reinvestment of dividends, net of foreign withholding taxes, which positively impact the performance results. The indexes are unmanaged. Index performance is not Fund performance; one cannot invest directly into an index. 2 The performance data in the table does not reflect the deduction of taxes that a shareholder would pay on Fund distributions or redemption of Fund shares. 3 Not annualized. 4 We calculate the weighted average change for the portfolio and either use a P/E multiple or an EV/Revenue multiple based on FactSet consensus expectations for the next 12 months for each stock (and choose depending on whether the company has significant near-term profits on which a meaningful P/E can be calculated). 5 Cloudflare’s CEO, Matthew Prince, during the company’s second quarter, 2023, earnings call. |
The quarter began with a steady dose of good news. Inflation continued to slow down to around 3.7%, while growth and economic activity remained surprisingly strong. Federal Reserve (the Fed) Chairman Jerome Powell pointed out in a speech that the U.S. economy has been more resilient than almost anyone expected. The probability of a soft landing was steadily increasing. The Fund gained an additional 6.5% in the month of July, on top of the 16.4% gain in the first six months of the year. But just as night follows day, the talk of good news makes investors think of the bad news that could follow. The obvious bad news scenario is higher interest rates or as the talking heads refer to it higher for longer . And so, while the Fed kept rates on hold for now, it delivered a stern message and managed to jolt the markets into believing that borrowing costs are going to stay higher for a while, the implication being fewer rate cuts next year with a potential negative impact on the broader economy. Add to this $90 oil, the expanding auto workers strike, the prospect of a government shutdown, and increasing geopolitical uncertainty; and the context for a market pullback was set. The Fund lost 5.3% in August and another 6.9% in September, ending the quarter with a 6.1% loss.
From a performance attribution perspective, sector allocation detracted 174bps from the Fund’s relative results during the third quarter as compared to the MSCI ACWI, whereas stock selection detracted 94bps. Consumer Discretionary, Information Technology (IT), and Industrials were our three best sectors, generating 263bps of relative gains, which was more than offset by poor returns in Financials ( Adyen and Block ) and Materials ( Farmers Business Network ), which cost us 403bps combined. Not having investments in Energy stocks, which was by far the best sector in the benchmark (up 10.7%) and being underweight Communication Services (the second best sector) detracted an additional 90bps from our relative results.
From a geographic perspective, our emerging markets holdings contributed 45bps to our relative results, driven almost entirely by stock selection, largely due to our holdings in Brazil ( Afya ) and Poland ( InPost ). Our investments in Argentina ( MercadoLibre and Globant ) contributed another 100bps to our relative results. These positive results were more than offset by our developed market investments, which detracted 393bps. The U.S. and Netherlands were our weakest geographies, responsible for 396bps of the shortfall. While our holdings in the U.K. and Israel contributed positively (80bps), they were not large enough to offset the laggards.
At the company level there were 16 contributors and 22 detractors. Rivian , argenx , Endava , Bajaj , MercadoLibre, NVIDIA , and CrowdStrike were our largest winners contributing at least 30bps each to absolute returns, but just 300bps combined. Our two largest losers, Adyen and Farmers Business Network cost the Fund 390bps, while the 7 other 30bps or more detractors cost an additional 466bps. Adyen, the leading European payments processing platform reported decelerating growth amid increasing competitive intensity in the U.S. online market segment and the stock declined 59%. While the U.S. represents a relatively small percentage of the company’s overall business (we estimate around 20%), it is an important market for future growth. We retained a small position and continue to reassess our thesis, though our conviction in this company has clearly been shaken. Farmers Business Network, a private company that provides a two-sided marketplace for farmers and agricultural data and supplies, had a negative development during the quarter as a result of increasing pressures on the business’s agricultural inputs segment following the supply-chain imbalances that started to unwind post-COVID. The company completed a new round of financing during the quarter. We chose not to participate in this round, which caused us to revalue the price of stock significantly lower.
Looking under the hood, company fundamentals are stable.
We believe that most of the underperformance in the third quarter could be explained by several company-specific issues (e.g., Adyen and Farmers Business). At the portfolio level, the positive fundamental trends we noticed in the second quarter continued into the third quarter as well – many of our companies are reporting stability or slight improvement in business trends. Weighted average 2023 revenue growth expectations for the portfolio were up 3.8% during the third quarter or up 0.8% if we exclude NVIDIA. We wrote at length about NVIDIA earlier this year, but it is worth mentioning that the company has continued to exceed its own projections and the Street’s most optimistic expectations. After raising its revenue and EPS guidance for 2023 by 40% and 69%, respectively, following its last quarter, NVIDIA increased it further by 26% and 35%, respectively, after reporting the most recent one. Consensus expectations now call for revenues to grow 94% this year, while earnings per share are expected to increase by 192%. You may have seen these kinds of growth rates before, but we doubt you saw them from a company generating $50 billion in revenues. The skeptics who continue to question and doubt the accelerating demand for Generative artificial intelligence ( AI ) forgot to tell NVIDIA about it. But we digress…back to the portfolio…profit expectations have risen even faster than revenues and were up 11% during the third quarter (or up 7.8% ex-NVIDIA) with margin expectations up 149bps (107bps ex-NVIDIA). So, broadly speaking, our companies are seeing improvement in overall business trends, which flow through to their bottom lines, driving higher margins. We are also starting to see the benefits of leaner cost structures and more disciplined capital allocation compared to two or three years ago when capital was both cheaper and more readily available.
Could our companies’ fundamentals start to deteriorate again? Sure, if macro headwinds intensify. Would it significantly impair their long-term value? Unlikely, in our view. The majority of the businesses we own have no financial leverage and are capital light – meaning that higher interest rates would not directly have a negative impact on their businesses. They are leaders in their industries and should continue to benefit from customers consolidating in favor of their most important vendors. They are run by what we believe are great management teams and offer critical solutions to their customers, which makes them stickier and gives them pricing power.
But multiples took another leg down…
While fundamentals seem to have turned the corner, the Fund’s holdings experienced a multiple contraction of 9.5% during the thirdquarter [3] as we continue to operate in a challenging environment. The culprit behind the multiple contraction in the quarter was a combination of rising rate expectations or the higher-for-longer narrative, along with deteriorating investor sentiment, which led to a sell-off in longer-duration assets. The bears argue that higher for longer will undoubtedly lead to a recession as consumers have depleted their savings from the COVID period, and they are now facing a resumption of student loan payments and rising credit card bills. In the meantime, the affordability of large purchases from houses to cars has deteriorated (mortgage rates are approaching 8%, while car loan rates are even higher now). The bulls continue to argue that the tightening cycle is mostly over, and that the economy has proven to be resilient as is evidenced by strong GDP and employment growth numbers. Inflation has been mostly tamed, and the next major Fed move in interest rates (sooner or later) is surely down. The 10-year inflation break-even rate, which we like to look at, has been hovering around 2.0% to 2.5%. A recession is far from a foregone conclusion, and the Fed has likely threaded the needle and engineered a soft landing. While we do not belong to either camp, we would point out that if the bears are right and the economy slips into a recession, the Fed will likely lower rates sooner and will do so more aggressively, whereas if the bulls prove to be correct, inflation will likely remain stickier leading to higher-for-longer rates than investors are currently pricing in. This logic is of course circular with each argument leading into and supporting the other, enabling both sides to continue to stand their ground.
The correction was especially pronounced in small and mid-caps as index returns have been driven by mega caps.
As of the end of the third quarter, the Magnificent Seven continued to lead the Benchmark’s returns – Amazon, Alphabet, Meta, Apple, Tesla, NVIDIA, and Microsoft were up on average 87.8% year-to-date, contributing 62% of MSCI ACWI’s total return. Small-cap growth stocks continued to underperform with the Russell 2000 Growth Index up a meager 5.2% year-to-date compared to a 13.1% gain for the S&P 500 Index, and 25.0% increase for the Russell 1000 Growth Index. Similarly, within MSCI ACWI, while mega-caps were up 17.2% year-to-date and large caps were up 4.5%, mid-caps were up only 2.6% and small caps were down 5.3%. The underperformance of small caps was even more pronounced over the last three and five years where the Russell 2000 Growth Index was up 3.3% and 8.0% (cumulative), respectively compared to gains of 33.7% and 60.4% for the S&P 500 Index, and 25.9% and 79.5% for the Russell 1000 Growth Index, respectively.
Why have the mega caps outperformed?
During times of increased uncertainty and stress, investors’ time horizons shrink significantly. With their focus shifting to the here and now, current profitability and cash-flow generation take center stage. All of these companies have a few things in common: they are highly profitable, have low or no debt so they are not highly leveraged, have high returns on invested capital, and historically, they have always used recessions and economic turmoil to their advantage. As their competitors and the upstarts struggle and are forced to pull back because they’re fighting for survival, the leaders take market share, consolidate power, and often emerge even stronger than they were before. Small-cap stocks tend to do better when investors’ time horizons expand, along with their risk tolerance and appetites, which then show up in stock multiples. It is also worth noting that growth in passive investment vehicles has led to increased allocations to the largest market cap stocks (they are the biggest weights in indexes) as passive index funds and ETFs must continually buy without regard to fundamentals or valuations.
We own only two of the Magnificent Seven – Tesla and NVIDIA. As the underperformance of small caps became more pronounced over the last two years, we reduced our investments in large and mega-caps and increased our exposure to small, and mid-caps. This was not a top-down decision. We are bottom-up investors, and as the environment has changed and valuations of most of our small- and mid-cap holdings contracted disproportionately, we concluded that many of them began to offer more attractive long-term risk/rewards and have used the majority of our large- and mega-cap names as sources of capital. At the end of the quarter, the Fund was 19% overweight small- and mid-cap stocks. This shift has hurt our near-term results.
Is there anything we can do to reduce or mitigate the risk of further multiple contraction?
Sure. We could sell higher-multiple, higher-quality businesses, and buy lower-multiple, lower-quality ones. We could rotate out of Technology, Health Care, Consumer Discretionary, and Financials into Energy, Staples, Utilities, or Gold. We could sell and go to cash. The main reason we do not employ these tactics is that we do not rent stocks – we own businesses! A long-term ownership mindset is foundational to our investment philosophy and process, and we are willing to live with the volatility of valuation multiples and stock prices over full market cycles.
We don’t rotate sectors, go to cash or buy mediocre businesses because it is outside of our circle of competence, and because we believe that investing in high-quality businesses over the long term will enable us to outperform the indexes even though we may have to endure higher market volatility. The less attractive longer-duration stocks become to other market participants due to short-term issues and concerns, the more attractive they become to us as long-term investors – all else being equal, we would rather buy a business when it is selling at a larger discount to intrinsic value because everyone is focused on the here and now at the expense of thinking and analyzing the long-term prospects of the business.
It is important not to lose sight that mathematically, an investor’s return will be determined by the change in multiple over the holding period, multiplied by the compounding growth in business’ fundamentals over the holding period. The longer the holding period, the less important changes in multiples become (since these multiple changes are linear, while fundamentals compound exponentially). The multiple contraction that our stocks suffered over the last 21 months while fundamentals continued to compound, make current stock prices attractive for long-term investors, in our view.
So, what are we doing?
We continue to do what we always do. Focus on trying to understand disruptive change. Meet with companies, do fundamental research, and analyze businesses that can become Big Ideas over the time. In early September, we traveled to Japan and Korea and met with half a dozen companies. Though we were mostly searching for new ideas, the company that impressed us the most, that we decided to allocate fresh capital to, was one that we already owned, and in good size too.
Coupang is a leading Korean e-commerce company founded in 2010. It went public in March of 2021, and we have been investors in this Fund since the IPO. After spending half a day with management, touring the company’s fulfillment center, asking questions, and learning more about the reasons behind the remarkable success the company has achieved over the last 13 years, we decided we wanted to own it in this Fund as well. When we originally invested in Coupang, our thesis was constructed around the company’s wide product selection, low prices, and unrivaled convenience thanks to its investments in an end-to-end infrastructure that covers over 70% of Korea’s population, enabling over 99% of orders to be delivered within one day or less, rather than the industry norm of two to three days, driving customer satisfaction, which translates to higher customer retention rates and lifetime value. We thought that Coupang would continue to gain market share in the U.S. $500 billion-plus Korean retail market, while expanding its offerings into additional categories, expanding its ecosystem via a third-party marketplace, and continuing to invest in infrastructure density to further capture inefficiencies, enhancing the customer experience, and improving profit margins. The company has since outperformed our expectations, growing its market share to 25% (#1 in the industry), despite not being a first mover, while building an unrivaled user experience with 99.8% of products delivered the next day (with the majority of them by dawn) and becoming profitable significantly faster than we expected. Our biggest takeaway from the visit was that despite all of Coupang’s success, there is still a long runway of growth ahead. For example, while most of the facility we visited is operated with pickers going to shelves to pick up items for orders, there was one room in which shelves drove themselves to pickers on the back of autonomous robots, which increased picker productivity by 3x . Additionally, while Coupang has been striving to reduce its reliance on distributors, which enables them to expand margins while lowering prices for consumers, a significant opportunity remains for further reduction. Lastly, we got plenty of examples of out-of-the-box thinking (no pun intended) from the company’s singulation process (improves the picking process by reducing the constraint to search for items order by order), decreasing use of boxes (80% of shipments are now boxless ), enabling grocery delivery without cold-chain logistics (thanks to end-to-end supplychain efficiency), or how Coupang is able to fill trucks so that each carries more than 2x the parcels a UPS or a FedEx truck can, despite being half the size. The 4% free-cash-flow ( FCF ) yield, which is also negatively impacted by the significant reinvestments the company is making into its emerging offerings, also contributed to our decision to add to our Coupang position upon returning to New York.
Table II. Top contributors to performance for the quarter ended September 30, 2023
| Quarter End Market Cap (billions) |
| Percent Impact |
| Rivian Automotive, Inc. ( RIVN ) |
| $23.0 |
| 0.60% |
| argenx SE ( ARGX ) |
| 28.8 |
| 0.57 |
| Endava plc ( DAVA ) |
| 3.3 |
| 0.55 |
| Bajaj Finance Limited |
| 57.0 |
| 0.35 |
| MercadoLibre, Inc. ( MELI ) |
| 63.5 |
| 0.32 |
Shares of Rivian Automotive, Inc. , a U.S.-based electric vehicle manufacturer, continued their volatile trading, and after declining during the first half of 2023, rose 45.7% during the third quarter. Rivian’s unit economics are improving as a result of several factors: i) the company’s production rate is increasing, which enables it to better absorb fixed costs; ii) Rivian is ramping-up the usage of more price effective technologies, such as LFP batteries and its in-house developed motor, Enduro; and iii) the company is benefiting from renegotiated supplier agreements, as its scale and purchasing power have significantly increased over the last few years. Management expects continued progress in profitability ahead as Rivian further scales production. We remain shareholders and believe that the release of Rivian’s new smaller SUV dubbed R2, which is planned for early 2024, would enable the company to compete in the higher volume SUV segment, and significantly expand its addressable market. On the liquidity front, we expect the company to raise additional funds to support its longer-term business plans.
Argenx SE is a biotechnology company focused on autoimmune disorders. Shares increased 26.4% in the third quarter following positive chronic immune demyelinating polyneuropathy (CIDP) Phase 3 trial results. CIDP is an important commercial market representing billions of dollars in potential sales, and investors viewed this data set as a high profile catalyst. Overall, we believe that the strong Vyvgart launch, with early sales tripling consensus expectations and global approvals coming earlier than guided, will drive revenue growth over the next few years. Furthermore, we expect the next few years to have many catalysts, including readouts in pemphigus vulgaris, immune thrombocytic purpura, bullous pemphigoid, myositis, and argenx’s subcutaneous formulation launch. We believe that positive readouts would expand argenx’s opportunity set and therefore remain shareholders.
Endava plc provides outsourced software development for business customers. Shares rebounded 10.7% in the third quarter following a prolonged period of weak performance. Macroeconomic uncertainty has weighed on client demand and revenue growth in recent quarters, but management expects growth to improve early next year as several large new projects ramp up. Margins should expand alongside faster revenue growth as the company leverages upfront costs to build capacity in anticipation of an expected recovery. The company is also investing in AI-based tools that can accelerate project timelines and provide additional customer value. We remain shareholders because we believe Endava will continue gaining share in a large global market for IT services as digitization only becomes more important for customers to sustain their competitive positioning and take advantage of the advancements in AI.
Table III. Top detractors from performance for the quarter ended September 30, 2023
| Quarter End Market Cap (billions) |
| Percent Impact |
| Adyen N.V. ( ADYEY ) |
| $22.9 |
| –1.97% |
| Farmers Business Network, Inc. |
| – |
| –1.93 |
| Shopify Inc. ( SHOP ) |
| 70.1 |
| –0.90 |
| Schrodinger, Inc. ( |
| 2.0 |
| –0.77 |
| Think & Learn Private Limited |
| – |
| –0.71 |
Adyen N.V. provides technology that enables merchants to accept electronic payments. Shares declined 59.1% during the third quarter after the company reported disappointing financial results for the first half of the year. While payment volume growth of 23% was solid, it had slowed significantly from 41% in the prior period, which management attributed to more intense competition and pricing pressure in North America. Adyen is still gaining market share, but we believe the company lost wallet share with a few large merchants who shifted volumes to lower-priced competitors. We trimmed the position but continue to own the stock because we believe Adyen will be a prime beneficiary of the secular growth of e-commerce and will continue gaining share over time.
Farmers Business Network, Inc. is a private company seeking to create a two-sided marketplace to connect farmers and agricultural data and supplies. By leveraging its technology and community, it is seeking to disrupt large global agricultural markets dominated by oligopolistic counterparties that control distribution channels. Farmers Business Network is a young business that is still consuming cash as it is under scaled, and in investment mode. Furthermore, the company has faced various challenges recently namely due to internal execution issues amid increasing pressures on the business’s agricultural inputs segment following the supply-chain imbalances that intensified during COVID. During the quarter, the company closed a new funding round with terms that reduced the value of our holding, since we decided not to participate.
Shopify Inc. is a cloud-based software provider for multi-channel commerce. Shares gave back some of their strong performance from the first half of 2023, declining 15.5% on the back of rising concerns related to the health of the consumer and the expansion of TikTok and Temu into the U.S. While we are cognizant of these near-term risks, we believe that Shopify will continue to benefit from its position as the commerce operating system for its merchants. Rather than replacing Shopify, various selling channels, including TikTok, are managed within the platform, which should enable Shopify to maintain its competitive advantage over the long term. During the quarter, Shopify announced an agreement with Amazon that will allow merchants to offer Buy with Prime within the Shopify ecosystem, enabling Shopify to act as the payments provider for these transactions and alleviating a key concern. Lastly, the company also reported strong financial results, including 17% year-over-year gross merchandise volume growth, 31% revenue growth, and consensus-beating non-GAAP operating income that outpaced estimates by over $90 million. We remain shareholders due to Shopify’s strong competitive positioning, innovative culture, and long runway for growth, as it still holds less than a 2% share of the global commerce market.
Portfolio Structure
The portfolio is constructed on a bottom-up basis with the quality of ideas and conviction level having the most significant roles in determining the size of each individual investment. Sector and country weights are an outcome of the stock selection process and are not meant to indicate a positive or a negative view.
As of September 30, 2023, the top 10 positions represented 57.8% of the Fund and the top 20 represented 82.9%. As we articulated earlier in the year, we have now returned to a more concentrated portfolio as the market volatility enabled us to consolidate the portfolio on our highest conviction ideas (top 10 and top 20 positions were 45.9% and 73.0% in December 2022, and 42.5% and 61.9% in December 2021, respectively). We ended the quarter with 36 investments (down from 41 at the end of December 2022).
Our investments in the IT, Consumer Discretionary, Industrials, Financials, and Health Care sectors (as classified by GICS) represented 99.2% of the Fund’s net assets. Our investments in non-U.S. companies represented 53.6%, while emerging markets represented 18.6% of net assets. An additional 10.9% was invested in companies based in Argentina, which falls outside of MSCI’s developed/emerging/frontier markets framework.
Table IV. Top 10 holdings as of September 30, 2023
| Quarter End Market Cap (billions) |
| Quarter End Investment Value (millions) |
| Percent of Net Assets |
| NVIDIA Corporation |
| $1,074.4 |
| $63.8 |
| 9.3% |
| MercadoLibre, Inc. |
| 63.5 |
| 60.3 |
| 8.8 |
| Shopify Inc. |
| 70.1 |
| 39.6 |
| 5.8 |
| Endava plc |
| 3.3 |
| 37.7 |
| 5.5 |
| Snowflake Inc. |
| 50.4 |
| 36.6 |
| 5.4 |
| Bajaj Finance Limited |
| 57.0 |
| 35.1 |
| 5.1 |
| Tesla, Inc. |
| 794.2 |
| 32.4 |
| 4.7 |
| Coupang, Inc. |
| 30.3 |
| 32.1 |
| 4.7 |
| argenx SE |
| 28.8 |
| 31.8 |
| 4.7 |
| Cloudflare, Inc. |
| 21.1 |
| 25.0 |
| 3.7 |
Table V. Percentage of securities by country as of September 30, 2023 |
| Percent of Net Assets |
| United States |
| 45.7% |
| Argentina |
| 10.9 |
| India |
| 9.0 |
| Netherlands |
| 8.7 |
| Canada |
| 5.8 |
| United Kingdom |
| 5.5 |
| Korea |
| 4.7 |
| Israel |
| 3.3 |
| Poland |
| 2.1 |
| Brazil |
| 1.6 |
| China |
| 1.3 |
| Spain |
| 0.7 |
| Recent Activity |
During the third quarter, we sold two investments – the B2B sales software and data platform ZoomInfo and the health care software provider Veeva . We also reduced 18 existing positions to raise capital for investor redemptions as well as to add to 5 names in which we increased our conviction level, since we believe they offer an attractive long-term risk/ reward profile: Wix , Coupang , argenx , Cloudflare , and Fiverr .
Table VI. Top net purchases for the quarter ended September 30, 2023
| Quarter End Market Cap (billions) |
| Net Amount Purchased (millions) |
| $ 5.2 |
| $6.1 |
| Coupang, Inc. ( CPNG ) |
| 30.3 |
| 2.2 |
| argenx SE ( ARGX ) |
| 28.8 |
| 1.7 |
| Cloudflare, Inc. ( NET ) |
| 21.1 |
| 1.6 |
| Fiverr International Ltd. ( FVRR ) |
| 0.9 |
| 0.4 |
Our biggest add in the quarter was Wix.com Ltd. Wix provides a cloudbased software to help micro-businesses build and maintain websites. We have been investors in Wix since 2017, and despite decelerating sales growth due demand pulling forward during the early days of COVID, which has impacted the share price, we believe the company is making significant progress towards profitability and expanding its opportunity in the partners (professional website development) segment. After years of penalizing nearterm profitability with investments in sales and marketing, the company is now taking advantage of its leading brand name to acquire incremental users mostly organically, which enabled it to improve non-GAAP operating margins by 21% year-over-year to 18% for the most recently reported quarter. During its Investor Day, the company further guided to FCF margin targets of 19% in 2024 and 25% in 2025, which we believe could prove conservative as the mix of revenues shifts over time to the partners segment, which is structurally more profitable than the do-it-yourself segment. This is namely because Wix only needs to acquire a partner once, while the partner serves as an external sales force for Wix, creating a highly effective subscriber acquisition channel. Additionally, businesses that hire partners tend to have less churn, have higher business volumes, and adopt additional modules from Wix to drive higher revenue per subscription. While the advancements in AI remain a risk to be cognizant of, we believe Wix will benefit from AI. The company has been investing in AI for over five years now. AI lowers the hurdles for starting new businesses and designing websites (through Wix’s AI site generator) makes existing businesses more successful over time. We believe that Wix trades at an attractive valuation with an FCF yield of over 5%, despite profitability being penalized due to reinvestments back into the partners segment, which investors value below zero (masking the profitability of the do-it-yourself segment). As the partners segment becomes profitable over the next few years, we believe Wix’s overall FCF will move much higher.
Our second largest addition in the quarter was the Korean e-commerce leader, Coupang, Inc. As mentioned above, we returned from our visit to Korea with increased conviction in the prospects of Coupang to continue taking market share in the Korean e-commerce market, with still a significant runway to increase profitability.
We also added to our biotechnology investment, argenx SE , during the quarter, as the positive readout from the CIDP trial, increased our conviction in the platform opportunity for Efgartigimod across a large number of additional indications.
Our fourth addition during the quarter was to the leading cloud-based networking and software infrastructure, Cloudflare, Inc. Despite continued elongation of sales cycles due to the macro slowdown, the company reported signs of stabilization and noted that the second quarter set a new record for pipeline generation, while deal close rates are improving and sales representative productivity is also moving in the right direction after the go-to-market changes the company implemented in the first quarter. Cloudflare also disclosed that it is benefiting from customers consolidating their spending on its platform [4] :
“One of the things that is unique about us versus a number of others is, as we look at our products, that we’ve been able to achieve very high gross margins. I think that’s the best – one of the best indicators that we have a really differentiated platform. And as customers are looking for ways to consolidate their vendors, to find how to get more ROI out of everything they’re doing, they’re turning to us. And our team is ready, and we have the right products.”
Our last addition during the quarter was to the leading freelance platform, Fiverr International Ltd. The company’s revenue growth rates remain negatively impacted by macro factors as it’s relatively easy for customers to hire fewer freelancers when they must cut budgets in the near term. However, we are encouraged by the company’s rapid progress on the profitability front (with guidance for EBITDA margins to be approximately 16% for 2023 compared to 7% in 2022), early signs of revenue growth acceleration, and its significant long-term opportunity as freelance work continues growing. These factors present a positively skewed risk/reward opportunity for long-term investors, especially with the shares trading at a 9% FCF yield. We have therefore decided to add to our position.
Table VII. Top net sales for the quarter ended September 30, 2023
| Quarter End Market Cap or Market Cap When Sold (billions) |
| Net Amount Sold (millions) |
| CrowdStrike Holdings, Inc. ( CRWD ) |
| $40.0 |
| $21.7 |
| ZoomInfo Technologies Inc. ( ZI ) |
| 7.5 |
| 14.8 |
| Veeva Systems Inc. ( VEEV ) |
| 32.7 |
| 12.3 |
| Datadog, Inc. ( DDOG ) |
| 29.6 |
| 8.0 |
| Adyen N.V. ( ADYEY ) |
| 22.9 |
| 6.4 |
Outlook
It seems that the topic du jour of financial commentators moved from “how high can rates go?” to “how long would rates need to stay at these higher levels?”, or the higher-for-longer discussion. The bond market has clearly moved in that direction with the 10-Year U.S. Treasury bond yield increasing nearly 100bps from 3.81% as of the end of the second quarter to 4.80% at the end of the third. This caused the Vanguard Long-Term Bond ETF to crater 14% from the beginning of the quarter through the middle of October. In the meantime, the 10-year break-even inflation rates remain in the 2.0% to 2.5% range, where they have been for the last three years and real rates (as measured by the 10-Year TIPS) have risen all the way up to 2.3%. We get why long-duration assets sell off on a higher for longer scenario, but we are uncertain how sustainable/persistent it will turn out to be. We think the consensus view on higher has already moved to not much higher , and we think the answer to how much longer is not much longer . In other words, it will be measured in months or quarters and not years, which for our purposes – is not much longer at all.
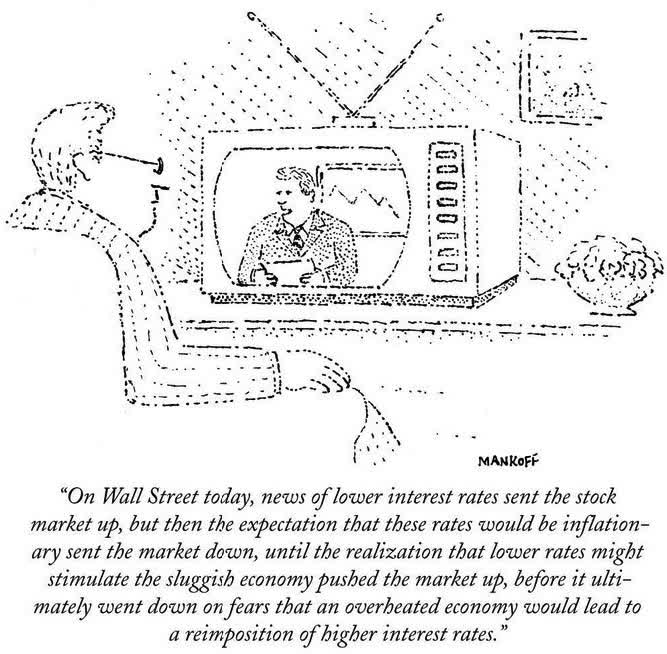
It also never ceases to amuse us how the market can react to similar data one way on a good day, and in an entirely different way on a bad one. After the August job openings (JOLTS) report was published on Tuesday, October 3, showing that the economy had 9.6 million job openings, which was more than expected, the market sold off, with the S&P 500 Index losing 1.4%, and the Russell 2000 Growth Index down 1.8%. This move was consistent with the higher-for-longer narrative, and the 10-Year Treasury yield did in fact spike 12bps that day in response to the news. Then on Friday, October 6, we got the nonfarm payroll report, showing again a much higher-than-expected number of 336,000 as compared to consensus expectations of 170,000. A consistent data point to what we saw just three days earlier, in our opinion. But the S&P 500 Index went straight up that day closing with a 1.2% gain, while the Russell 2000 Growth Index finishing the day up 1.1%, with what looked to us like similar and consistent data causing the exact opposite effect on market movement and the prices of our stocks.
This reminded us of the famous Mankoff cartoon from 1981:
www.CartoonStock.com
Every day we live and invest in an uncertain world. Well-known conditions and widely anticipated events, such as Federal Reserve rate changes, ongoing trade disputes, government shutdowns, and the unpredictable behavior of important politicians the world over, are shrugged off by the financial markets one day and seem to drive them up or down the next. We often find it difficult to know why market participants do what they do over the short term. The constant challenges we face are real and serious with clearly uncertain outcomes. History would suggest that most will prove passing or manageable. The business of capital allocation (or investing) is the business of taking risk, managing the uncertainty, and taking advantage of the long-term opportunities that those risks and uncertainties create.
We are optimistic about the long-term prospects of the companies in which we are invested and continue to search for new ideas and investment opportunities while remaining patient and investing only when we believe the target companies are trading at attractive prices relative to their intrinsic values.
Sincerely,
Alex Umansky, Portfolio Manager
| Investors should consider the investment objectives, risks, and charges and expenses of the investment carefully before investing. The prospectus and summary prospectus contain this and other information about the Funds. You may obtain them from the Funds’ distributor, Baron Capital, Inc., by calling 1-800-99-BARON or visiting Baron Funds - Asset Management for Growth Equity Investments . Please read them carefully before investing. RisksGrowth stocks can react differently to issuer, political, market and economic developments than the market as a whole. Non-U.S. investments may involve additional risks to those inherent in U.S. investments, including exchange-rate fluctuations, political or economic instability, the imposition of exchange controls, expropriation, limited disclosure and illiquid markets, resulting in greater share price volatility. Securities of small and medium-sized companies may be thinly traded and more difficult to sell. The Fund may not achieve its objectives. Portfolio holdings are subject to change. Current and future portfolio holdings are subject to risk. The discussions of the companies herein are not intended as advice to any person regarding the advisability of investing in any particular security. The views expressed in this report reflect those of the respective portfolio managers only through the end of the period stated in this report. The portfolio manager’s views are not intended as recommendations or investment advice to any person reading this report and are subject to change at any time based on market and other conditions and Baron has no obligation to update them. This report does not constitute an offer to sell or a solicitation of any offer to buy securities of Baron Global Advantage Fund by anyone in any jurisdiction where it would be unlawful under the laws of that jurisdiction to make such offer or solicitation. Free cash flow represents the cash that a company generates after accounting for cash outflows to support operations and maintain its capital assets. BAMCO, Inc. is an investment adviser registered with the U.S. Securities and Exchange Commission (SEC). Baron Capital, Inc. is a broker-dealer registered with the SEC and member of the Financial Industry Regulatory Authority, Inc. (FINRA). |
Editor's Note: The summary bullets for this article were chosen by Seeking Alpha editors.
For further details see:
Baron Global Advantage Fund Q3 2023 Shareholder Letter