NYMT - Big Dividends Vs. Reality
2023-09-20 16:00:00 ET
Summary
- The article discusses the performance and price-to-book ratios of several high yield REITs.
- Charts are provided to contrast current valuations, dividend yields, and the impact of changes in valuation during the last decade.
- Some of the most popular shares today are also trading at painfully unattractive ratios. On the other hand, there are plenty of alternatives at cheaper valuations.
Get ready for charts, images, and tables because they are better than words. Your continued feedback is greatly appreciated, so please leave a comment with suggestions.
Yesterday's article on AGNC stirred up quite a bit of emotion among investors who own AGNC. Despite laying out a few accounting facts, which seemed pretty clear to me, many shareholders refused to even consider that other mortgage REITs exist. That's a remarkable oversight. Maybe I should've referenced other mortgage REITs? I referenced 5 mortgage REITs, but didn't include charts for them. Since this series runs heavier on charts, perhaps it will help.
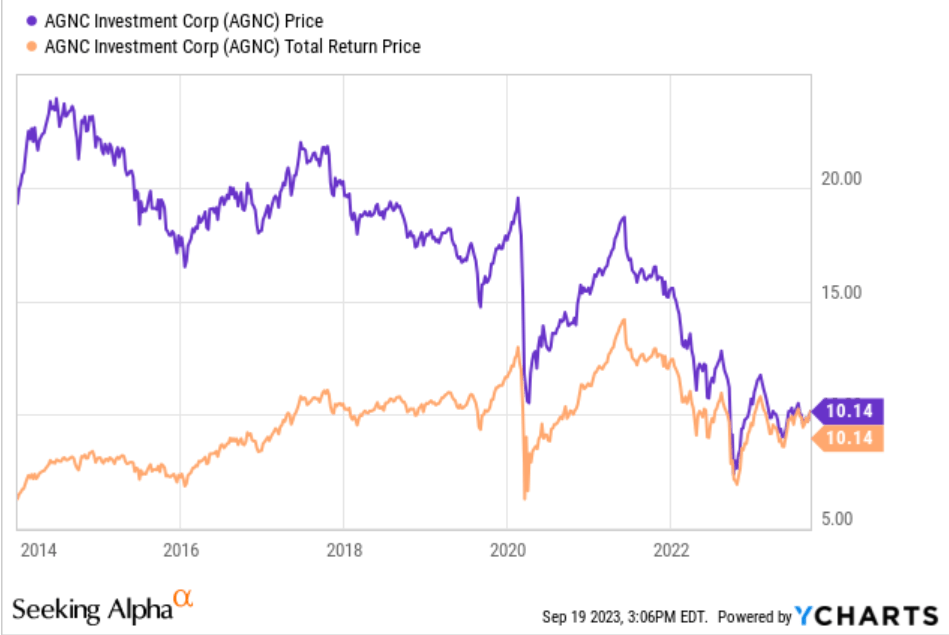
First, I want to satisfy a request from a reader who asked for a chart showing performance including dividends. Going back to the first day of 2014, here is the contrast between AGNC's share price and the total return price (which reduces prior prices to reflect dividends):
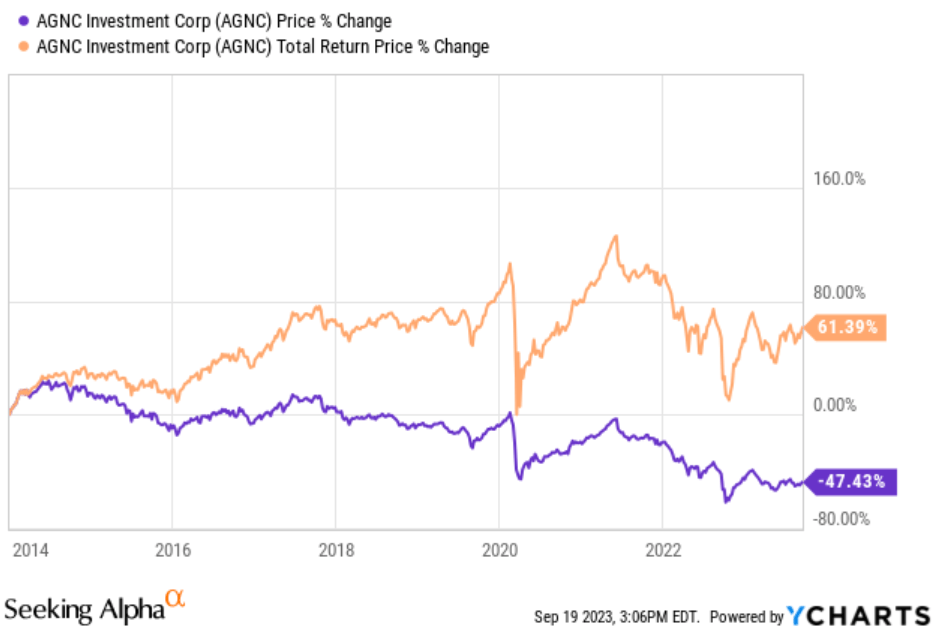
Second, here is a chart turning that performance into the percentage change over the period:
Third, here is a chart comparing AGNC's performance on "change in share price + dividends" (assumes reinvesting dividends) relative to the other 5 REITs I mentioned that trade at lower price-to-book ratios:
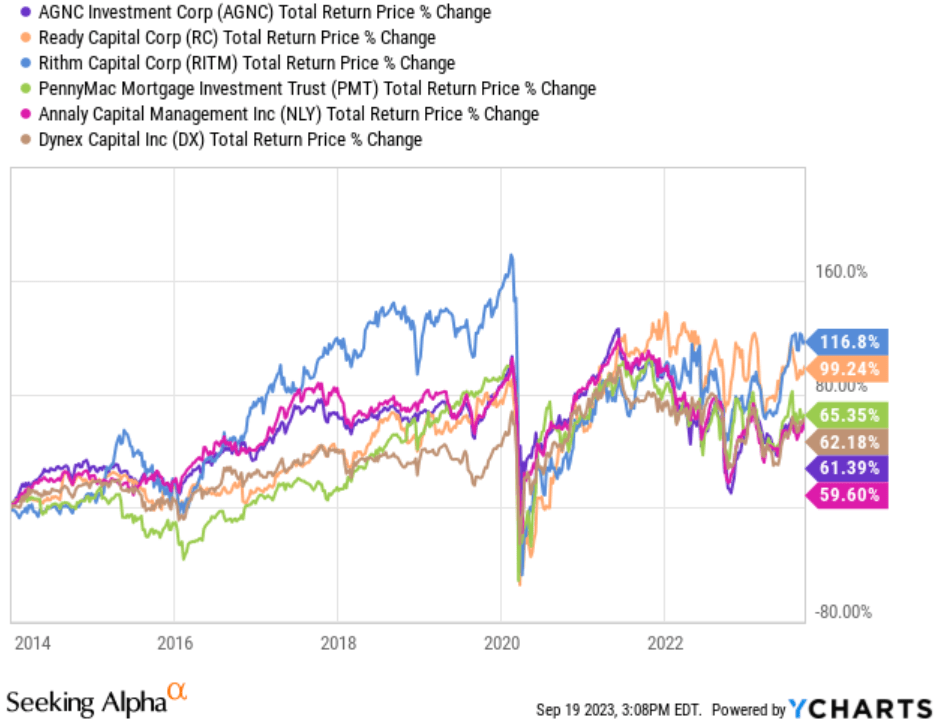
You can quite reasonably argue that 4 of the REITs have an extremely similar total return over this arbitrary period.
However, it would be good to consider two additional factors:
- AGNC currently has the highest price-to-tangible-book among the REITs in that chart. Note: This is based on our estimates of current BV, which were last updated Friday evening.
- At the start of that chart, AGNC's price-to-tangible-book value ratio was .806.
If we assume AGNC's book value did not change during Q3 2023 (which is quite unlikely; it's probably down based on the change in the MBS prices and hedge values), then AGNC's price-to-tangible book ratio would be about 1.08.
If a mortgage REIT saw its share price jump from 80.6% of book value to 108% of book value without any change to the book value, it would represent a return of 34%.
That math is actually pretty easy: 1.08 / .806 = 1.34.
A Little Mistake
Ready Capital ( RC ) has different assets. They run the portfolio differently. That's not really a problem since I was only using them as an example of a REIT with a much greater discount to book value.
However, there is a bit of an issue with using it in the chart shown above (comparing returns since the start of 2014).
In 2016, Sutherland Asset Management merged with a small (and, in my opinion, not the greatest) mortgage REIT known as ZAIS Financial Corp.
In late 2018, Sutherland announced they would change their name and ticker. They became Ready Capital.
So what's the issue? The official history follows ZAIS prior to the merger, but after the merger, it was Ready Capital (under the name of Sutherland) in the driver's seat.
How does that happen? It was a relatively quick way for Sutherland to become public. They just had to structure the transaction accordingly.
Consequently, we can ignore RC from the chart since I started it on January 1st, 2014.
Comparing Price-to-Book Ratios
I told you that AGNC moved from an attractive price-to-book ratio of .806 up to 1.08 (using trailing tangible book value, it is a higher ratio using our current estimates). But how does that compare to what happened for the other mortgage REITs (excluding RC)?
I put together the following chart for comparison:
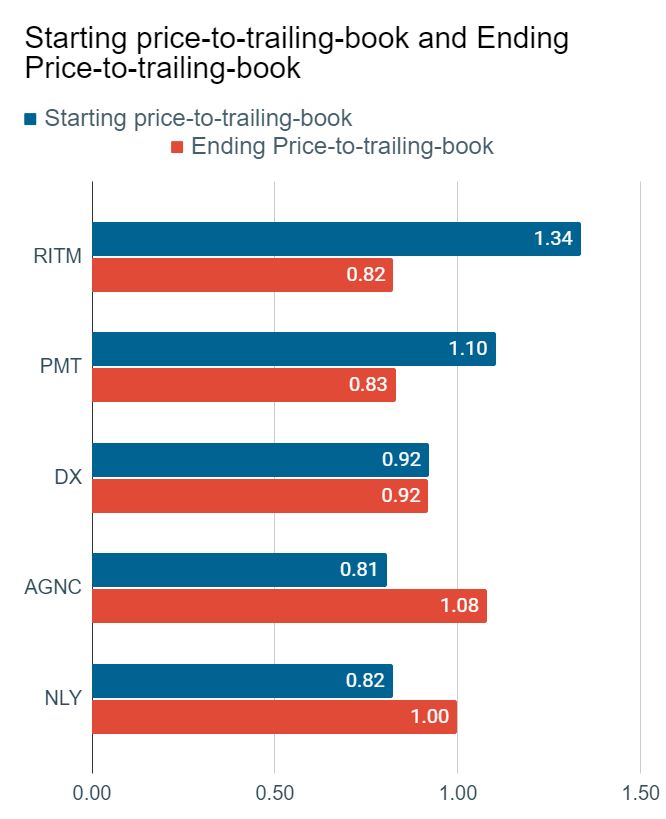
Of course, this is just the starting date and the ending date. There have been some wild swings between those dates. However, you can see that AGNC had the most favorable change, followed by NLY.
To demonstrate the impact of those swings in price-to-book ratios (holding book value steady), I put together another chart:
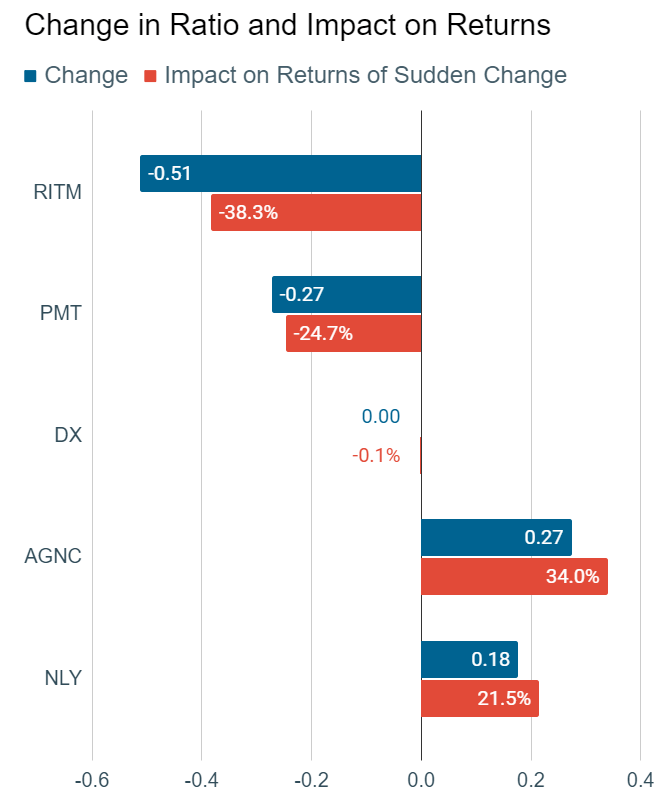
Is that clear enough? AGNC started at a low ratio and ended at a high ratio. Consequently, their total returns during this arbitrary period look better. NLY also had a pretty significant benefit.
Book Value Drives Long-Term Performance
There are two terms you should know:
- Total Shareholder Returns: (Change in share price + dividend) / starting share price. This is what you're hoping to achieve.
- Total Economic Returns: (Change in book value + dividend) / starting book value. This is management's responsibility.
The difference between the two is a function of a change in the price-to-book ratio.
Since you want to achieve total shareholder returns, you have two goals:
- Achieve an increase in the price-to-book ratio.
- Do it before book value gets hit.
Note: Some people get mad that management's job is not to manage the stock price. Over the long term, if a big discount to book value persists, then management bears responsibility for improving the price-to-book ratio. Normally, that would need to be done by liquidating or selling the REIT. In the short to medium term, the share price is not management's responsibility.
Why It Matters
You may hear investors arguing that AGNC is a great investment because interest rates are going to go down. They think that when rates go down, it means AGNC is going to up. Is that how it works? No. But let's look at the logic.
If AGNC's price goes up, according to basic math that even a child can understand, one of two things happened:
- Book value went up.
- The price-to-book value ratio went up.
There is no third option. At least one of those events happened every single day that the share price went up.
Every single day that the price goes down, either the price-to-book ratio goes down, or the book value goes down.
That's how ratios work. Unfortunately, many people get confused by this concept. I appreciate everyone who understands it.
Which One Goes Up?
Is it the book value that's going to increase?
Let's see what AGNC says:
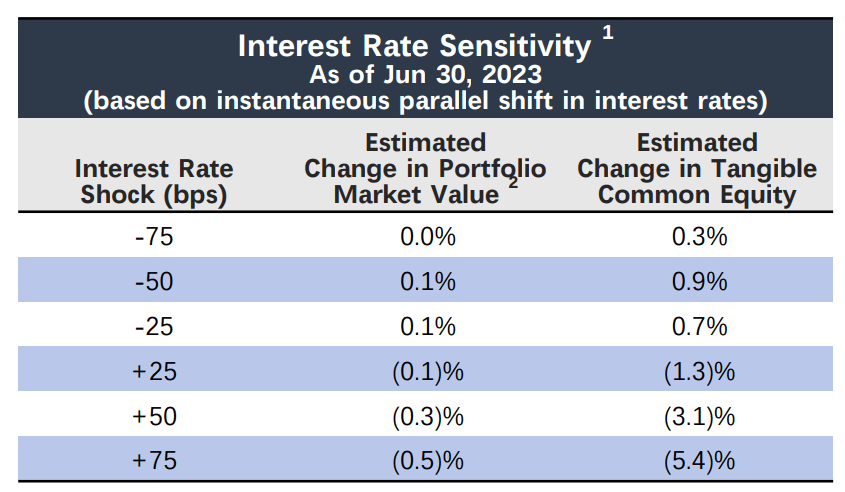
If interest rates fell by 50 basis points, tangible book value would increase by 0.9%. Wow, that's nearly a full percentage point. Should I retract my argument? That big 1% increase in book value can offset a bit more than a 1% decrease in the price-to-book ratio. Or if the ratio stays the same, the share price will be up a whopping 1.0%. Sorry, 0.9%. We don't want to exaggerate. It's just so exciting thinking about the potential for a 1% gain. I would include a sarcasm alert, but if people can't catch it then they really shouldn't be managing their own money. Perhaps they would be interested in some Vanguard target date funds?
What happens if rates fall even further? Then negative convexity (yeah, it's concavity but spreadsheets prefer using a negative number to changing a term) rules the day. The gain drops to only 0.3%.
Sorry, I don't think everyone understands the magnitude of this change. If AGNC's book value was $10.00, instead of being less than $10.00, then gaining 0.9% would represent $.09 and 0.3% would represent $.03. That's the potential gain as outlined by AGNC's management. Think AGNC's management doesn't know how their own assets and hedges function? That would be a really terrible thesis for buying a stock, much less for paying a big premium to book value.
To be clear, AGNC's management does know how their assets and hedges work. Further, rates increased significantly during Q3 2023. Therefore, a decrease in book value per share is quite likely.
Therefore, investors who are super excited about AGNC's big gain if rates decline could be:
- Misinformed about the change in book value.
- Way too excited about 1%.
- Expecting the price-to-book ratio to go even higher.
Using a historical view, we've seen far more time with lower price-to-trailing-book ratios than higher ratios:
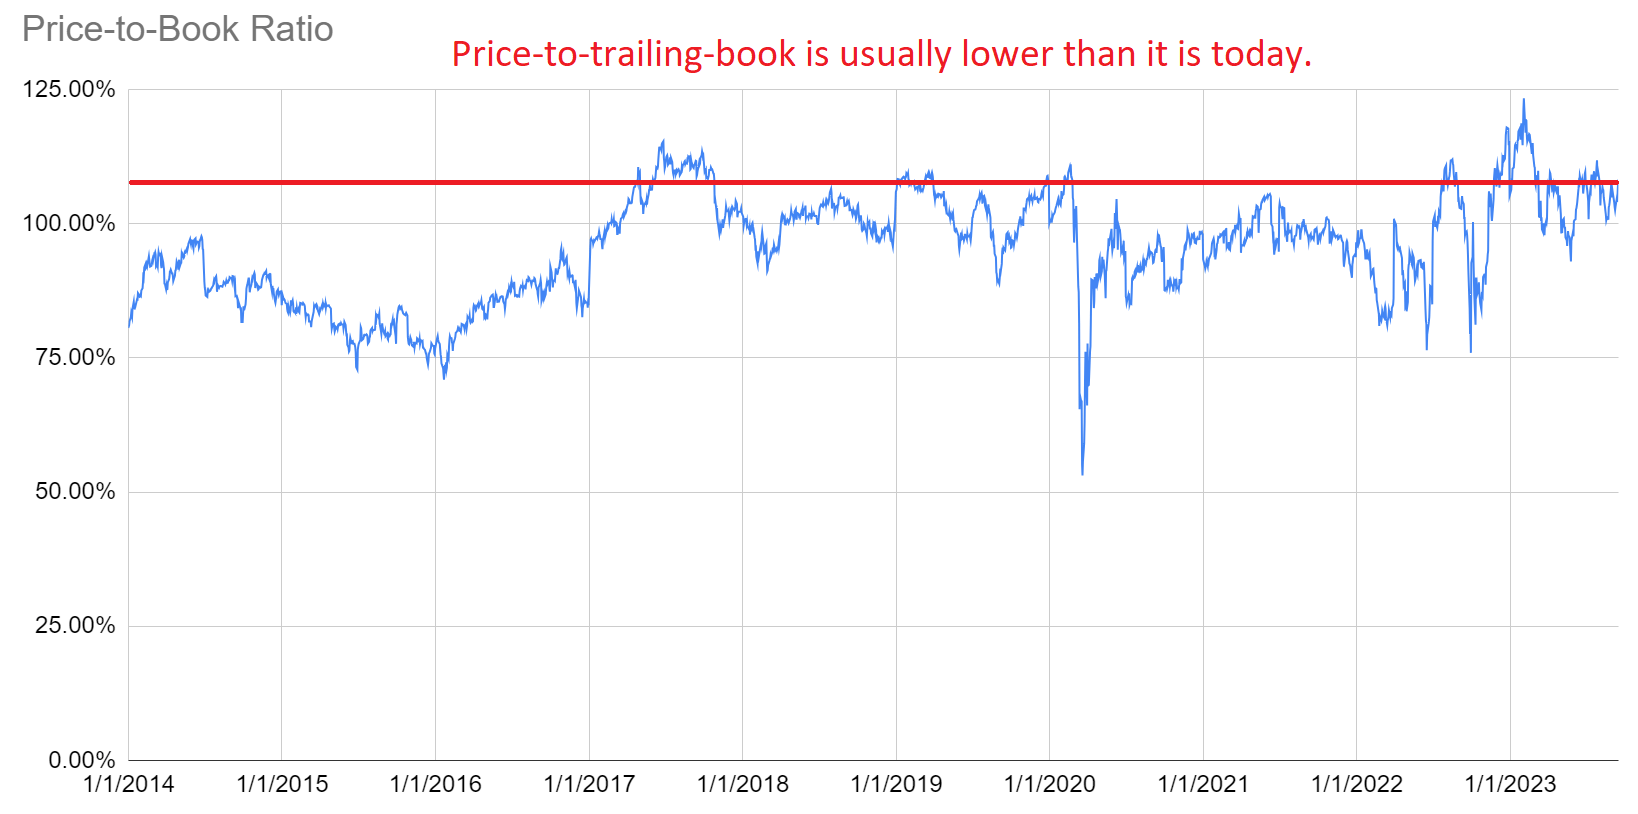
Could book value increase? Sure. It's unlikely for Q3 2023 absent a major swing in markets, but there are three other ways to increase book value:
- Issuing shares above book value will increase book value per share.
- A tightening of the spreads between MBS and hedging rates.
- Gambling on the direction of rates by using a very uneven hedge portfolio.
Option 1 can take quite a while for a big impact.
Option 2 is a good thesis for owning one of the less expensive mortgage REITs. It's part of the best thesis for liking this sector. But AGNC isn't the way to play it.
Option 3 is hoping managing will gamble for you. If you're trying to gamble on rates going down, you can do that with far less risk by buying some very long-duration Treasuries. In that scenario, you would actually control which assets were in the portfolio and wouldn't have to worry about the price-to-book ratio.
A bit further down in the article, you'll see comparisons of price-to-trailing-book value ratios throughout the sector. I include far more stocks there. The charts also separate them by category.
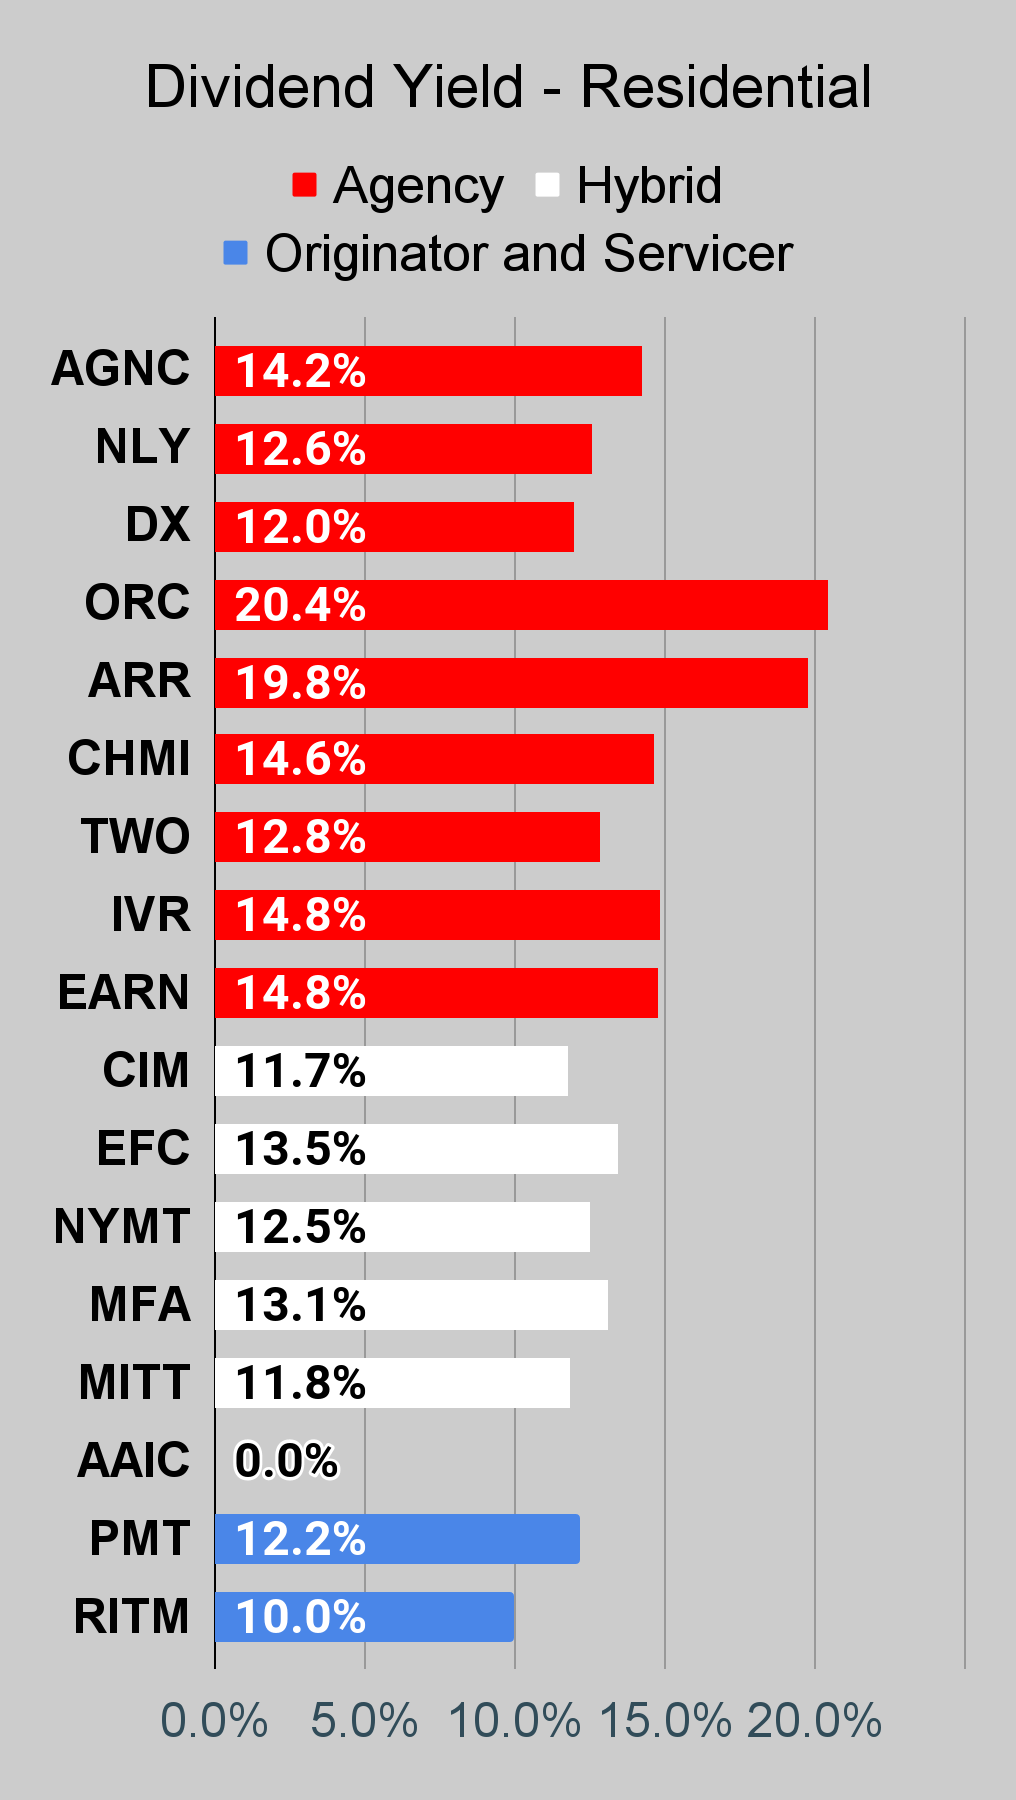
Dividends
You might figure most investors would be in the sector for dividends. But investors in AGNC actually refused that idea.
If you're focused on dividends, you should be aware that net interest income on hedges is driving up AGNC's earnings. I covered this idea in more depth during yesterday's article.
That strategy doesn't last forever. If rates fall, hedging income and repo costs both decline. However, the yield on assets would also decline as prepayments would increase and new assets would be more expensive.
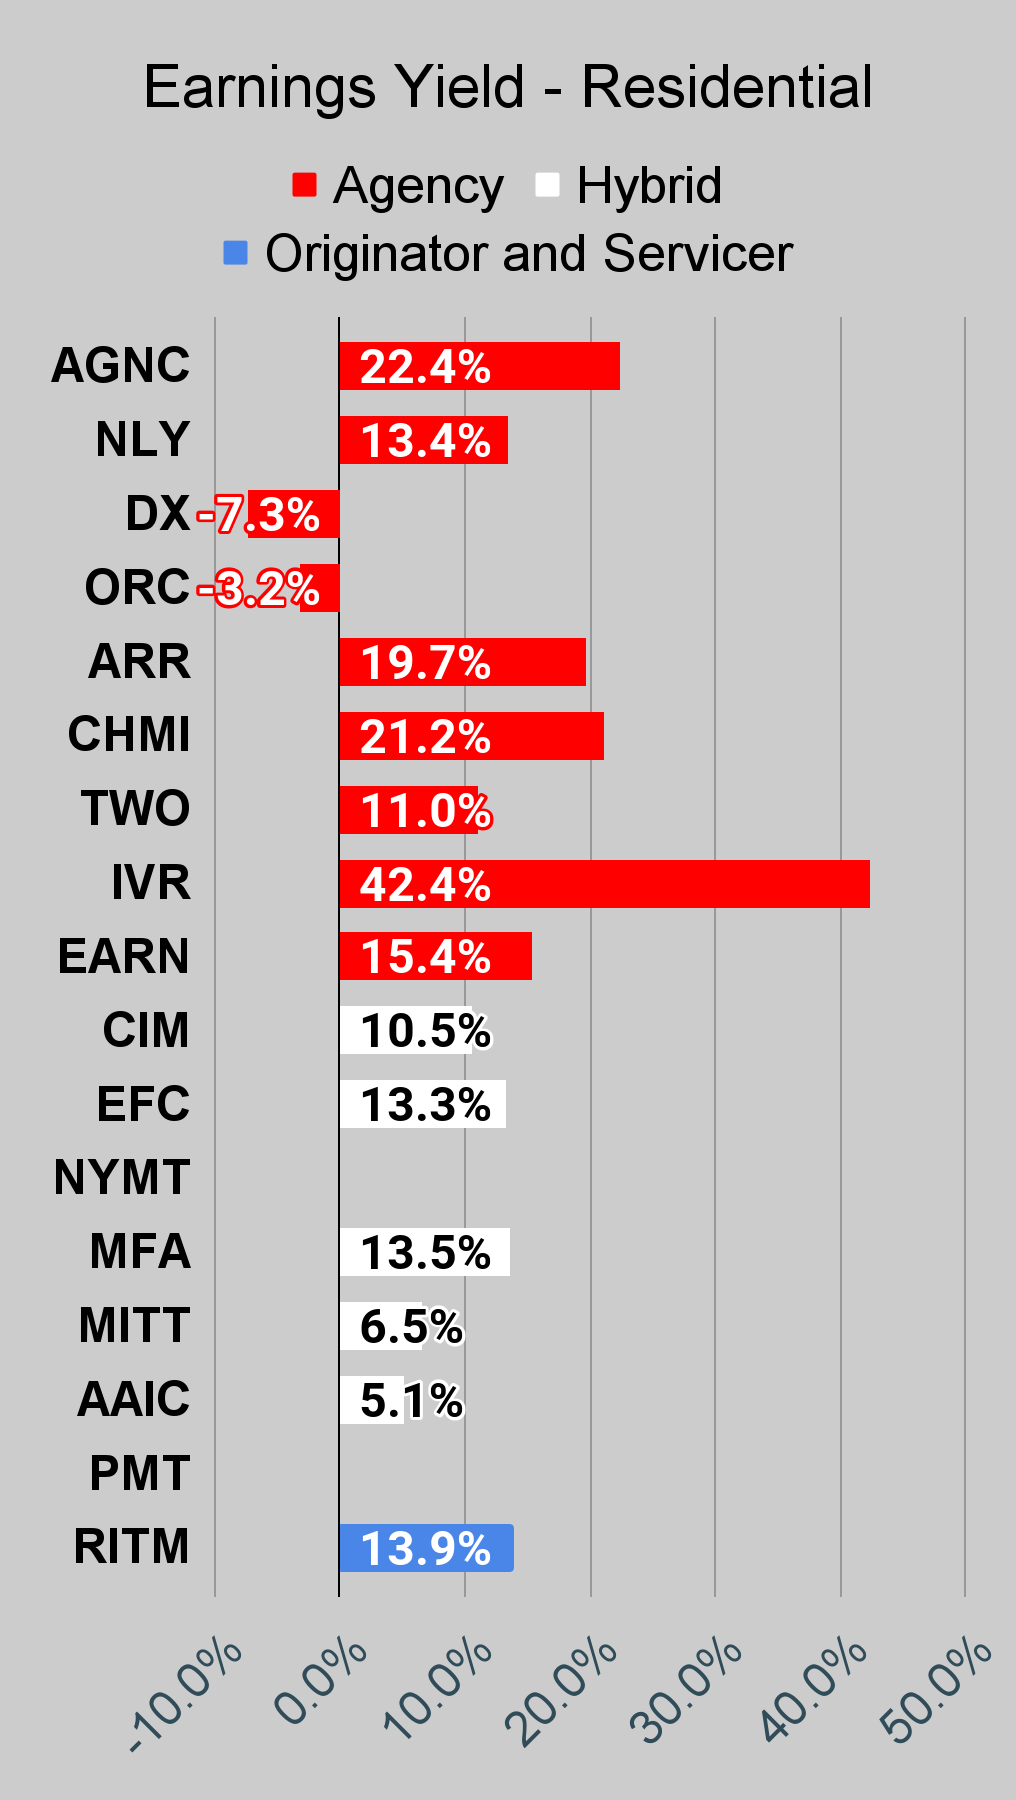
If you believe that the management teams are probably roughly equal, then you would quite reasonably believe that dividends are heavily influenced by book value. That's a premise you should accept regardless of your views on management. While AGNC's earnings are pumped up today, it would be foolish to think earnings will remain this elevated. This is part of why AGNC's dividend yield is so much smaller than the earnings yield. Management knows the earnings today are not going to be sustained indefinitely.
That doesn't force them to change the dividend rate today. They are absolutely not forced to do that. But it should caution investors about expecting the yield to last indefinitely. The dividend yield as a function of book value is very high. Eventually, it should be normalized.
Investors would be better off looking at shares where the dividend as a function of book value is materially lower. Remember, investors in AGNC are claiming a high dividend yield, but they are paying a high price-to-book ratio. If that price-to-book ratio normalizes, the unrealized loss would offset a big chunk of dividends.
Income investors need dividends. They don't need to pay for their dividends with losses. There are alternatives in the sector and several preferred shares in the sector that offer far more attractive risk/reward profiles.
Does It Work?
Many investors questioned whether this emphasis on book value actually works. Ratings from Scott Kennedy and myself on the mortgage REITs have been identical for years, so you get a more complete history by looking at ratings from each of us.
Here's the rating history provided by Seeking Alpha as of earlier this year (requires premium):
Seeking Alpha
You can make your own decision about how well those ratings worked. You're not required to like my work or my snarky nature. I respect that. But I'm including the record for the investors who want to see it.
Stock Table
We will close out the rest of the article with the tables and charts we provide for readers to help them track the sector for both common shares and preferred shares.
We're including a quick table for the common shares that will be shown in our tables:
| Type of REIT or BDC |
| Residential Agency |
| Residential Hybrid |
| Residential Originator and Servicer |
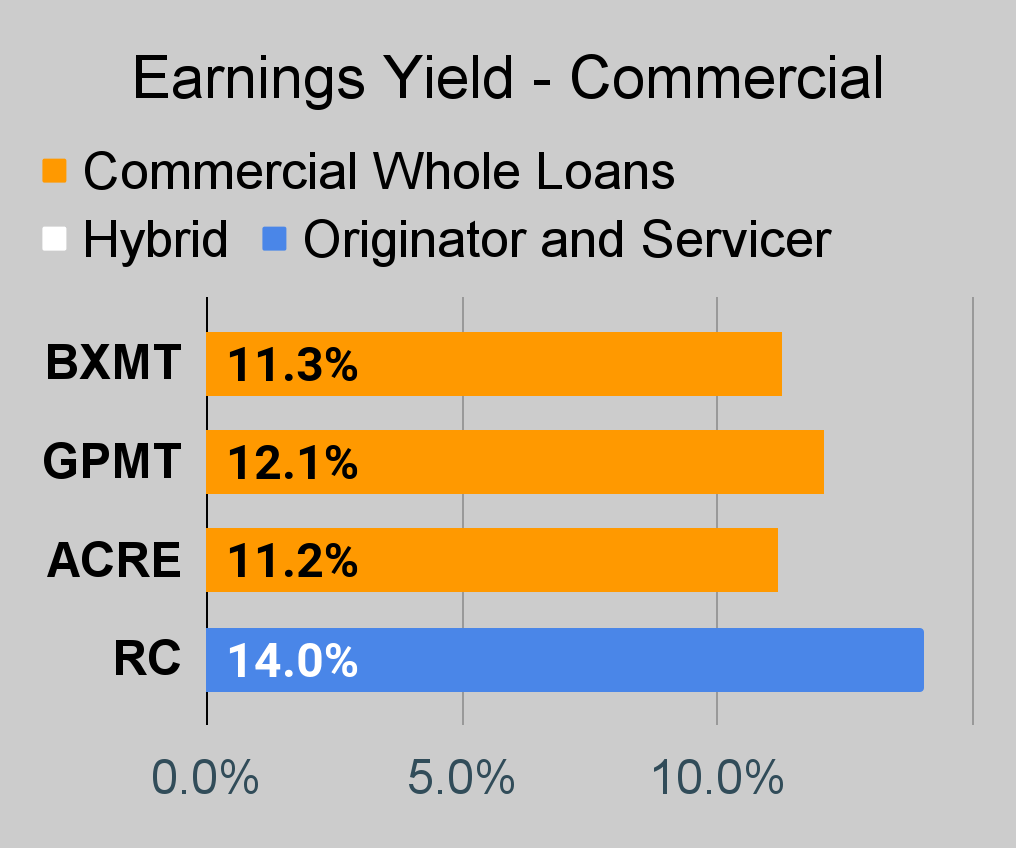
| Commercial |
| BDC |
If you're looking for a stock and I haven't mentioned it yet, you'll still find it in the charts below. The charts contain comparisons based on price-to-book value, dividend yields, and earnings yield. You won't find these tables anywhere else.
For mortgage REITs, please look at the charts for AGNC, NLY, DX, ORC, ARR, CHMI, TWO, IVR, EARN, CIM, EFC, NYMT, MFA, MITT, AAIC, PMT, RITM, BXMT, GPMT, WMC, and RC.
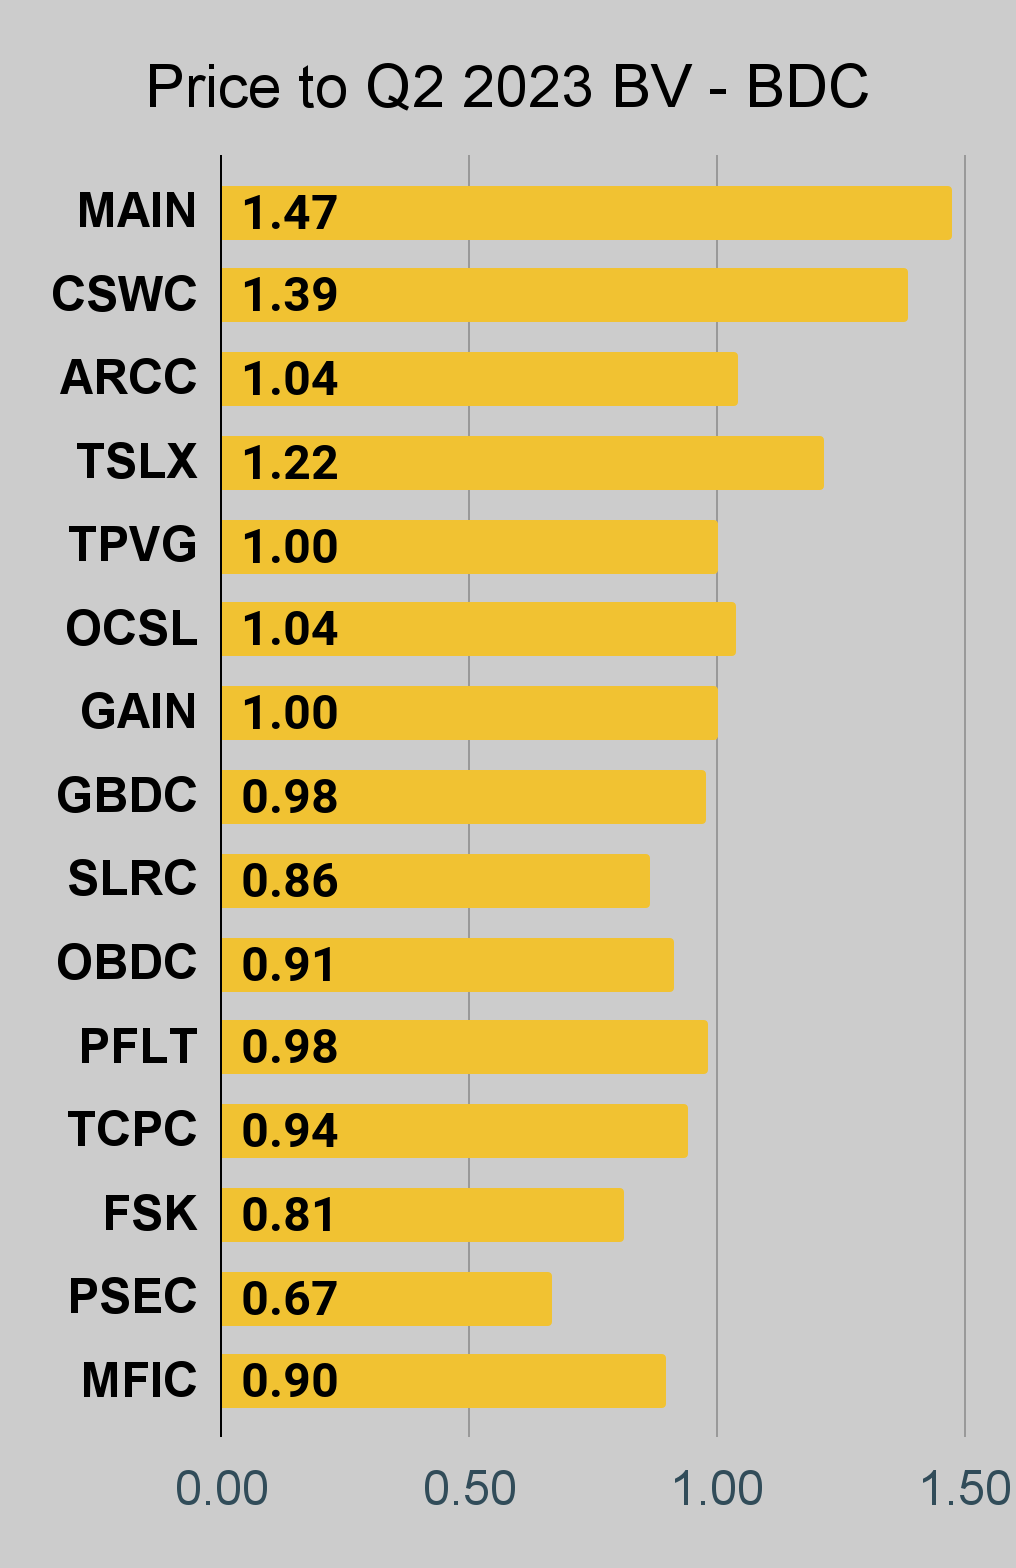
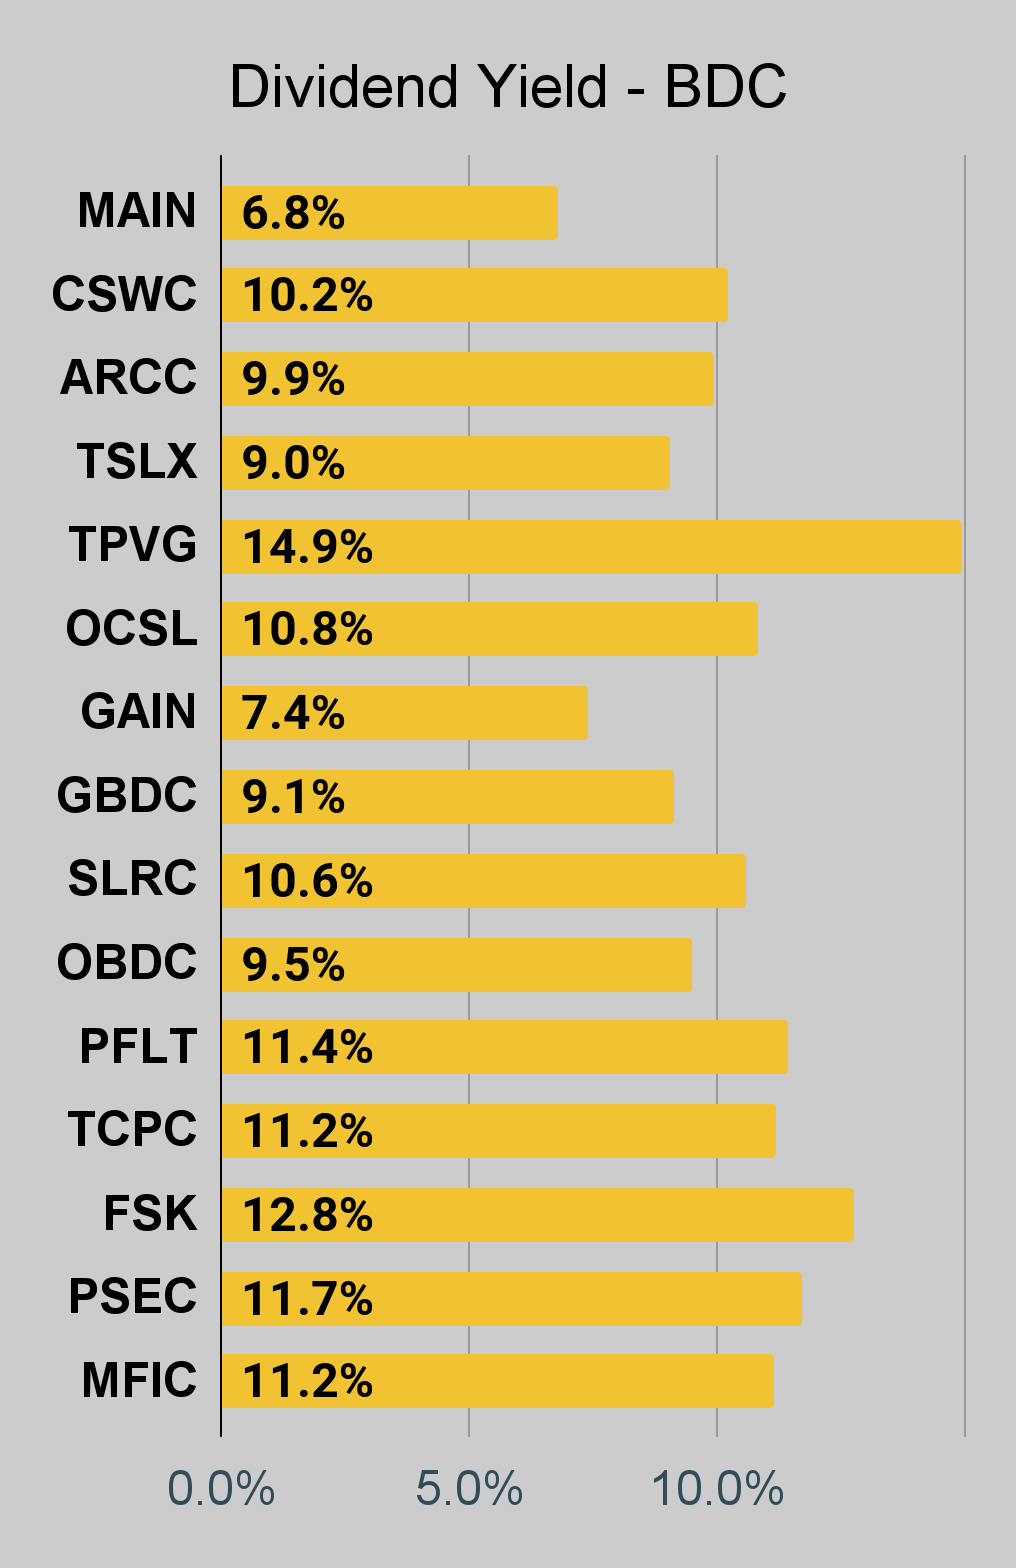
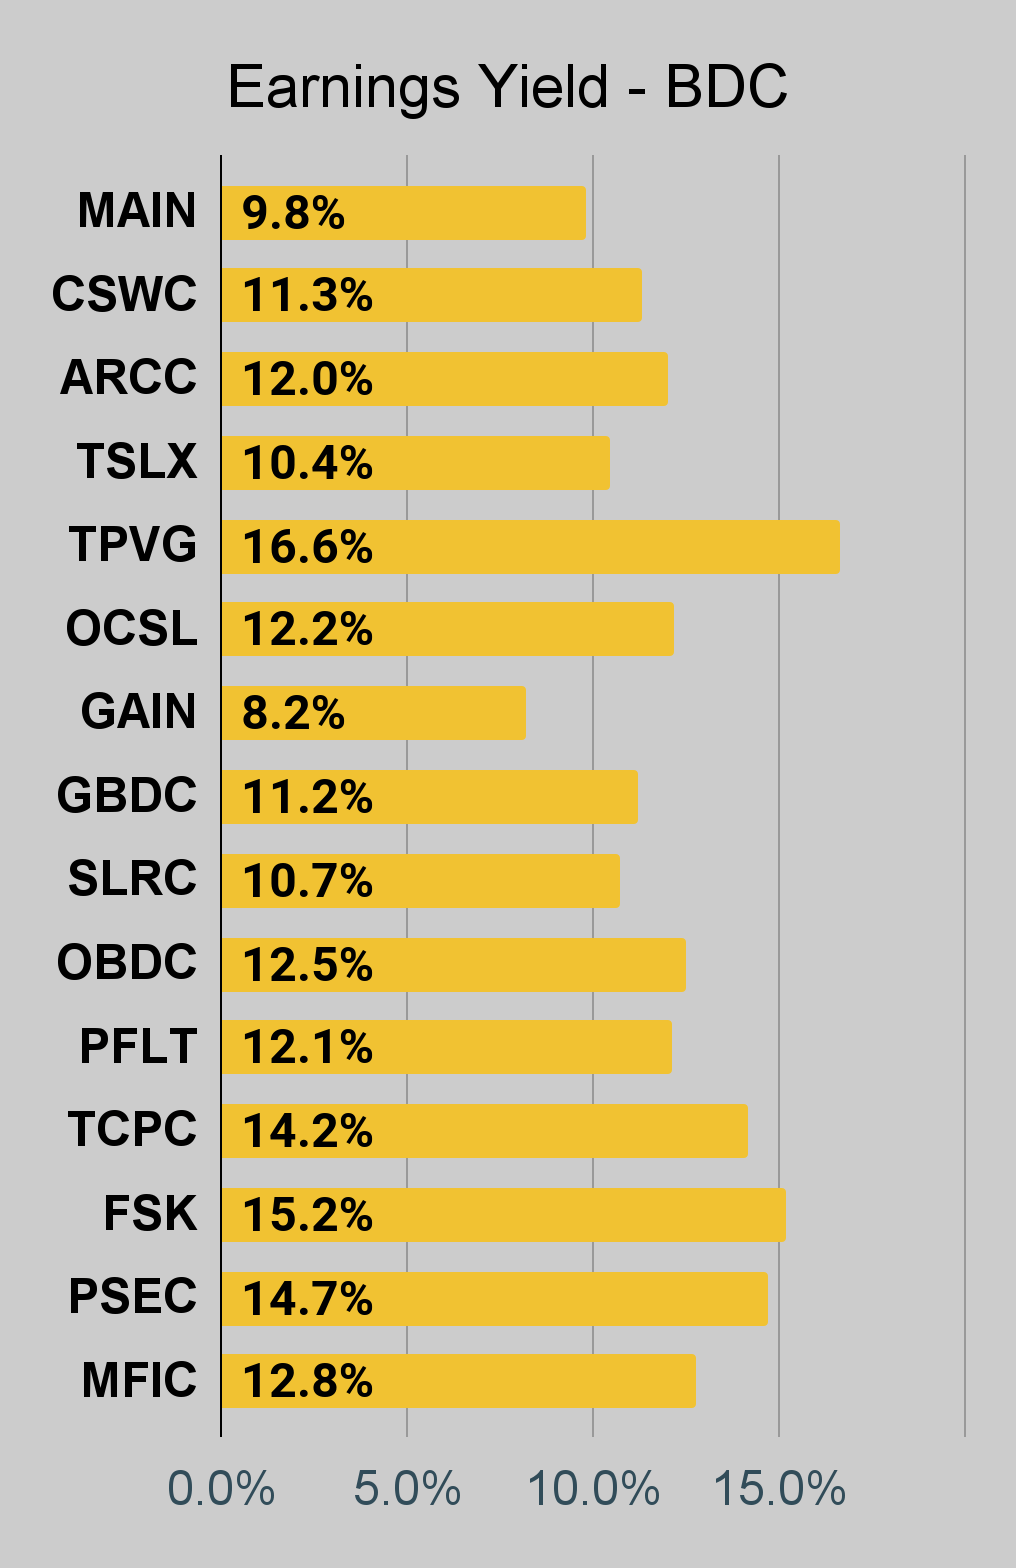
For BDCs, please look at the charts for MAIN, CSWC, ARCC, TSLX, TPVG, OCSL, GAIN, GBDC, SLRC, ORCC, PFLT, TCPC, FSK, PSEC, and MFIC.
This series is the easiest place to find charts providing up-to-date comparisons across the sector.
Residential Mortgage REIT Charts
Note: The chart for our public articles uses the book value per share from the latest earnings release. Current estimated book value per share is used in reaching our targets and trading decisions. It is available in our service, but those estimates are not included in the charts below. PMT and NYMT are not showing an earnings yield metric as neither REIT provides a quarterly "Core EPS" metric. Presently, a few other REITs also have no consensus estimate.
Second Note: Due to the way historical amortized cost and hedging is factored into the earnings metrics, it is possible for two mortgage REITs with similar portfolios to post materially different metrics for earnings. I would be very cautious about putting much emphasis on the consensus analyst estimate (which is used to determine the earnings yield). In particular, throughout late 2022 the earnings metric became less comparable for many REITs.
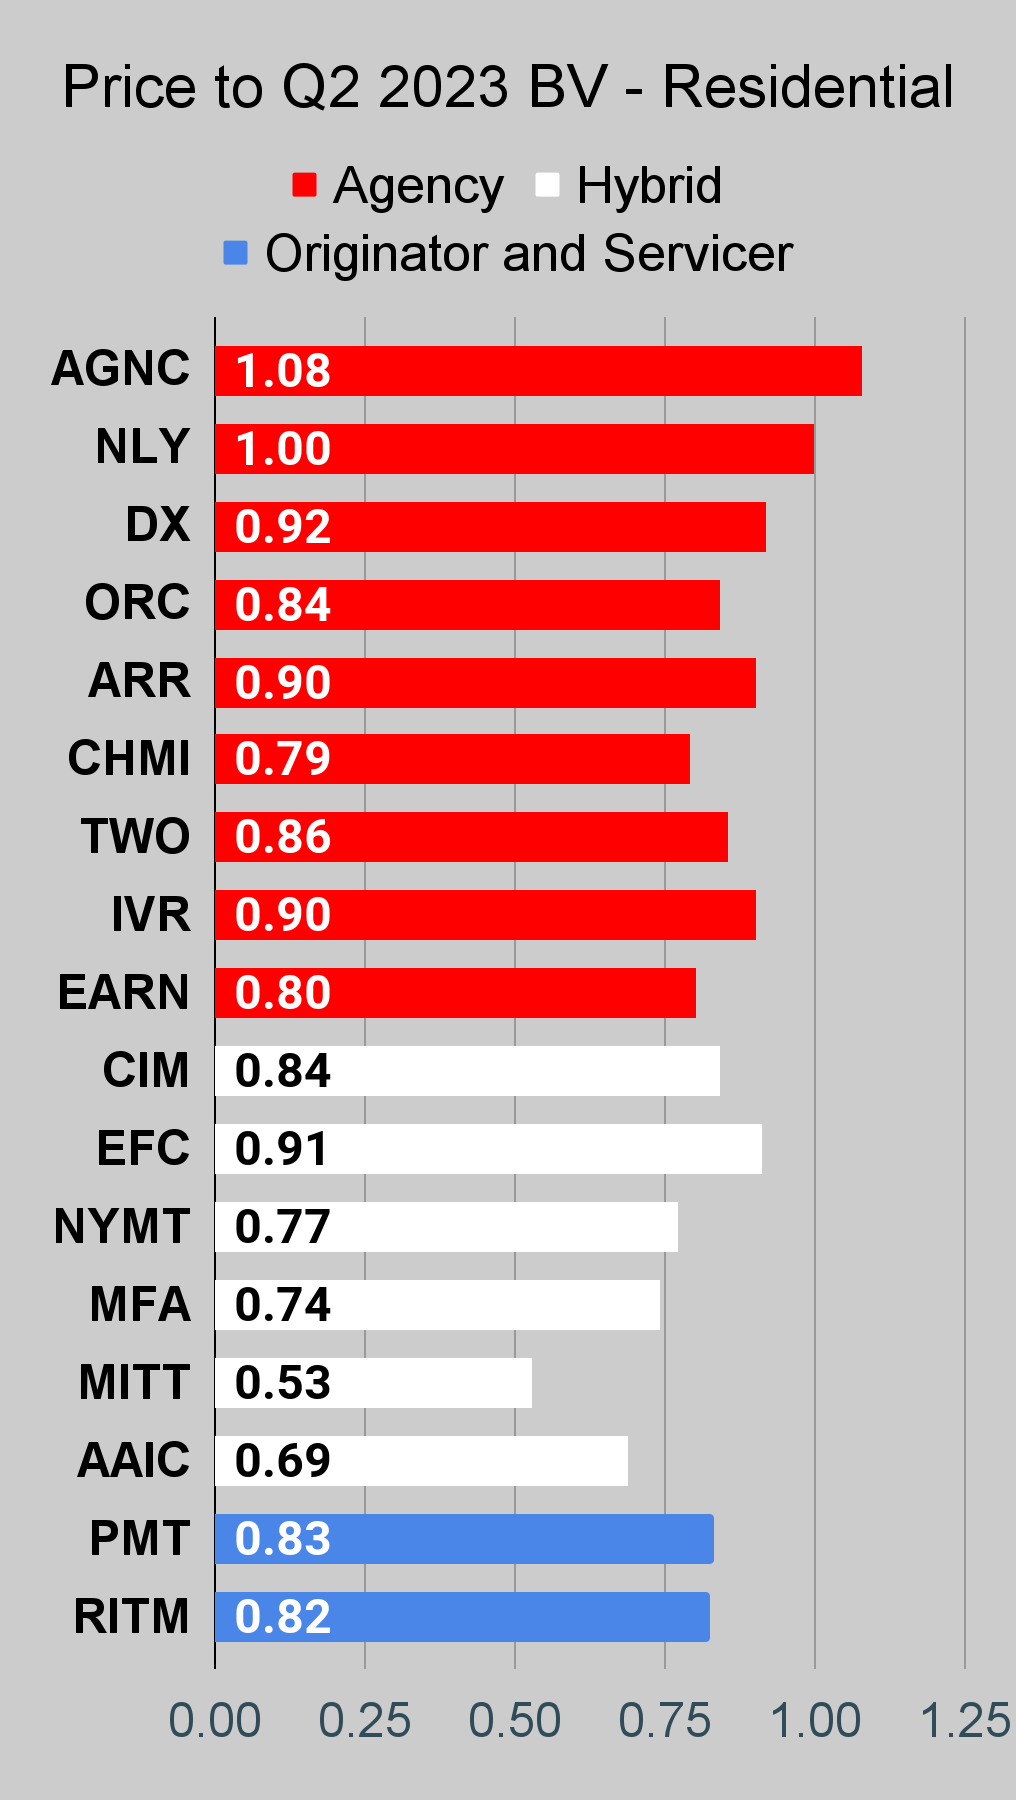
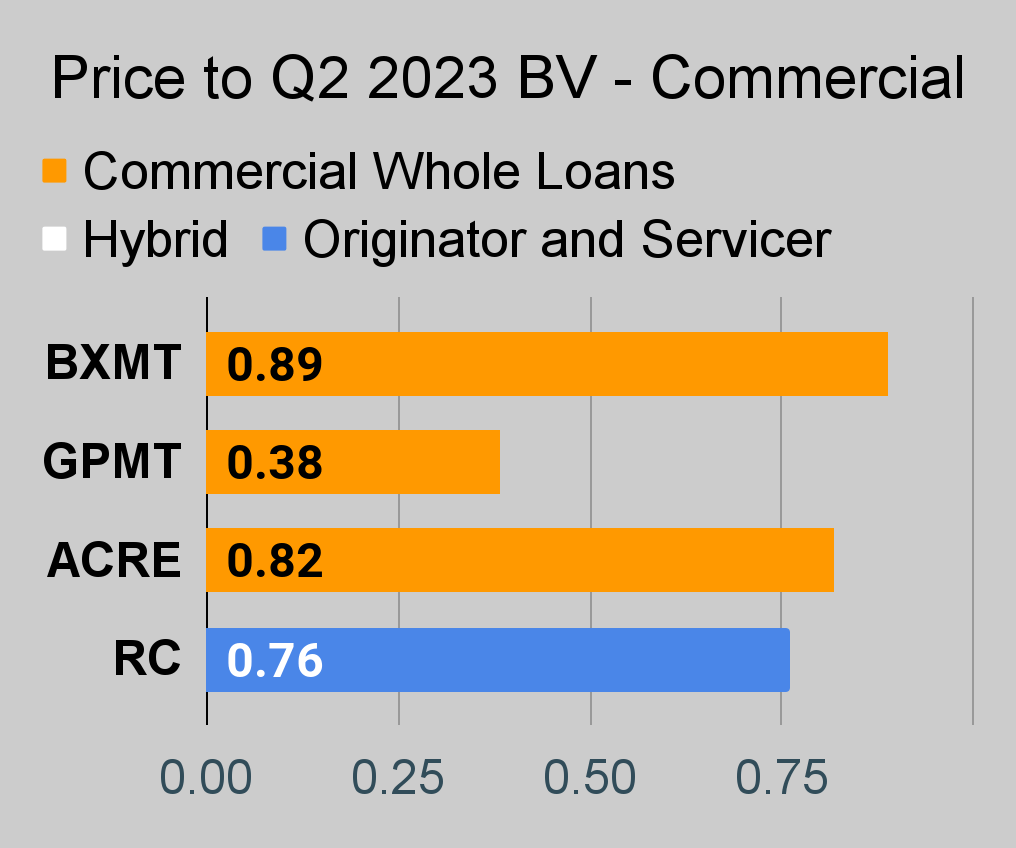
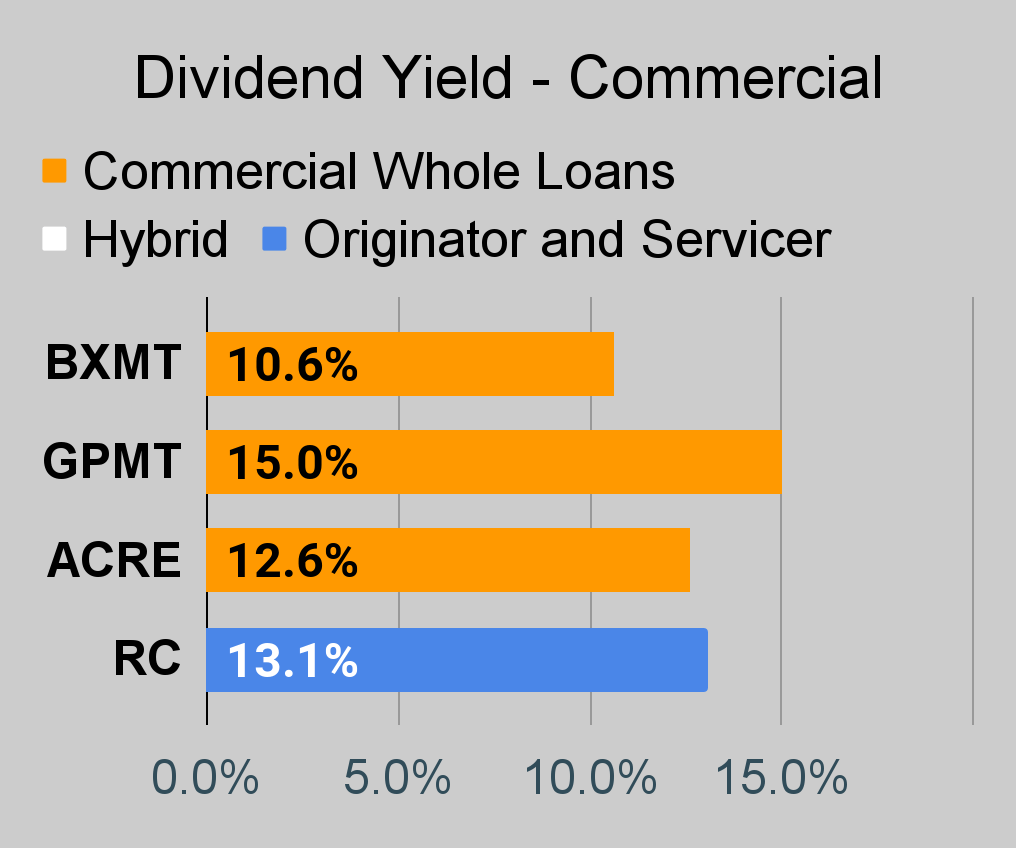
Commercial Mortgage REIT Charts
BDC Charts
Conclusion
There are several options for a lower price-to-book. Every single mortgage REIT in this article trades at a lower ratio. Does that mean every single one will beat AGNC? No. It could happen, but I'd be pretty foolish to wager a single pick underperforming all others.
However, the deck is stacked to make it harder for AGNC. Investors are paying a premium price to enter that position. I see several better alternatives.
Investors who want to focus on income may want to take a look at the preferred shares. I'll be bringing those charts back soon. I removed them temporarily as we go through some updates for the public series.
Thanks for reading.
For further details see:
Big Dividends Vs. Reality