BXC - BlueLinx: The Market Has Yet To Price In Its Improving Margins And Coming Fed Rate Cut (Rating Upgrade)
2023-12-21 23:15:36 ET
Summary
- Although there was no revenue growth over the past 19 years, BXC is a fundamentally sound company with improving margins and returns.
- It is financially sound with a strong cash position and cash conversion ratio. It also had a good capital allocation track record and is a cash cow.
- A valuation of the company suggests a 30% margin of safety if certain assumptions, such as a 5% improvement in contribution margin and a 5% reduction in WACC, are met.
Investment Thesis
BlueLinx Holdings Inc. ( BXC ) is a cyclical company. BXC did not achieve any revenue growth over the 2005 to 2023 peak-to-peak Housing Starts cycle. Nevertheless, the company is fundamentally sound with improving margins and returns. I consider it a cash cow.
The Housing Starts currently is at the long-term annual average level. As such BXC’s Sep 2023 LTM performance represents its performance over the cycle. Based on this and assuming that the company can continue to deliver 5% improved operations and a 5% lower WACC, there is a 30 % margin of safety.
Business background
BXC is a leading wholesale distributor of residential and commercial building products in the United States. They distribute products in two principal categories: specialty products and structural products.
- Specialty products included engineered wood, specialty lumber, and panels. In 2022, these accounted for 65 % of its net sales.
- Structural products included lumber, plywood, oriented strand board, and other wood products primarily used for structural support in construction projects. In 2022, these accounted for 35% of its net sales.
BXC sells the products through three main distribution channels - warehouse sales, reload sales, and direct sales.
In its 2021 and 2022 Form 10k, the company described its strategy as:
- Fostering a performance-driven culture committed to profitable growth.
- Migrating sales mix toward higher-margin specialty product categories.
- Maintaining a disciplined capital structure and pursuing high-return investments.
Thrust of my analysis
I first looked at how well the company had delivered the above strategic goals. Specifically, I assessed its track record in achieving profitable growth, margin improvements, and returns.
BXC is a cyclical company with strong links to the construction and housing sector. The company acknowledged this in its 2022 Form 10k:
“…Our industry is highly cyclical…Demand for building products is…the construction, repair, and remodeling markets, industrial markets, housing supply…”
The latest Housing Starts peak-to-peak cycle is from 2005 to 2022/23. Over this period there is a 0.72 correlation between BXC’s revenue and the Housing Starts.
Given this correlation, I looked at the performance of BXC over this period. We are also near the end of the financial year. Rather than comment on the Q3 2023 performance, I used the Sep 2023 LTM values to represent the 2023 performance.
I then valued BXC based on the results of the performance analysis.
Operating trends
Apart from the changes in the Housing Starts, the performance of BXC, especially over the past few years, was driven by high wood product prices.
Chart 1 illustrates this. I have tried to “synchronize” the wood price index with BXC’s revenue index and the Housing Starts index over the past 19 years.
I would break the 19 years into 4 periods:
- From 2005 to 2009, there was a decline in Housing Starts and wood prices. Not surprisingly, BXC revenue declined.
- From 2009 to 2020, there was an uptrend in the Housing Starts. Together with the uptrend in wood prices, there was revenue growth for BXC.
- In 2021 and 2022, wood prices spiked. Despite a decline in Housing Starts in 2022, BXC revenue grew.
- In 2023, wood prices seemed to have come down to the historical long-term trend level. Despite an uptrend in Housing Starts, BXC revenue declined.
Chart 1: Wood prices, BXC revenue, and Housing Starts. (FRED, Author)
Note to Chart 1: To derive BXC revenue and the Housing Starts indices, I compared the values in the various year with the respective 2005 values.
The key takeaways from the above are:
- The 2021 and 2022 performances cannot be representatives of the long-term “normal” performance of BXC.
- BXC's revenue did not grow over the past 19 years. Its 2023 revenue is even lower than that in 2005. This is despite the 2023 wood prices being higher than that in 2005.
- The lower 2023 revenue is because the Housing Starts in 2023 is lower than that in 2005. Without extraordinary prices, Housing Starts have a greater impact on BXC revenue.
Given that the was no revenue growth, when valuing BXC over the cycle, it makes more sense to base it on its Earnings Power Value ((EPV)). This is looking at the Free Cash Flow assuming zero growth.
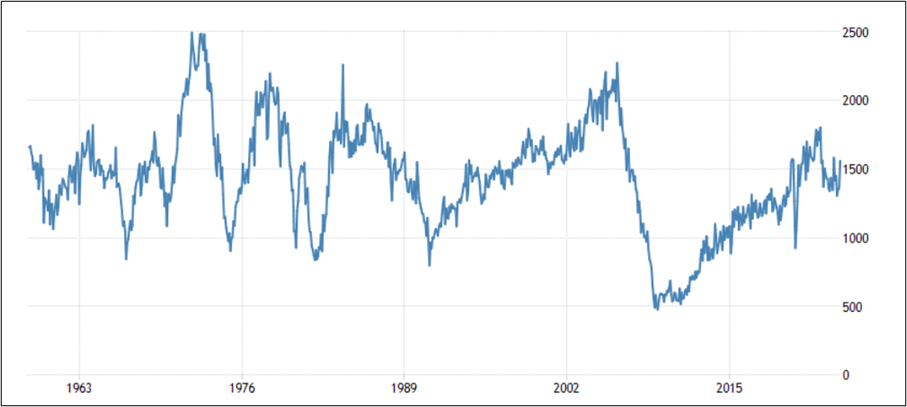
It also makes sense to peg BXC performance to the Housing Starts. The challenge with Housing Starts is that over the past 70 years, there was no growth in the long-term annual average Housing Starts of about 1.5 million units. Refer to Chart 2.
You can see that we are currently at the long-term average level.
Chart 2: US Housing Starts; Trading Economics (Trading Economics)
Returns
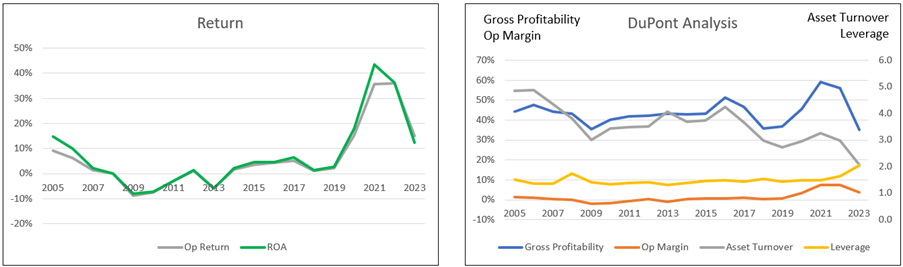
I considered 2 return metrics - ROA and Operating Return. The left portion of Chart 3 illustrates the return trends for BXC while the right portion shows the DuPont Analysis.
The ROA and Operating Return closely track each other.
- During the trough part of the Housing Starts cycle, the company experienced both negative ROA and negative Operating Return.
- Not surprising there were spikes in both returns in 2021/2022.
- Ignoring the 2021/22 returns, you can see improving returns over the past 19 years. For example, the Operating Return in 2023 is 15% compared to 9 % in 2005.
An analysis of why the 2023 Operating Return is better showed that it was due to better margins and higher leverage.
There was no improvement in asset turnover. This asset turnover performance is consistent with the lower gross profitability in 2023 compared to that in 2005.
I think that the improving returns meant that BXC had achieved profitable growth, even though there was no revenue growth from 2005. You could of course argue that there would be growth if the base year was post-2010 instead of 2005.
Chart 3: Return and DuPont Analysis (Author)
Note to the Return chart. Operating Return = EBIT(1-t) / TCE where TCE = Equity + Debt – Cash. There were tax credits in certain years. In such cases, I used a 25% tax rate rather than the actual tax rate for the year.
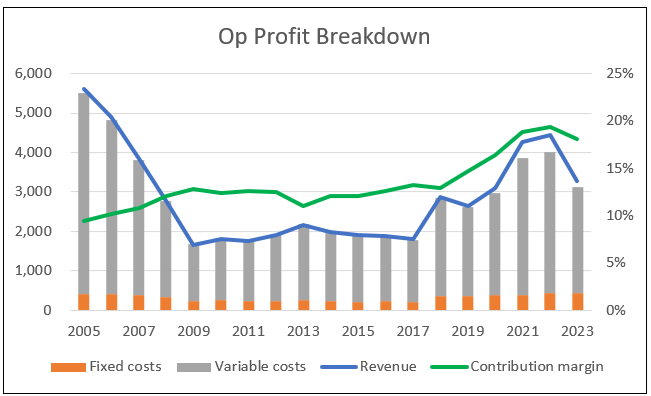
Was there an improvement in the margins? To answer the question, I broke down the operating profit into various components as shown in Chart 4.
- In the chart, a gap between revenue and the total costs (fixed + variable) for a particular year indicates a profit. You can see a better gap over the past few years compared to the start of the cycle.
- The more significant item is the uptrend in contribution margin. This is defined as (Revenue – Variable cost) / Revenue. The improving contribution margin is reflective of improving gross profit margins.
Chart 4: Operating Profit (Author)
Note to Chart 4: I broke down the operating profits into fixed costs and variable costs.
- Fixed cost = SGA, Depreciation & Amortization and Others.
- Variable cost = Cost of Sales – Depreciation & Amortization.
- Contribution = Revenue – Variable Cost.
- Contribution margin = Contribution/Revenue.
Financial position
I would rate BXC's financial position as good based on the following. I would even consider BXC a cash cow.
As of the end of Sep 2023, it had USD 470 million in cash. This was about 30 % of its total assets.
It generated positive cash flow from operations in 7 of the past 10 years. In total, over the past 10 years it generated USD 1.1 billion cash flow from operations compared to the total PAT of USD 0.8 billion. This is a good cash conversion ratio.
Over the past 10 years, it achieved an average 12.0 % Operating Return compared to its WACC of 10.0 %. This indicated that it was able to create shareholders’ value.
There were hardly any Reinvestments over the past 10 years. I defined Reinvestment = CAPEX + Acquisition – Depreciation + Changes in Net Working Capital. This meant that what was incurred for CAPEX, Acquisitions, and Net Changes in Working Capital was offset by Depreciation & Amortization.
It had a good capital allocation plan as shown in Table 1. The cash flow from operations was sufficient to fund share buybacks, CAPEX, and acquisitions. If it wanted to, it could have paid out dividends from the cash build-up.
Table 1: Source and Uses of Funds 2014 to 2023 (Author)
My only concern was with the Debt Capital ratio of 0.49 as of the end of Sep 2023. As per the Aswath Damodaran Jan 2023 dataset , the Debt Capital ratio for the paper and forest product sector was 0.30. It was 0.23 for the construction supplies sector. In mitigation, it had a Cash Flow from Operation to interest coverage of 13.9 as of Sep 2023.
Valuation
BXC revenue is cyclical. According to Damodaran , the performance of cyclical companies depends on where they are in the cycle. As such, extrapolating the performance based on the current performance may give a misleading picture.
He opined that we have to normalize the performance over the cycle and suggested several ways to determine the normalized earnings. These included:
- Taking the average values over the cycle. This may not work in the case of BXC as its size today is different from what it was in 2005 due to several acquisitions undertaken.
- Taking the current revenue and multiplying it by the average margin over the cycle.
I want to offer an alternative approach for BXC. You can see from Charts 1 and 2 that BXC 2023 performance is when the Housing Starts is at the long-term annual average level. I then use the 2023 performance to represent BXC's performance over the Housing Starts cycle.
In the context of the cyclical performance, since the current performance is at the long-term average annual Housing Starts, it represents the normalized performance.
I valued BXC based on the EPV using the Free Cash Flow to the Firm (FCFF) model. The operating model was based on the profit model as shown in Chart 4. There were 3 key variables.
- Contribution margin.
- Capital turnover as represented by Revenue / TCE.
- WACC.
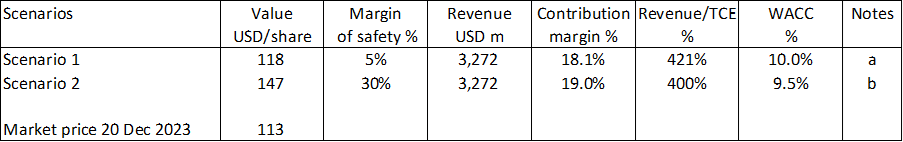
I looked at 2 Scenarios:
- Scenario 1. This is the base case where there is no operating improvement.
- Scenario 2. I assumed that there would be 5% improvements in the contribution margin and WACC. But the capital turnover would deteriorate by 5%.
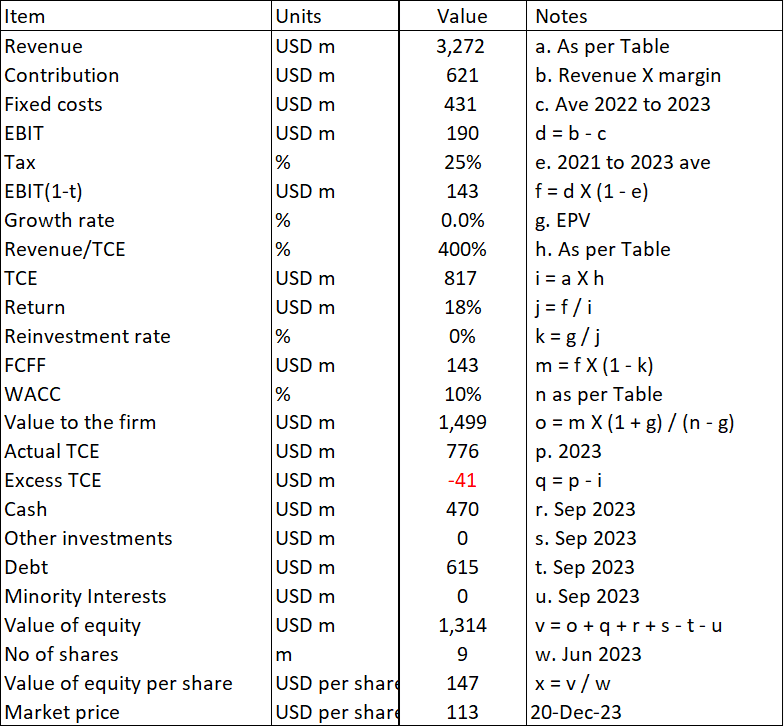
The results of the valuations are shown in Table 2. The intrinsic value of BXC under Scenario 1 is USD 118 per share while than under Scenario 2 is USD 147 per share. The market price as of 20 Dec 2023 was USD 113 per share.
Table 2: Valuation summary (Author)
Notes to Table 2:
a) Revenue, Contribution margin, and Revenue/TCE were based on 2023. WACC was based on current estimates.
b) Revenue was based on 2023. I assumed that the contribution margin was 5% better than that of Scenario 1. Capital turnover and WACC were each lower that those in Scenario 1 by 5 %.
My target is a 30 % margin of safety. There is not enough margin of safety under Scenario 1. But there is a margin of safety under Scenario 2, although it hinges on you accepting the various changes from Scenario 1. These changes can be justified as follows:
Contribution margin
As can be seen from Chart 4, the contribution margin has been on an uptrend since 2005. Over the past 19 years, it grew at 3.7 % CAGR. I think that the 5% improvement is reasonable.
Capital turnover
The difference between the capital turnover and the asset turnover is the denominator. In the former, I used the TCE while for the latter it is total assets.
The DuPont Analysis in Chart 3 showed a deteriorating asset turnover. A similar analysis for the capital turnover showed that from 2005 to 2023 it deteriorated by 3.1 % CAGR. The 5% used in the model is more aggressive. Despite this, there is a 30% margin of safety.
WACC
The WACC for Scenario 1 was based on the first page results of a Google search for the term “BXC WACC” as per Table 3.
Table 3: Deriving the WACC (Various)
You can see that the WACC ranged from 7.7 % to 12.8%. The reason why I am confident that the WACC in the coming years will be lower is that the current WACC is based on a high-interest rate regime. Secondly, we have the current geo-political situation with Ukraine and Gaza.
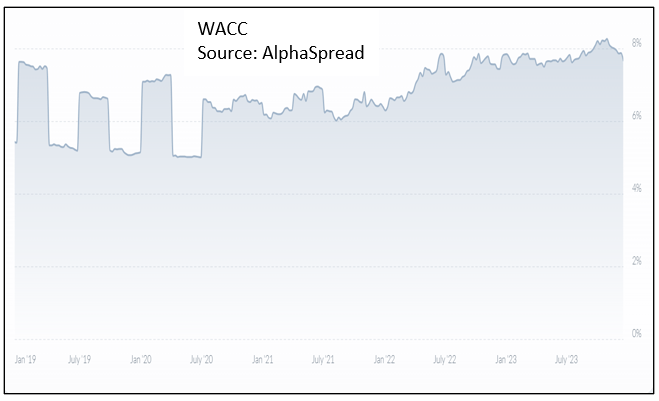
To give you a sense of the current high situation, Chart 5 shows the past 5 years WACC from one of the sources used in my WACC computation.
You can see why I think a reduction in the WACC from 10.0 % to 9.5 % is easily achieved. With inflation coming under control it is only a matter of time before the FED lowers the interest rate.
Chart 5: Historical WACC (Alpha Spread)
The intrinsic value of a firm depends on its future cash flows. In this context, Scenario 2 with the above-mentioned rationales is a better reflection of the future than Scenario 1. As such I see BXC as an investment opportunity.
Single-stage valuation model
My valuation model is based on the operating profit model shown in Chart 4.
I valued BXC using the Free Cash Flow to the Firm (FCFF) model as represented by:
Value of firm = FCFF X (1+g) / (WACC - g)
FCFF = EBIT(1-t) X (1 – Reinvestment rate)
EBIT = Earnings before interest and taxes. This is equal to the operating profit.
g = growth rate = 0 in the EPV case.
t = tax rate. I assumed the 2021 to 2023 average.
Reinvestment rate = 0 in the EPV case.
The value of Equity = Value of the Firm + Cash equivalents + Investments – Debt – Minority Interests.
The Cash, Debt, and Minority Interests were based on the Sep 2023 values.
A sample calculation is shown in Table 4.
Table 4: Sample calculation (Author)
Risks and limitations
There are 3 issues to consider when looking at the 30% margin of safety.
- Cyclical performance.
- Changes to the key variables.
- Ignoring growth.
I took the 2023 Sep LTM values to represent the values over the cycle. It is common in a prolonged downtrend leg to have asset impairments. In my model, I assumed that there is no such impairment. Thus, my value is an optimistic one.
I carried out a sensitivity analysis based on the “normalized” earnings = 2023 revenue X average contribution over the 2005 to 2023 cycle. In such a case, there was no margin of safety under both Scenarios.
In this context, in my Jan 2023 article “ BlueLinx: The Market Is Not Pricing This As A Cyclical Company ” I concluded that there was no margin of safety. At that stage, the market price was lower at USD 80 per share. In that article, I used the average values from 2005 to 2022 to estimate the cyclical values.
The moral of the story – there is a modelling risk you have to consider.
But more importantly, the margin of safety under Scenario 2 comes from the improved performance and lower WACC. I will leave it to you to decide whether the assumptions were reasonable. But I think the change in the WACC is very conservative. There may be more margin of safety that I have allowed for.
Finally, I used the EPV approach because I did not see any historical growth. If you incorporate growth into the model, the intrinsic value would be higher.
Given the pluses and minuses, I think that the 30% margin of safety under Scenario 2 is reasonable.
In case you are interested, I have provided a link to my worksheet to enable you to carry out your sensitivity analysis.
Conclusion
I would rate BXC as fundamentally sound even though it did not deliver any revenue growth over the past 19 years. Of course, if you chose a different starting point post-2010, there will be growth.
The issue is not so much growth. The key point is that this is a fundamentally sound company. There were improving margins and returns indicating that management was able to deliver the strategic goals.
Note: Technically the goals were presented only 2 years ago, but my analysis went way back. But the trends should give you confidence about management’s capability.
BXC is also financially sound with a good cash position and cash conversion ratio. It has a good capital allocation plan. I consider it a cash cow.
This is an investment opportunity if you accept the following 2 assumptions:
- The Sep 2023 LTM performance represents its long-term cyclical performance.
- There will be a 5% improvement in the contribution margin and a 5% reduction in the WACC.
I am a long-term value investor and my analysis and valuation are based on this perspective. This is not an analysis for those hoping to make money over the next quarter or so.
Editor's Note : This article was submitted as part of Seeking Alpha's Top 2024 Long/Short Pick investment competition , which runs through December 31. With cash prizes, this competition -- open to all contributors -- is one you don't want to miss. If you are interested in becoming a contributor and taking part in the competition, click here to find out more and submit your article today!
For further details see:
BlueLinx: The Market Has Yet To Price In Its Improving Margins And Coming Fed Rate Cut (Rating Upgrade)