BNO - BNO: Oil ETF Packs A 1-2 Punch Return Potential And Volatility
2023-12-20 13:36:54 ET
Summary
- Oil prices have experienced a seven-week losing streak, with a 20% decline since September.
- The benchmark for oil pricing has shifted from West Texas Intermediate (WTI) to Brent Crude.
- The United States Brent Oil Fund ETF comes with all the upside potential volatility and drama of oil prices.
Editor's note: Seeking Alpha is proud to welcome The ETF Investor as a new contributor. It's easy to become a Seeking Alpha contributor and earn money for your best investment ideas. Active contributors also get free access to SA Premium. Click here to find out more »
After seven straight weekly losses in the price of oil, it seems timely to consider what's ahead for the United States Brent Oil Fund, LP ETF ( BNO ). This volatile commodity-related ETF is worth considering since it is more of a pure play on the actual price of oil, not a step removed, such as with ETFs that own oil stocks or a wider basket of commodities. That said, we think any ETF in the oil space must be a long-term, multi-year consideration. The space is simply too volatile to try to pick your spots (pardon the pun on the spot price).
BNO could easily drop another 10%, but has a strong chance of finding a floor around the $24 level. We estimate that would equate to a spot price of Brent Crude of about $66 a share, versus just over $73 as of this writing. Thus, we rate BNO a Hold for now.
BNO: when volatility is all relative
Here's a chart of the 1-year standard deviation of BNO back to inception. Incredibly, a 49% level is only a middle-of-the-road marker for this volatile sector of the economy. Investing more directly in the price of oil, versus the relative cushion of having businesses involved in the oil industry (e.g., energy equity ETFs) is a whole other level. It is a real roller coaster, so plan accordingly.
With global energy prices largely determined by the price of Brent's blended crude, there is one single-commodity ETF that trades based on the Brent benchmark pricing: The United States Brent Oil Fund, LP ETF. It is unique due to its short-term focus, investing solely in the nearest month futures contract.
This enables the ETF to better reflect the spot price of Brent compared to other single-commodity ETFs invested in the next 12 months of future contracts or even longer contracts. BNO provides a cost-effective way to invest indirectly in Brent oil and/or to hedge against the movement of its spot price.
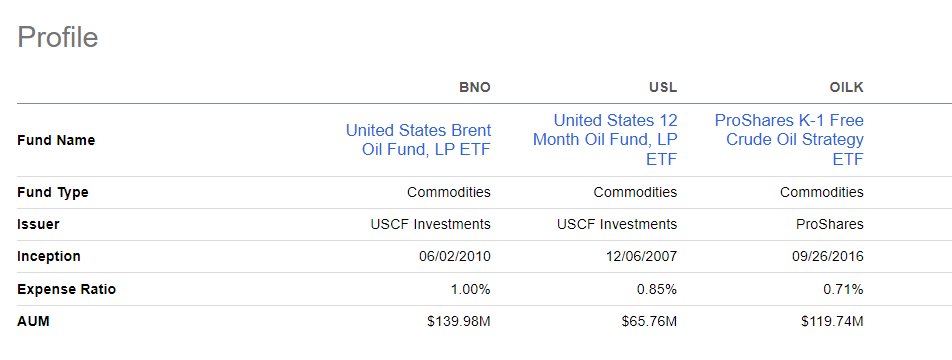
They also get a K-1 tax form, so that is something to keep in mind. That's because BNO is structured as a commodities pool and not an open-end fund, as many ETFs are. This smallish ETF at $132 million in assets, has not hit many radar screens since its 2010 inception. Its expense ratio of just over 1% probably has a lot to do with that, as financial advisors tend to use that level as a line in the sand to consider an ETF for their portfolios.
We take a very different view on expense ratios versus much of the industry. As we see it, there's a cost to doing business, and if one's target is to participate most directly in the fluctuations of Brent Crude, the benefits if the investment is profitable ought to more than cover the 1% annualized cost. This is not an S&P 500 Index fund we're dealing with here.
"You see I'm on a losing streak" says oil
Pardon us for quoting the classic Rolling Stones song, "Satisfaction," but oil's ups and downs are well known. Still, we have to go back five years (to 2018) to find another weekly losing streak that has been as long as the current one. Since September's highs, there has been a roughly 20% decline in the price of oil, whether measured by the WTI benchmark or the Brent Crude benchmark.
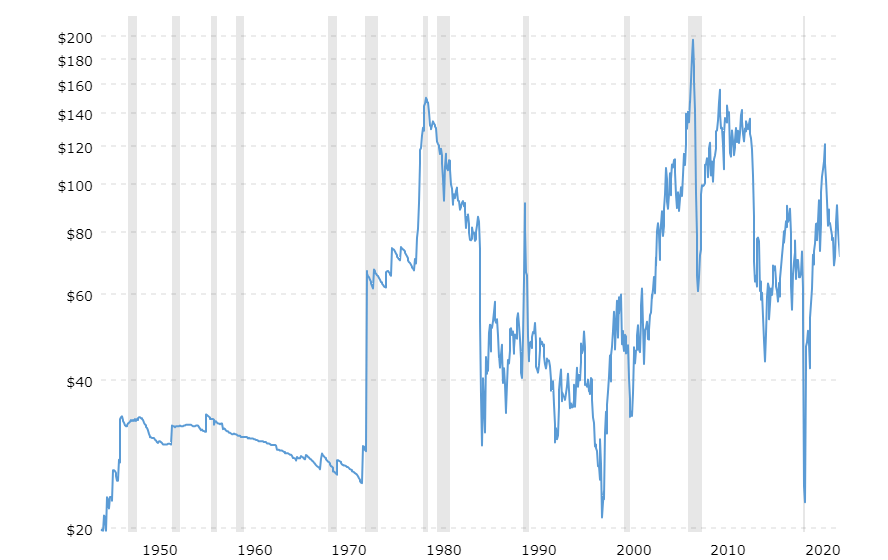
This price decline has multiple explanations: slowing global growth, China's economic health, OPEC's role, Venezuela and Guyana's sovereignty dispute, the push for green energy, and the list goes on. Regardless of these recent reasons, the past seventy years illustrate oil's fluctuating prices:
Oil prices over the past 70 years (Macrotrends.net)
(Source: Macrotrends.net)
Some of the cited reasons for this fall's decline may reverse and the depletion of the US Strategic Petroleum Reserve represents buying demand, if prices get low enough. However, oil's inherent volatility won't change given its cyclical nature.
Recent history of changes and evolution in the nature of oil markets
What has been changing is the way oil is priced, meaning which benchmark gets used to price oil. Most investors are familiar with oil's two different price quotes: one for West Texas Intermediate ((WTI)), and one for Brent Crude. What might not be as well known is WTI's diminished reign as the global oil benchmark. After being the benchmark for most of the 20th century, in 2009 the Saudis and Kuwait stopped using WTI oil pricing, with Iraq following suit in 2010.
By 2013, Brent crude had become the reigning global benchmark used to price different grades of oil that trade in relation to Brent's price. (Grades of oil represent differences in sulfur content and density relative to water, along with the need for transportation to a refinery). This status means Brent crude is now the most widely traded benchmark and is the de facto price barometer for two-thirds of internationally traded oil supplies, as well as many future contracts and derivatives.
This wide use is one reason cited for the price differential between WTI and Brent. Currently, that price spread means Brent's price is higher than WTI's, and depending on supply and storage factors, the differential can be significant.
As of December 10th, BNO held the Feb 24 near-month futures contract, collateralized by cash, as well as 2yr-or-less US Government securities. Between December 14th and 19th of this month, the fund will "roll over" its contract by selling the February contract and buying the next near-month of March. This is a process repeated monthly.
Peer comparison
Compared to another single commodity ETFs invested in WTI's near-month futures contract, for example, the United States 12 Month Oil Fund, LP ETF ( USL ), BNO has outperformed since its inception in June 2010. Moreover, since Covid in 2020, when WTI turned negative for the first time in history, Brent really showed its resiliency, avoiding WTI's fate. In general, Brent prices, and its future contracts, better absorb shocks to the global oil market thanks in part to better storage and transportation access. WTI futures contracts are dependent on more limited storage and pipeline capacity.
Two other oil-related ETFs, ProShares K-1 Free Crude Oil Strategy ETF ( OILK ) and the United States Oil Fund, LP ETF ( USO ) have also underperformed BNO since Covid's exposed WTI's vulnerability. And, BNO's outperformance of all three peers extends back a full decade to 2013 when Brent crude's benchmark became the dominant pricing mechanism for global oil. It still is.
Risks to BNO = risk that the price of oil continues to fall
There is an ongoing set of "binary" events that are likely to influence the price of oil in 2024. That is, they could go either way and likely not in between. And depending on the outcome, BNO's price will be stoked higher or pressured lower.
One such binary event involves the economy of China. A huge oil consumer, the world's second-largest economy is battling a recession, following years of excess building that has crippled its once surging real estate market. If the slower economy impacts oil demand, that's a stress point for BNO.
In addition, the pair of wars in Ukraine and the Middle East can potentially influence the price of oil. Russia, a major oil producer, is certainly in the thick of it, and the US, a top player in oil production, is essentially a party to every major world conflict, albeit indirectly.
OPEC is another wildcard, as always. The organization has a tendency to influence markets by ratcheting production up and down, and the break-even price at which they operate is always something Wall Street tends to follow. At current levels, this ought to be bullish for BNO, since the 25% price decline since late in the second quarter of 2023 has moved the price of oil much closer to that break-even level, an area that OPEC defends vigorously for obvious reasons.
Final Thoughts
Named after the bird "Brent Goose", Brent Oil's benchmark continues its ascent as the best barometer for oil's global price. BNO offers as pure a play on Brent's spot price as seems available at this juncture. For speculative oil traders and those in need of a proven vehicle for hedging oil's price gyrations, keep BNO in mind. We rate it a Hold for now, but will continue tracking it for potential future upgrades.
For further details see:
BNO: Oil ETF Packs A 1-2 Punch, Return Potential And Volatility