WMT - Bonhoeffer Capital - Academy Sports And Outdoors: Long-Term Tailwinds Outstanding Returns
2023-10-19 08:45:00 ET
Summary
- Academy Sports and Outdoors is a sports, outdoor, and recreational product retailer with a wide selection of value-priced merchandise.
- The company has a four-year plan to grow sales to $10 billion and net income to $1 billion, focusing on new store openings and increased efficiency.
- Academy has a strong customer experience, leading in hunting equipment and recreational shooting, and has higher sales per square foot than competitors.
The following segment was excerpted from this fund letter.
Academy Sports and Outdoors, Inc. ( ASO )
Academy Sports and Outdoors (Academy) is a sports, outdoor, and recreational product retailer with locations primarily in the South. Academy’s value proposition is to provide a wide selection of value priced merchandise to customers. Academy currently has 268 locations across 18 states. Academy’s products can be divided into four segments: sports and fitness (21% of sales); outdoors (31% of sales); footwear (20% of sales); and apparel (28% of sales). Over the past four years, Academy has generated revenue growth via store growth (8% annually) and same-store sales growth (5.4% annually). This is a more balanced growth profile versus other competitors like Dick’s and Hibbett, whose growth is more reliant on same-store growth versus new-store openings. Academy also has the highest sales/square foot and profit per store versus the larger Dick’s and the smaller Hibbett.
Management has a four-year plan to grow sales to $10 billion and net income to $1 billion. This plan envisions 50% new stores in both the existing and the edges of the current footprint and within delivery distances from its three distribution facilities in Texas, Georgia, and Tennessee. Management is also expecting return on invested capital to increase to 30%, from 23% last year, as local economies of scale are realized from filling out and expanding its existing footprint at its edges. Inventory turns likewise are expected to increase to 3.5x, from 3.0x currently, as more distribution efficiencies are realized in the supply chain. These are higher turns than both Dick’s and Hibbett. The plan also calls for increased net income margins from 9% today to 10% in four years from economies of scale. The execution of the growth plan will also generate 65% EBITDA FCF conversion allowing ample cash flows for buybacks at low stock prices or dividends at higher valuations.
Academy has four levers for cash flow growth: 1) new store expansion within supply distance of distribution centers, developing higher sales and margins due to local economies of scale; 2) higher same store sales; 3) higher inventory turns; and 4) distributing excess cash as dividends or buying back shares.
Academy was founded in 1938 in Katy, Texas. In 2005, Academy was purchased by the private equity firm KKR. In 2018, as a part of a turnaround plan, Ken Hicks, who previously turned around Foot Locker, was hired as CEO. His plan was to reverse the historic revenue and EBITDA per store decline from 2013 to 2018 of 18% and 60%, respectively. The plan was to enhance the differentiated customer experience and provide a wide selection of goods at value price points. The plan was to increase sales to $6.5 billion from $4.8 billion in 2023, with additional 2023 targets of 5% net income margin, 10% EBITDA margin, 17% return on invested capital, 3x inventory turns, and $325 sales/sq foot. All of these targets were met or exceeded by 2023. In addition, Academy had industry-leading sales per square foot and revenue and EBITDA per store metrics. Academy went public in September 2020, when KKR sold about 20% of Academy’s common shares for $13 per share. Subsequently, in 2021, KKR sold the rest of the shares they owned in a series of secondary offerings.
Since IPO, Academy has opened nine stores in existing states and developed a growth plan described above. I have diligence from two of these newly opened stores and the customer experience was outstanding, with large selections, good pricing, and excellent customer service. One area in particular where Academy is the leader is hunting equipment and recreational shooting. Dick’s has chosen to exit this market, leaving Academy as the selection and volume leader. In addition, Academy has further developed its customer experience and omnichannel sales through COVID. In 2023, the president and CEO transitioned to the chairman of the board, the CFO became CEO, and the chief merchandise officer became president.
Industry Overview
Academy competes with mass general merchants, large-format sporting goods retailers, traditional sporting goods retailers, specialty outdoor retailers, specialty footwear retailers, and catalogue and internet retailers in the United States. The mass general merchants include Walmart ( WMT ), Kohl’s ( KSS ), and Target ( TGT ); large-format retailers include Dick’s ( DKS ) and Scheels; traditional sporting goods retailers include Hibbett ( HIBB ) and Big 5 Sporting Goods ( BGFV ); specialty outdoor retailers include Sportsman’s Warehouse ( SPWH ) and Bass Pro Shop/Cabela’s, specialty footwear retailers such as Foot Locker ( FL ), and catalogue and internet retailers such as Amazon ( AMZN ), EBAY and Fanatics ( FANA ). Academy’s primary competitors are mass general merchants and large format sporting goods retailers.
Academy has the higher Net Promoter Score (NPS), a measure of customer experience, versus its competitors. Its Q4 2022 NPS was 43 vs. 26 for Dick’s, 33 for Bass Pro Shops, 37 for Amazon, 21 for Walmart, and 15 for Target. In addition, Academy’s NPS has grown from 32 in Q2 2020 to 43 in Q4 2022 and held a consistent 10 to15 point lead over both Dick’s and the retailer market average NPS. Academy’s sales per square foot has also been higher than Dick’s (currently 18% higher) and other competitors over the past five years.
The sporting goods retail market is a fragmented market. The overall TAM of the markets Academy directly competes in is estimated to be $175 billion. The sports and fitness market is estimated to be a $13 billion market, the outdoors market a $27 billion market, the footwear market is estimated to be a $47 billion market, and the apparel market is a $88 billion market. The largest competitor in this market is Dick’s, with a 7% market share, followed by Academy with a 3% market share, and Hibbett and Sportsman’s Warehouse having less than 1% market shares.
Sources of growth for Academy include same-store and new-store growth. New-store growth is expected to increase by 10% annually over the next five years. Same-store growth is expected to grow by 2% per year, driven by online sales and increased foot traffic and lager basket sizes. Organic sales growth is expected to be 12% annually with cash flow growth coming from sales growth, operational leverage, and share repurchases or dividends from the 65% FCF conversion from CFO.
Academy’s operations have become better over time, as Ken has implemented his customer-focused growth strategy utilizing economies of scale and efficiencies from increased automation. The return on assets has increased from 1% in FY2009, to 23% in FY2023; and the return on equity increased from 1% in FY2009, to 40% in FY2023. The drivers included increases in net income margins from 0.4% in FY2009, to 9.8% in FY2023, and increases in inventory turnover from 3.0x in FY2013, to 3.4x in FY2023. Leverage also declined from 6.1x, to 1.5x EBITDA.
The incremental return on invested capital over the past five years is close to 100%, which has increased Academy’s RoIC over the past five years. This was influenced by COVID, so a more reasonable target of 30% as laid out by management is appropriate. See the calculations below.
| ASO |
| 2012 |
| 2013 |
| 2014 |
| 2015 |
| 2016 |
| 2017 |
| 2018 |
| 2019 |
| 2020 |
| 2021 |
| 2022 |
| 2023 |
| Capital Invested |
| 106 |
| 98 |
| 63 |
| 247 |
| 76 |
| 108 |
| 222 |
| 2-yr sum |
| 204 |
| 161 |
| 310 |
| 323 |
| 184 |
| 4-yr sum |
| 514 |
| 484 |
| 494 |
| CFO |
| 196.3 |
| 145.2 |
| 210 |
| 464 |
| 898 |
| 771 |
| 705 |
| 2yr change |
| 13.7 |
| 318.8 |
| 688 |
| 307 |
| -193 |
| 4yr change |
| 701.7 |
| 625.8 |
| 495 |
| 5-yr avg |
| 2-yr ROIIC |
| 6.7% |
| 198.0% |
| 221.9% |
| 95.0% |
| -104.9% |
| 83.4% |
| 4-yr ROIIC |
| 136.5% |
| 129.3% |
| 100.2% |
| 122.0% |
Downside Protection
Academy’s risks include both operational leverage and financial leverage. Operational leverage is based upon the fixed vs. variable costs of the store and logistics operations. Academy has built distribution infrastructure to support the four-year plan of rolling out 50% more stores in and adjacent to the existing store footprint. There are some local economies of scale in terms of distribution and shared advertising and general and administrative costs, as the business is primarily located in the South and is expanding in the Midwest and the Great Lakes region of the United States.
Financial leverage can be measured by the debt/EBITDA ratio. Academy has below-average net debt/EBITDA of 1.5 versus other sporting goods retailers (like Sportsman’s Warehouse, Hibbett, and Big 5) and versus Academy’s history. The history and projected financial performance for Academy is illustrated below.
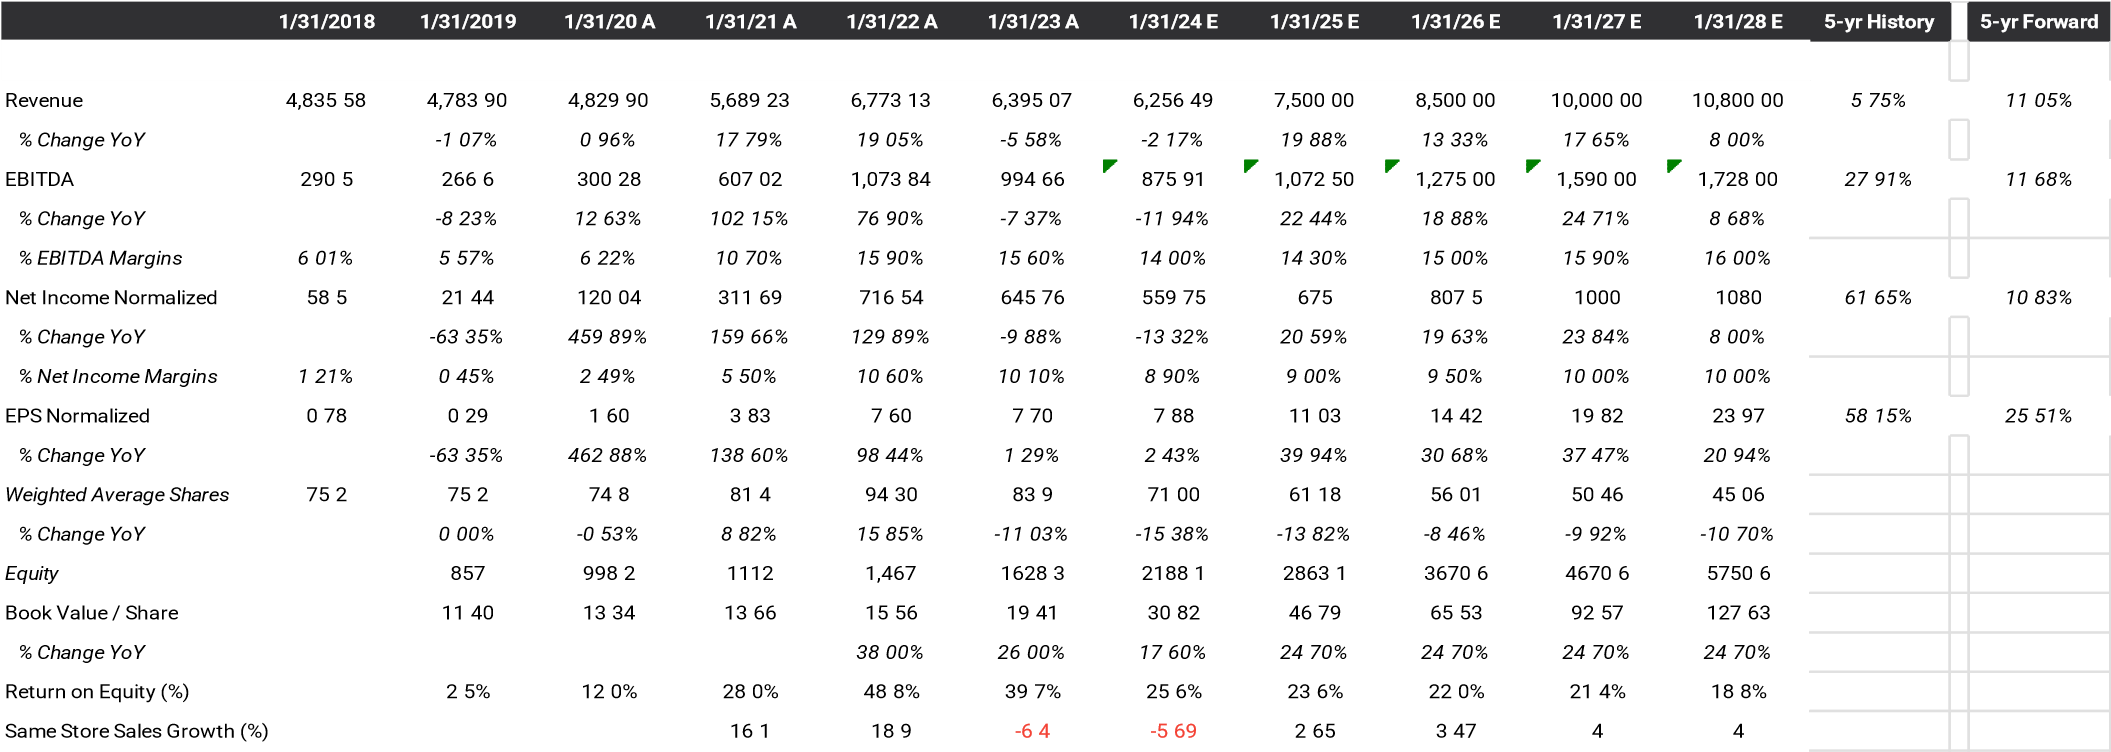
Management and Incentives
Academy’s management team has developed a growth engine and operationally efficient firms in the retailing of sporting and outdoor goods. They have developed a store rollout plan to capture a similar demographic as their existing core customer, the Southern sports and outdoorsman, by infilling their existing footprint and expanding at the footprint’s edges. Management plans on returning cash to shareholders from its business plan via buybacks. This should be accretive to value at current share prices and earnings levels, 7.1x EPS.
The base compensation for the CEO is 67% higher than for the remaining management team (top five officers). Over the past three years, the management team’s total compensation was about $26 million per year, about 5% of net income per year. Academy has the following shareholding guidelines for managers: CEO 5x base salary, EVPs 3x base salary, SVPs 2x base salary, and VPs 0.5 to 1x base salary. The CEO currently hold 1.5 million shares and options (worth $76.6 million), about 1.9% of shares outstanding, which is more than 6.7 times his FY2023 salary and bonus of $11.4 million. Other members of the management team hold 2.7 million shares (worth $137.9 million).
The CEO’s compensation is structured to include $1.1 million of base pay and $4.0 million in performance bonuses. Short-term incentives are based upon net sales and adjusted EBIT targets and are paid in cash. Long-term incentives include: performance-based restricted shares based upon three-year adjusted EBIT and return on invested capital targets (50% of total), three-year time-vested restricted shares (25% of total), and three-year time-vested options (25% of total).
Board members have an investment in Academy. They have to hold 3x their annual director’s fees in Academy shares. Non-management directors hold 114 thousand shares (worth $5.9 million).
Valuation
| Valuation |
| Senstitivity Table |
| Price |
| Upside |
| Current Adjusted Earnings |
| $6.98 |
| 7-year Expected EPS Growth Rate |
| 20% |
| -0.4% |
| $50.92 |
| 0.0% |
| Historical EPS Growth Rate |
| 40% |
| 3.0% |
| $95.56 |
| 87.7% |
| Current AAA Bond Rate |
| 4.7% |
| Growth Rate |
| 5.0% |
| $121.93 |
| 139.4% |
| Implied Graham Mutiplier * |
| 45.79 |
| 10.0% |
| $187.83 |
| 268.9% |
| Implied Value |
| $319.64 |
| 20.0% |
| $319.64 |
| 527.7% |
| Current Price |
| $50.92 |
| 25.0% |
| $385.55 |
| 657.2% |
| * (2*Growth Rate + 8.5)* (4.4%/AAA bond r |
| ate) |
The key to the valuation of Academy is the expected growth rate. The current valuation implies an earnings/FCF decrease of 0.4% in perpetuity using the Graham formula ((8.5 + 2g)). The historical 10year earnings growth has been 40% per year including acquisitions and the current return on equity of 40%.
A bottom-up analysis based upon unit (10% per year) and SSS growth rates (3% per year) of Academy’s markets results in an organic revenue growth rate of 13% for Academy. Historically, Academy’s revenue growth rate was 6% per year, driven by lower unit growth. The net income increased by 40% per year, in part by operational leverage and by COVID. Going forward, if we assume steady net income margins of 10%, with operational leverage offsetting the COVID decline, we arrive at a net income growth rate of 13%. Academy is expected to return excess cash to shareholders (65% of CFO) via repurchases or dividends. This will result in share reductions of about 10% to 15% per year, assuming a $10 increase in price per share for Academy over the next seven years. The resulting increase in EPS will be about 20% per year. Using a 20% expected growth rate, the resulting current multiple is 46x of earnings, while Academy trades at an earnings multiple of 7x. If we look at high-growth comparables, they have an average earnings multiple of 36x. If we apply 15x earnings to Academy’s estimated FY2024 earnings of $7.88, then we arrive at a value of $118.2 per share, which is a reasonable short-term target. If we use a 20% seven-year growth rate, then we arrive at a value of $319.54 per share. This results in a five-year IRR of 44%.
Growth Framework
| Academy Sports & Outdoors |
| EPS Growth |
| 25.3% |
| 2021 |
| 2022 |
| 2023 |
| 2024 |
| 2025 |
| 2026 |
| 2027 |
| 2028 |
| 2029 |
| $ 50.92 |
| 2.57 |
| 5-yr fwd PE |
| % growth PE |
| 15.2% |
| 6.57 |
| Earnings/FCF Yield |
| 20.5 |
| Revs |
| $6,773 |
| $6,395 |
| $6,239 |
| $6,702 |
| $7,516 |
| $8,713 |
| $10,000 |
| $10,800 |
| $11,664 |
| -6% |
| -2% |
| 7% |
| 12% |
| 16% |
| 15% |
| 8% |
| 8% |
| 13% growth (10% unit growth ( PLAN ) & 2% SSS) |
| Decline thereafter |
| NI/FCF |
| $717 |
| $645 |
| $550 |
| $589 |
| $687 |
| $828 |
| $1,000 |
| $1,080 |
| $1,166 |
| Inv Turn |
| 3.79 |
| 10.6% |
| 10.1% |
| 8 8% |
| 8.8% |
| 9.1% |
| 9.5% |
| 10 0% |
| 10.0% |
| 10.0% |
| 3 04 |
| EPS |
| $ 8.09 |
| $ 8 .43 |
| $ 7 .75 |
| $ 8 .91 |
| $ 11.23 |
| $ 14.78 |
| $ 19.82 |
| $ 23.97 |
| $ 29 34 |
| $ - |
| 88.6 |
| $4,511.51 |
| 4% |
| -8% |
| 15% |
| 26% |
| 32% |
| 34% |
| 21% |
| 22% |
| Share BB |
| $ 406.30 |
| % of FCF |
| 88.6 |
| 76.5 |
| 71.0 |
| 66.1 |
| 61.2 |
| 56.0 |
| 50.5 |
| 45.1 |
| 39.8 |
| 39.8 |
| 51% |
| 50% |
| 8.1 |
| 5.5 |
| 4.9 |
| 4.9 |
| 5.2 |
| 5.6 |
| 5.4 |
| 5.3 |
| 0.0 |
| 0.0 |
| 40 |
| 50 |
| 60 |
| 70 |
| 80 |
| 90 |
| 100 |
| 110 |
| 120 |
| 130 |
Another way to look at growth and the valuation of companies is to estimate the EPS five years into the future and see how much of today’s price incorporates this growth. Using the same revenue described above results in a FY2028 EPS of $23.97, or 2.6x the current price. If we assume a steady-state growth rate from 2028 on of 6%, and 50% of NI is used to repurchase shares, then this results in a fair value Graham multiple of 20.5x or $406.3 per share, higher than the five-year-forward valuation above of $319.54 per share.
Comparables and Benchmarking
Below are sporting goods and high-growth retailers located in the United States and Canada. Compared to these firms, Academy has debt on the low end of the range and has better growth prospects and a below-average multiple. Academy also has high RoEs and the highest five-year growth rates.
| Sporting Goods Retailers |
| 5-yr |
| 22 Annual |
| EBITA |
| EBITA |
| 5-yr |
| EBITDA |
| Sales/ |
| Same Store |
| Debt/ |
| Price |
| Book Value |
| Earnings |
| Inv Turns |
| Margin |
| Coverage |
| RoE |
| Growth |
| P/E |
| P/BV |
| Sq Ft |
| Growth |
| EBITDA |
| Academy Sports |
| 50.94 |
| 21.99 |
| 6.98 |
| 3.41 |
| 13.2% |
| 16.40 |
| 33.8% |
| 27.0% |
| 7.3 |
| 2.32 |
| 340.00 |
| -6.4% |
| 1.50 |
| Dick's |
| 111.67 |
| 30.74 |
| 12.06 |
| 3.15 |
| 12.1% |
| N/A |
| 34.5% |
| 20.0% |
| 9.3 |
| 3.63 |
| 290.00 |
| -0.5% |
| N/A |
| Hibbert |
| 45.03 |
| 29.55 |
| 7.25 |
| 3.45 |
| 9.9% |
| 33.60 |
| 29.6% |
| 22.0% |
| 6.2 |
| 1.52 |
| 266.00 |
| -2.2% |
| 1.42 |
| Big 5 Sports |
| 8.06 |
| 11.82 |
| 0.23 |
| 2.24 |
| 3.4% |
| 40.40 |
| 16.1% |
| 5.6% |
| 35.0 |
| 0.68 |
| 192.00 |
| -14.5% |
| 2.17 |
| Sportsman's Warehouse |
| 4.93 |
| 7.34 |
| 0.54 |
| 2.02 |
| 4.1% |
| 6.60 |
| 43.3% |
| 5 9% |
| 9.1 |
| 0.67 |
| 286.00 |
| -12.2% |
| 3.40 |
| High Growth Retailers |
| Ulta Beauty |
| 319.88 |
| 33.01 |
| 10.57 |
| 3.71 |
| 16.1% |
| N/A |
| 42.1% |
| 17.1% |
| 30.3 |
| 9.69 |
| 701.00 |
| 15.6% |
| 0.00 |
| Ollie's Bargain Basement |
| 93.53 |
| 16.8 |
| 3.04 |
| 2.64 |
| 14 9% |
| N/A |
| 18.1% |
| 24.1% |
| 30.8 |
| 5.57 |
| 118.30 |
| -3.0% |
| 0.00 |
| five Below |
| 192.32 |
| 13.61 |
| 4.01 |
| 3.60 |
| 11 8% |
| N/A |
| 29.5% |
| 23.5% |
| 48.0 |
| 14.13 |
| 241.60 |
| -3.2% |
| 0.00 |
Risks
The primary risks are:
- slower-than-expected sales growth (currently projected to be 13% based upon 10-store growth and 3% SSS growth);
- lower-than-expected net income margins (currently projected to grow at 10% by FY2027); and
- higher stock prices, making buybacks less accretive.
Potential Upside/Catalyst
The primary catalysts are:
- higher-than-expected sales growth;
- higher-than-expected net income margins; and
- increased local scope or purchase of local scale in new markets.
Timeline/Investment Horizon
The short-term target is $120 per share, which is almost 140% above today’s stock price. If the continued organic growth thesis plays out over the next five years (with a resulting 20% earnings per year growth rate), then a value of $363 (midpoint of the two methods described above) could be realized. This is a 48% IRR over the next five years.
DisclaimerThis letter does not contain all the information that is material to a prospective investor in the Bonhoeffer Fund, L.P. (the “Fund”). Not an Offer: The information set forth in this letter is being made available to generally describe the philosophies of the Fund. The letter does not constitute an offer, solicitation or recommendation to sell or an offer to buy any securities, investment products or investment advisory services. Such an offer may only be made to accredited investors by means of delivery of a confidential private placement memorandum, or other similar materials that contain a description of material terms relating to such investment. The information published and the opinions expressed herein are provided for informational purposes only. No Advice: Nothing contained herein constitutes financial, legal, tax, or other advice. The Fund makes no representation that the information and opinions expressed herein are accurate, complete or current. The information contained herein is current as of the date hereof but may become outdated or change. Risks: An investment in the Fund is speculative due to a variety of risks and considerations as detailed in the Confidential Private Placement Memorandum of the Fund, and this letter is qualified in its entirety by the more complete information contained therein and in the related subscription materials. No Recommendation: The mention of or reference to specific companies, strategies or instruments in this letter should not be interpreted as a recommendation or opinion that you should make any purchase or sale or participate in any transaction. |
Editor's Note: The summary bullets for this article were chosen by Seeking Alpha editors.
For further details see:
Bonhoeffer Capital - Academy Sports And Outdoors: Long-Term Tailwinds, Outstanding Returns