BLDR - Bonhoeffer Capital Management Q1 2023 Letter
2023-06-24 02:30:00 ET
Summary
- The Bonhoeffer Fund, LP, is a value-oriented investment partnership. The fund's objective is to grow capital at a faster rate than market indices over full market cycles and provide minimal.
- There have been modest changes within the portfolio in the last quarter, which is in line with our low historical turnover rates.
- We are investigating additional consolidation plays with modest valuations in industries that have attractive returns on invested capital.
Bonhoeffer Fund Portfolio Overview
Bonhoeffer’s investment portfolio consists of value-oriented special situations, as well as growth-oriented firms that exhibit unique qualities when applying a value framework. We are particularly interested in companies that generate growth through organic growth, transition, and consolidation. There have been modest changes within the portfolio in the last quarter, which is in line with our low historical turnover rates. We sold some of our slower-growing investments and invested some of our cash into TerraVest ( TVK:CA ), described in the detailed case study in the appendix.
As of March 31, 2023, our largest country exposures include: South Korea, United States, United Kingdom, South Africa, Philippines, and Latin America. The largest industry exposures include: distribution, telecom/media, real estate/infrastructure, and consumer products.
We are investigating additional consolidation plays with modest valuations in industries that have attractive returns on invested capital such as chemicals, leasing, distributors, housing, and specialty finance.
Compound Mispricings (31.5% of Portfolio; Quarterly Average Performance -2.9%)
Our Korean preferred stocks, the nonvoting shares of Telecom Italia ( TIIAY ), and Wilh. Wilhelmsen ( WLLSF ), all feature characteristics of compound mispricings. The thesis for the closing of the voting, nonvoting, and holding company valuation gap includes evidence of better governance and liquidity. We are also looking for corporate actions such as spinoffs, sales, or holding company transactions and overall growth.
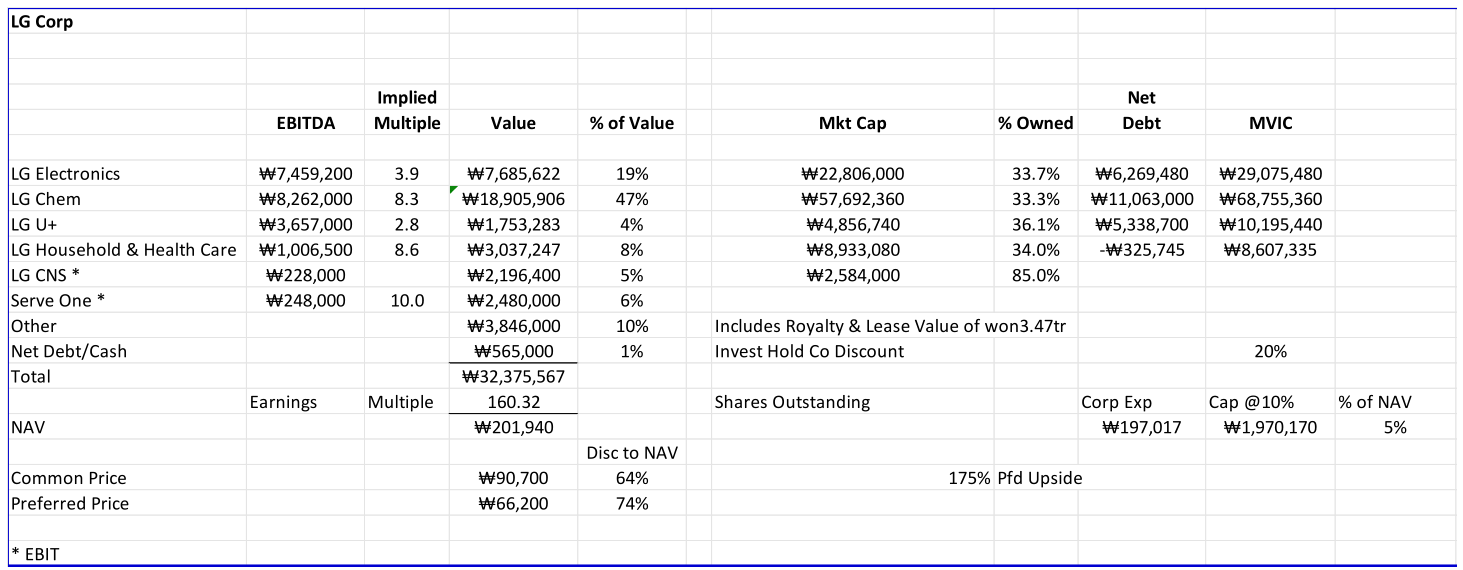
LG Corporation is a compound mispricing which has become more interesting as its price has increased less than its NAV. The company includes stakes in some of South Korea’s largest and most-profitable firms such as LG Electronics, LG Chem ( LGCLF , including its EV battery division), and LG Household & Health Care ( LGHHF ). Some of the growth drivers include EV batteries (LG Chem), computer processing (LG Electronics) and China consumers (LG Household & Health Care). Earnings are projected to increase by 10% per year over the next four years (dividends have grown by 9% per year over the past five years) with 1.5% per year of share buybacks, and preferred shares have a dividend yield of 5% for a total return of 17%, assuming no reduction in discount to NAV or changes in multiples. The trading multiples of the large subsidiaries are reasonable given their growth prospects. Below is an intrinsic value for LG based on the value of the underlying subsidiaries they hold.
Another compound mispricing holding, Telecom Italia ((TI)), the Italian incumbent telecom firm with wireline and wireless holdings in Italy and Brazil, is still in negotiations about the sale/merger of their core network. The asset sales require the approval of the Italian government. There has been some progress in the negotiations and offers over the past quarter. The share price has gone up on hope of higher bids and then down as these higher bid prices failed to materialize. The bidders are resubmitting their bids as the first-round bids were below management’s expectations. Vivendi ( VIVEF ) has a large stake in TI and a board seat and has been pressing for a higher price for TI’s network assets. We will see how the process develops over the next six months.
Public LBOs (45.2% of Portfolio; Quarterly Average Performance 6.6%)
Our broadcast TV franchises, leasing, building products distributors, plastic packaging, and roll-on/rolloff ((RORO)) shipping fall into this category. One trend I find particularly compelling in these firms is growth creation through acquisitions which provides synergies and operational leverage associated with vertical and horizontal consolidation and the subsequent repurchasing of shares with debt. The increased cash flow from acquisitions and subsequent synergies are used to pay the debt, and the process is repeated. The effectiveness of this strategy is dependent upon a spread between borrowing interest rates and the cash returns from the core business and acquisitions. Over the past 12 months, interest rates have been increasing, and this has reduced the economics of this strategy; but a large spread still exists if assets can be purchased at the right price. Increasing interest rates have affected the returns on public LBO firms.
Consolidated Communications ( CNSL ) is a broadband communications provider who is rolling out a fiberoptic network described in detail in previous letters. [1] Recently, CNSL received a buyout proposal from Searchlight, the private equity firm who funded the fiberoptic rollout to date. The offer was for $4/share. We believe this vastly undervalues CNSL. For example, using an exit multiple of 11x EBITDA (about 50% of current fiberoptic transition multiples) and the projected 2027 EBITDA based upon management’s current plan results in a value of $35/share. If an 8.5x EBITDA multiple (the current depressed multiple for broadband providers) is applied to the projected 2027 EBITDA, the result is $20/share. As a result, we sent a letter to CNSL’s special committee describing our valuation and proposing other options they might consider to secure the additional funding to ensure the fiberoptic network can be rolled out. We received an acknowledgement of receipt, but that is the extent of the feedback for shareholders who sent letters to the special committee.
Distribution Theme (40.6% of Portfolio; Quarterly Performance 23.6%)
Our holdings in car dealerships and branded capital equipment dealerships, convenience stores, building product distributors, automobile transportation logistics, and capital equipment leasing firms all fall into the distribution theme. One of the main key performance indicators for dealerships is velocity, or inventory turns. We own some of the highest-velocity dealerships in markets around the world. Over the past two years, there have been challenges in some markets hit by COVID, like South Africa and Latin America, but we are seeing recovery now that vaccines have been approved and distributed.
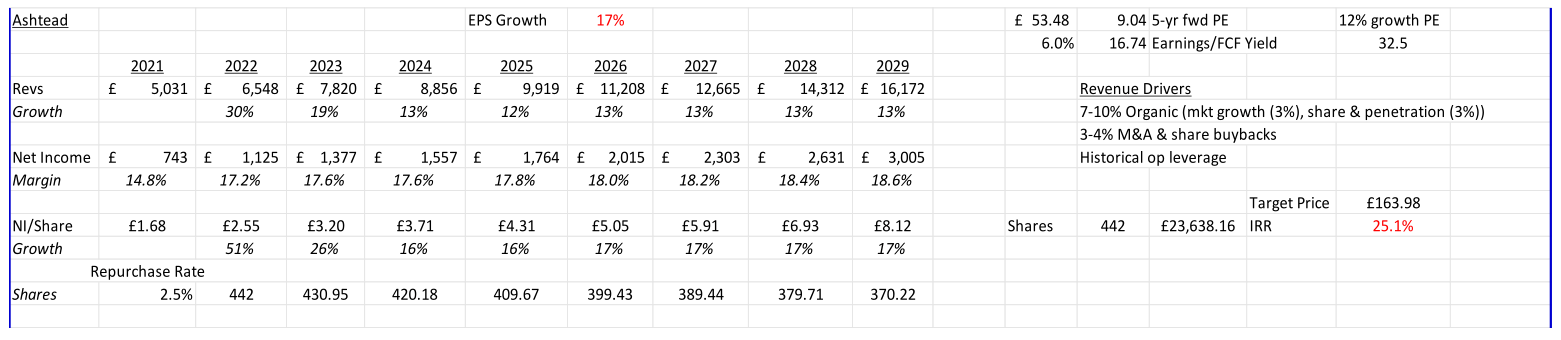
One of our holdings in the distribution theme is Ashtead Group (Ashtead), a clustered general and specialty equipment leasing firm. Ashtead’s growth model is driven by organic growth (3% per year due to market growth and 3-6% per year from increased penetration (driven by specialty penetration) and 4% per year from buy-backs and synergistic M&A). These are enhanced by opportunistic operational leverage from scale and share repurchases (5% annual growth). Over the past 10 years, Ashtead’s net income margins are up from 11.6% to 17.6%, with a 6x increase in revenues. These factors should lead to about a 17% EPS growth going forward. Ashtead has had 25% EPS growth over the past 10 years. Since FY2018, Ashtead has repurchased 12% of its common stock.
The real drivers of Ashtead’s earnings are the dollar utilization of the rental equipment and the net margins. Rising dollar utilization to the upper-50%s and margins have held steady over time as Ashtead has scaled over the past five years. We have used analyst estimates for revenue and free cash flow/earnings for the next two years and longer-term growth assumptions described above. We have also assumed the five-year historical average share repurchase rate of 2.5% per year.
Ashtead currently trades for a FY2023 EPS multiple of about 16.7x and an earnings yield of 6%, with midteens expected EPS growth. Given a conservative projected EPS growth of 12% per year, Ashtead should trade at 32.5x earnings using Graham’s formula of 8.5 + 2 * growth rate. Applying this multiple results in about a 2x return today and a 3x return in five years.
Telecom/Transaction Processing Theme (31.7% of Portfolio; Quarterly Performance -17.0%)
Within this theme, the increasing use of transaction processing in the markets of our respective firms— as well as the rollout of fiberoptic and 5G networks—is providing growth opportunities. Given that most of these firms are holding companies and have multiple components of value (including real estate), the timeline for realization may be longer than for more mono-industry-focused firms. Most of these firms have been strong given their continued growth in telecom and processing revenues in spite of their poor showings in the first quarter. The largest detractor to performance was the decline in price of Consolidated, as they missed Q4 earnings expectations.
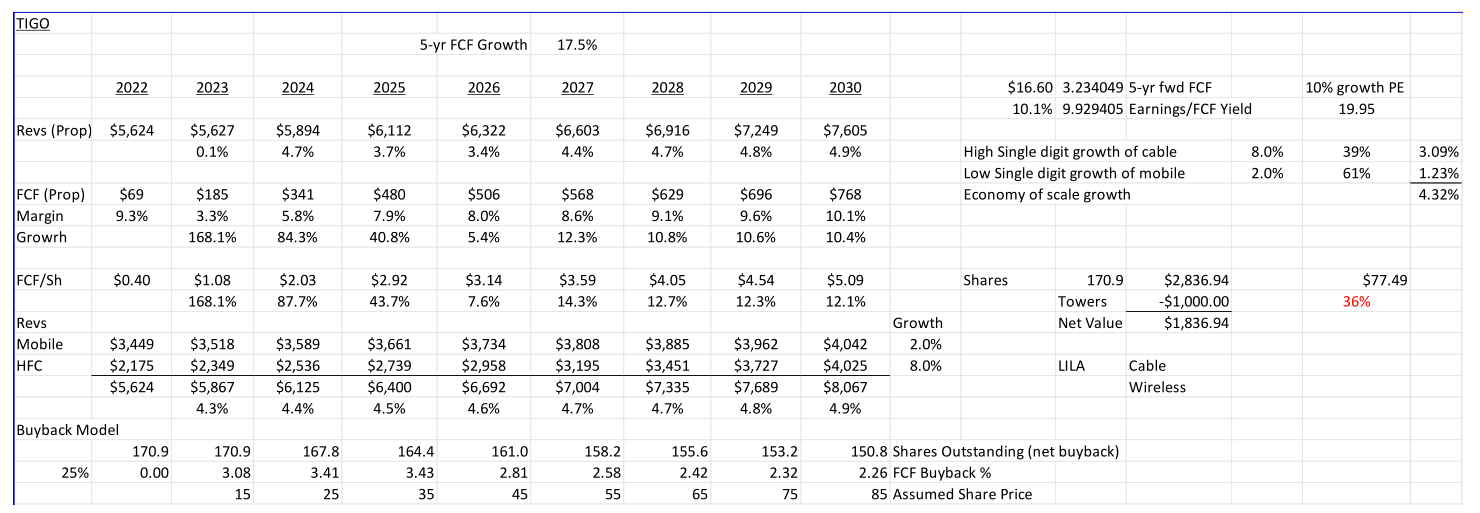
Millicom ( TIGO ), a Latin American telecommunications firm that provides high-speed internet, cable, and wireless to nine markets, has become a special situation, as two strategic investors are either bidding for the entire firm or purchasing large stakes in Millicom. Below is a refresh of highlights from the last quarterly letter. Millicom is also in the process of separating both its towers business (about 10,000 towers) and its TIGO Money business for either sale or co-investment. Based upon historical tower sales by Millicom and comparable transactions and trading prices for Latin American tower businesses, we think the towers are worth about $1.4 billion, or $8.00 per share. Given the current price of Millicom, the stub has an implied value of about 9.9x 2023 FCF or 3.2x projected 2028 FCF. Millicom’s debt level is low, and the company will be in the position to buy back shares next year while continuing to invest in its fiber rollout. There is additional value outside the core business in Millicom’s data centers and TIGO Money (see our case study in the Q3 2021 letter ).
Given a conservative projected EPS growth of 10% per year (vs. the 18% projected FCF growth rate), Millicom should trade at 20x earnings using Graham’s formula of 8.5 + 2 * growth rate adjusted for EM risk. Applying this multiple results in about a 2x return using the 2023 FCF midpoint (including $1.0 billion tower valuation) and a 4.5x return in five years. Below is an updated value of Millicom’s equity valuation based upon management’s current forecast to 2024 assuming no value for Millicom’s data centers or TIGO Money.
Recently, there have been two bids for Millicom from two parties. First, Marcelo Claure, a Latin American billionaire, and Apollo have made a bid for Millicom (reportedly in the mid-$20s). Second, French tycoon Xavier Niel purchased about 20% of Millicom. Niel founded French fiber telecom firm Iliad and is also invested in Eir, an Irish fiber telecom. Niel has been appointed to the board of Millicom and is part of a group bidding on other Latin American assets, including a Brazilian supermarket.
Consumer Product Theme (12.3% of Portfolio; Quarterly Performance 2.0%)
Our consumer product, tire, and beverage firms comprise this category. The defensive nature of these firms has led to better-than-average performance. One theme we have been examining is the development of category-killer retail franchises. These firms have developed local franchises which have higher inventory turns, margins, and sales per square foot than competitors, all resulting in great unit economics and high returns on incremental invested capital. They also have some unique characteristics such as a specialty niche (like tire stores) or doing something the competitors will not do (like selling hunting supplies).
Real Estate/Construction Theme (30.9% of Portfolio; Quarterly Performance 16.1%)
The pricing of our real estate holdings is positively impacted by the re-opening of China and Hong Kong from COVID restrictions and its effects on Hong Kong’s tourism from China. The current cement and construction holdings (in US/Europe via Builders FirstSource ( BLDR ) and Vistry ( BVHMF ), and in Korea via Asia Cement) should do well as the world recovers from COVID shutdowns and governments worldwide incentivize infrastructure programs. Even after a 50% rally in its stock price, Asia Standard ( ASASF ) still sells for 5% of book value including its mark-to-market changes in its real estate and investment portfolio. The portfolio includes Chinese real estate developer bonds which should recover in value as the Chinese government provides incentives for further real estate development.
Unit Economics
In previous letters, I have discussed unit economics and how it is important to understand the unit economics of a business to understand its growth drivers. For rental/leasing companies, a simple IRR type model can be used to compare the unit economics of firms across different types of assets. One of our holdings, Ashtead Group ( ASHTF ), leases construction and building equipment in the United States and the UK. For rental firms, unit economics can be estimated by developing unit cost IRR as illustrated below for Ashtead using 2022 numbers.
| Yr 1 |
| Yr 2 |
| Yr 3 |
| Yr 4 |
| Yr 5 |
| Yr 6 |
| Yr 7 |
| AHT |
| Time Util |
| 0.57 |
| 0.57 |
| 0.57 |
| 0.57 |
| 0.57 |
| 0.57 |
| 0.57 |
| EBITDA |
| 0.453 |
| 0.453 |
| 0.453 |
| 0.453 |
| 0.453 |
| 0.453 |
| 0.453 |
| 40% Gain on sale |
| Taxes |
| 0.88 |
| 0.88 |
| 0.88 |
| 0.88 |
| 0.88 |
| 0.88 |
| 0.88 |
| Residual |
| 0.42 |
| CFs |
| -1.00 |
| 0.23 |
| 0.23 |
| 0.23 |
| 0.23 |
| 0.23 |
| 0.23 |
| 0.65 |
| IRR |
| 17.9% |
The yearly cash flow is equal to time utilization * EBITDA margin (including SBC) * EBITDA tax rate. The residual value is equal to the BV at time of sale times the gain on sale in more normalized times—like 2019. The IRR of these cash flows over the expected life of the equipment of about seven years (based upon an average age of 3.3 years) results in the leasing IRR.
Using similar numbers for URI results in the following unit economics:
| Yr 1 |
| Yr 2 |
| Yr 3 |
| Yr 4 |
| Yr 5 |
| Yr 6 |
| Yr 7 |
| URI |
| Time Util |
| 0.557 |
| 0.557 |
| 0.557 |
| 0.557 |
| 0.557 |
| 0.557 |
| 0.557 |
| EBITDA |
| 0.438 |
| 0.438 |
| 0.438 |
| 0.438 |
| 0.438 |
| 0.438 |
| 0.438 |
| 40% Gain on sale |
| Taxes |
| 0.88 |
| 0.88 |
| 0.88 |
| 0.88 |
| 0.88 |
| 0.88 |
| 0.88 |
| Residual |
| 0.42 |
| CFs |
| -1.00 |
| 0.21 |
| 0.21 |
| 0.21 |
| 0.21 |
| 0.21 |
| 0.21 |
| 0.63 |
| IRR |
| 16.5% |
And for HERC (a less scaled competitor):
| Yr 1 |
| Yr 2 |
| Yr 3 |
| Yr 4 |
| Yr 5 |
| Yr 6 |
| Yr 7 |
| HERC |
| Time Util |
| 0.438 |
| 0.438 |
| 0.438 |
| 0.438 |
| 0.438 |
| 0.438 |
| 0.438 |
| EBITDA |
| 0.438 |
| 0.438 |
| 0.438 |
| 0.438 |
| 0.438 |
| 0.438 |
| 0.438 |
| 40% Gain on sale |
| Taxes |
| 0.88 |
| 0.88 |
| 0.88 |
| 0.88 |
| 0.88 |
| 0.88 |
| 0.88 |
| Residual |
| 0.42 |
| CFs |
| -1.00 |
| 0.17 |
| 0.17 |
| 0.17 |
| 0.17 |
| 0.17 |
| 0.17 |
| 0.59 |
| IRR |
| 10.9% |
From these IRR snapshots we can see the relative IRRs for future investment. Ashtead has the highest IRR driven primarily by high dollar utilization and high EBITDA margins. Dollar utilization is driven by pricing and how the equipment can be used in high yielding applications like specialty leasing and whether the equipment is leased in high value-added applications (like emergency services, film production, or for last-minute rentals). Each of these businesses sell equipment at the end of life at about the same premium to book value. These metrics, plus the return on incremental invested capital (RoIIC) framework described in the last letter, can be used to assess the current returns and trends in the returns on capital for leasing firms. For the RoIIC calculation, the changes in working capital adjusted CFO are divided by the investment made (capital expenditures and acquisitions) over the same periods of time. The RoIIC analysis for Ashtead is below.
These returns are consistent with unit economics above. And for URI, this analysis is below.
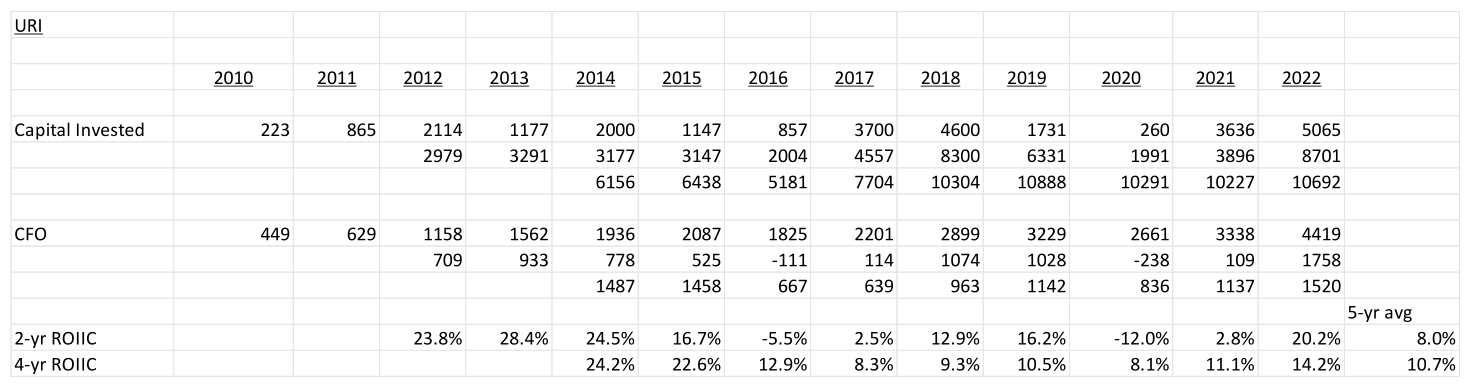
URI returns are lower than the unit economics due to the goodwill from the acquired firms. The value of the purchased goodwill includes the right for URI to invest at book value to generate the unit economics (16.5% returns) described above. The question going forward is: will URI be as dependent upon acquisitions for growth as it has been in the past? If so, then RoIIC is closer to the calculation above. If the number of acquisitions declines, then it will be closer to the unit economics returns.
Drivers of Value over Time
John Huber has developed a framework to examine the drivers of stock returns over time which is very useful in examining firms for investment returns over time. [2] The framework is the total return of the stock price over time = (changes in earnings x the changes in the earnings multiple x changes in shares outstanding) + dividends. By examining the growth drivers, we can identify which drivers are key to increasing total return and look at the history and prospects for each of the value drivers.
Let’s examine some of our holdings using this framework, comparing Ashtead to United Rentals ( URI ) and KT Corporation ( KT ). Ashtead’s growth had been driven by earnings growth which has increased by 29% per year over the past 10 years. Its buybacks and dividends have added about 3% per year, and its multiple has contracted about 3% per year. Its total return has been 29% per year over the past 10 years. Over this period of time, Ashtead’s RoE has increased from 17% to 23%, and the business has become a better business. If Ashtead’s driver of growth can continue into the future—or even become stronger—then the prospects for Ashtead are good. Our unit economics analysis, RoIIC analysis, and management’s historical performance described above, suggest these trends are on track. The current CEO of Ashtead was the architect of clustering strategy in the US.
URI’s growth had been driven by earnings growth which has increased by 18% per year over the past 10 years. Its buybacks have added about 3% per year and its multiple has contracted about 1% per year. Its total return has been 23% per year over the past 10 years. Over this period of time, URI’s RoE has increased from 9% to 33%, and the business has become a better business. One uncertainty for URI is the extent of future acquisitions, since acquisitions have driven 50% of the growth.
In contrast, KT Corporation’s growth had been driven by dividends which have increased by 3% per year over the past 10 years. It has had no earnings growth, and its multiple has contracted about 3% per year. Its total return has been 0% per year over the past 10 years. Over this period of time, KT’s RoE has declined from 11% to 9%, and the business has had challenges growing. Currently, KT has a 6% dividend. KT’s EPS growth is estimated to be 2-3% per year higher based upon analysts’ estimates over the next few years. This growth rate, combined with the dividend, results in an 8% expected return absent any type of spinoff activity which could increase the value more substantially. Management has not discussed any plans for spinoffs despite the potential to increase value substantially. As a result of this type of analysis, we sold KT and purchased TerraVest, which has higher growth. Additionally, TerraVest’s value is not dependent upon a spinoff event, which KT Corporation management has not discussed.
Finally, we will examine dealerships using this type of framework. Four dealerships’ historical drivers of total return per year over the past 10 years are illustrated below.
| Growth Drivers |
| % Increase per year |
| Asbury Auto ( ABG ) |
| CarMax ( KMX ) |
| Lithia Motors ( LAD ) |
| Group 1 ( GPI ) |
| AutoNation ( AN ) |
| Earnings growth |
| 26.0% |
| 1.1% |
| 32.2% |
| 21.0% |
| 16.0% |
| Change in PE |
| -6.9% |
| -1.4% |
| -7.7% |
| -10.1% |
| -11.0% |
| Reduction in shares |
| 3.4% |
| 3.6% |
| -0.8% |
| 3.7% |
| 7.7% |
| Total Return |
| 19.0% |
| 5.0% |
| 19.5% |
| 12.5% |
| 10.5% |
Asbury and Lithia have the highest earnings growth driven by growth via consolidation. AutoNation has followed an organic growth and buyback strategy versus a consolidation strategy. Group 1 has followed a combination of consolidation and buybacks. All of the firms have had a reduction in PE over the last 10 years. The question is: will these historical trends continue? There is a large TAM for continued consolidation, and given the PEs (6-8x earnings) today, buybacks will be accretive to all of these firms. I think the historical trends are intact and will continue into the future; thus, I am bullish on growth for the consolidation-focused automobile dealers.
Conclusion
In order to provide more detail about a Bonhoeffer holding, a case study on TerraVest is included below. As always, if you would like to discuss any of the investment frameworks or investments in deeper detail, then please do not hesitate to reach out. Until next quarter, thank you for your confidence in our work.
Warm Regards,
Keith D. Smith, CFA
CASE STUDY
TERRAVEST INDUSTRIES ( TVK:CA )
TerraVest is a materials fabrication and service firm providing components and services for oil and gas extraction, transportation, distribution, and commercial and residential usage. TerraVest’s products support the transportation and storage requirements for oil, natural gas, LNG, and RNG across the US and Canada. TerraVest has three market segments as: 1) a manufacturer of tanks for residential oil and gas storage, furnaces, commercial oil, and water storage tanks and boilers, as well as vessels for liquid natural gas storage and truck transportation; 2) a manufacturer of natural gas wellhead processing, storage, and transportation equipment; and 3) an oil and natural gas services provider including fluid handling, water management, heating, rentals, and well servicing utilizing 21 servicing rigs. TerraVest is a collection of firms competing with smaller private businesses or divisions of large firms in niche markets described above. In each of its market niches, TerraVest is the number one or number two competitor. The common theme amongst these businesses is metal bending for high value-add applications.
Management strategically acquires businesses in direct negotiation with primarily family-owned sellers or out of distress for 4-5x cash flow. By the time the business is integrated, another turn of cash flow is realized from inherent synergies. In many instances, the families that own these businesses don’t have descendants who want to take them over. About 30% of the acquisitions have been purchased in distressed financial situations. The business acquisitions are financed primarily by debt which is paid down from cash flow generated from the acquired firms. Over the past seven years, management has acquired fourteen firms. The acquired firms have ranged in size from $10 to $100 million in revenues with a median revenue of about $25 million. The size of the firm targeted (median deal size is $15 million) is below the size of most private equity firms’ interest, so the competition is less than it would be for larger deals. TerraVest’s target acquisition markets include not only their core markets, but also firms in adjacent markets such as: green energy containment and transportation (RNG and hydrogen), chemical tanks, septic tanks, air filtration and purification, and other metal fabricating applications. One of the two members of the senior management team focuses on acquisitions.
TerraVest has four levers for cash flow growth: 1) buying a firm in their core or adjacent market; 2) expanding within existing markets; 3) paying down debt; and 4) distributing excess cash as dividends or buying back shares. The acquired firms generate cash flows in excess of what is needed to modestly grow the firm, which is used to purchase firms in its target or adjacent markets. If no firms can be found that meet management’s operational and valuation criteria, then management will buy back shares as the shares have typically traded at modest valuations reflecting organic growth but not the value of future acquisitions. Management is very selective in the firms they acquire. With a full pipeline of deal opportunities, management expects to spend 2/3 rd of its cash flow to either buy firms, pay down debt, or buy back shares. The remaining 1/3 rd will be invested in its current business, including growth opportunities which comprise about 2/3 rd of investments in the current business.
TerraVest’s predecessor was an income trust that went IPO for $24 million in Canada in 2004. TerraVest originally held two businesses—a wellhead processing equipment firm and an agricultural equipment firm. The latter was subsequently sold in 2011 for $15 million. From 2004 to 2005, TerraVest paid $88 million for firms that were subsequently sold in 2011 for $34 million. The poor decisions by previous management led to poor results, and TerraVest’s stock price declined from $15 to around $2 per share by 2011. Following Clarke’s 2010 investment, TerraVest changed management and identified core business areas (initially wellhead processing equipment and services) and divested non-core businesses. The non-core businesses generated $43 million in sale proceeds which were used to pay a special dividend, pay off debt, and repurchase 36% of TerraVest shares outstanding in 2012. In 2013, TerraVest merged with Granby to enter the fuel containment and HVAC equipment business. From 2012 to 2015, TerraVest purchased four more firms in its core markets of fuel containment and HVAC equipment and wellhead processing equipment.
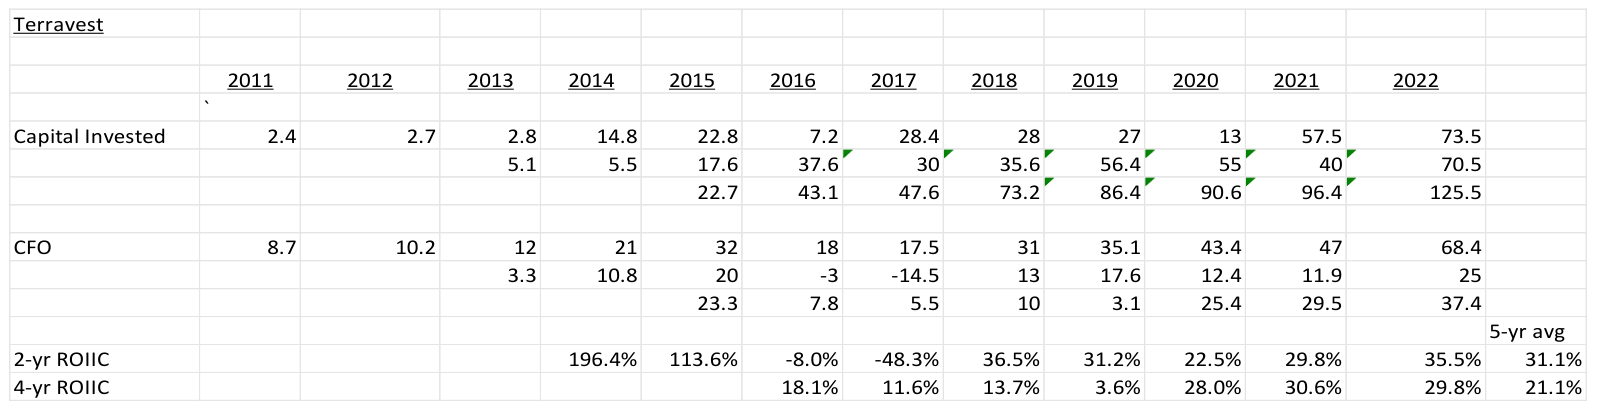
In 2013 and 2014, the current management team of Dustin Haw ( CEO ) and Mitchell Gilbert ( CIO ) joined TerraVest to continue its consolidation strategy of firms in its core markets. From 2016 to 2023, TerraVest purchased nine firms in its core fuel containment and HVAC and wellhead processing equipment markets. From 2013, the portion of TerraVest’s sales associated with cyclical oil and gas services declined from 45% in 2013 to 16% in 2022. These sales were replaced with more recurring sales associated with wellhead and transportation storage products, as well as HVAC equipment and compressed natural gas storage equipment. Most of the competitors in the target markets are smaller, privately held businesses. Mr. Gilbert is focused on acquisitions and has developed a network of private owners of core market firms as potential acquisition candidates. Given how central M&A is to TerraVest’s strategy, the focus of a senior executive is very important. The investment has paid off, as TerraVest has a robust pipeline of deals and can selectively choose the firms it acquires. Subsequent to Mr. Haw and Mr. Gilbert’s arrival, TerraVest has made eleven acquisitions in its core markets and increased CFO before working capital from $18 million to $68 million—a 25% CAGR. The average post-synergy price of these acquisitions has been 3.5x pre-tax free cash flow. [3] The resulting unlevered RoIIC (see calculation below) has been around 30%, which includes returns from both organic growth initiatives and acquisitions.
The business sectors in which TerraVest competes are subject to economies of scale from related products and have route density characteristics due to shipping costs. TerraVest’s recent acquisition of a trucking carrier should reduce the advantages local firms have in the sale of equipment in target markets.
Industry Segments
TerraVest competes in the HVAC equipment and fuel containment markets in Canada and in the Northeast and Great Lakes regions United States. These businesses have been purchased over the years by TerraVest’s management. The company is a market share leading participant in the residential and light commercial oil storage tank and dispenser market in both steel and fiberglass product lines. In addition, TerraVest provides bulk LPG transport trailers, LPG delivery trucks, and furnaces and boilers. Most commercial customers buy these products directly and generate repeat business over time. Residential customers purchase equipment through distributors. This market is a slow-growing GDP growth type of business. This is a fragmented market and competition is primarily from private businesses and divisions of larger companies. In 2023, TerraVest generated 56% of revenues in the fuel containment and HVAC equipment segments.
TerraVest also competes in the natural gas processing and the LPG and ammonia storage and transportation equipment markets. TerraVest provides: wellhead processing equipment and tanks; wellhead sanding units; central facilities processing equipment; NGL, LPG, and ammonia storage tanks; bulk NGL, LPG, CNG, and ammonia transport trailers; and customized processing equipment. Most of these products are made of subcomponents assembled into final products by TerraVest. This segment’s customers include upstream and midstream energy companies, fertilizer and propane distribution companies, and liquids transportation companies. Customers buy these products directly and generate repeat business over time. This is a fragmented market and competition is primarily from private businesses and divisions of larger companies. In 2023, TerraVest generated 28% of revenues in the processing equipment segment.
TerraVest also competes in the oil and gas services market. TerraVest services include fluid hauling, water management, environmental solutions, heating, rentals, and well servicing. TerraVest provides these services via 21 oil and gas servicing rigs located in Saskatchewan. In 2023, TerraVest generated 16% of revenues in the oil and gas services segment.
Sources of growth for TerraVest include organic and acquisition growth in the fuel containment and HVAC equipment and processing equipment segments. Organic growth in these segments is expected to be 2% annual growth rate [4] with any other growth coming from identified growth projects, acquisitions (the largest portion of growth historically), or share repurchases.
TerraVest operations have become better over time, as Dustin and Mitchell implemented a value-added acquisition strategy utilizing economies of scope and production density. The return on assets have increased from 11.7% in FY2013, to 13.4% in FY2023; and the return on equity increased from 14.3% in FY2013, to 27.0% in FY2023. The drivers included increases in net income margins from 6.4% in FY2013, to 7.1% in FY2023, and increases in fixed asset turnover from 3.1x in FY2013, to 3.5x in FY2023. Leverage also increased slightly from 2.2x, to 2.4x EBITDA.
The incremental return on invested capital over the past five years is close to 30%, which has increased TerraVest’s RoIC over the past five years. See the calculations below.
Downside Protection
TerraVest’s risks include both operational leverage and financial leverage. Operational leverage in the fuel containment and transportation equipment market is based upon the fixed vs. variable costs of the operations. There are some moderate economies of scope in terms of related product development and local economies of scale, as the business is primarily located in New England/Eastern Canada, the Great Lakes, and Western Canada. A recent acquisition in the South should expand TerraVest’s geographic footprint.
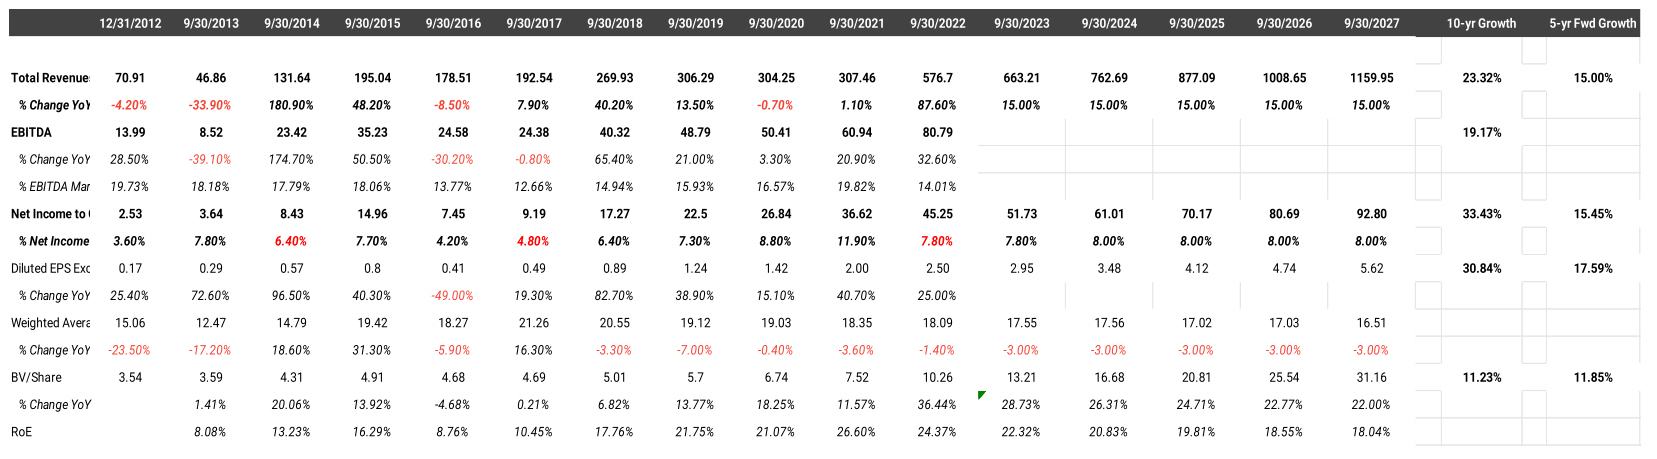
Financial leverage can be measured by the debt/EBITDA ratio. TerraVest has below-average net debt/EBITDA of 2.2 versus other metal fabricating industrials (like Trinity, Worthington, and Chart) and versus TerraVest’s history. The history and projected financial performance for TerraVest is illustrated below.
Management and Incentives
TerraVest’s management team has developed an M&A engine and operationally efficient firms in profitable niches of the material fabricating industry. They perform M&A when targets are available at the right price partially financed by debt, pay down debt, and return capital via buybacks when there are not opportunities to invest organically or via M&A.
The base compensation for the management team (top five officers) is roughly the same from C$270k to C$320k per year. The CEO and CIO have the highest total compensation, C$2.5 million collectively, primarily due to their option holdings. Over the past three years, their total compensation was about $600k per year, about 1.3% of net income per year. The CEO and CIO currently hold 1.09 million shares and options (worth C$6.8 million), which is more than 7.8 times their 2022 salaries and bonuses of C$867k. The CEO’s compensation is structured to include a C$270k base pay and up to a C$214k performance bonus. All of the senior executives’ base compensation was reduced by 20% for six months in 2020 due to the uncertainty of how the Coronavirus would affect operations. Non-options-based incentive compensation for the executive team is set and approved annually by the board of directors.
Board members have a significant investment in TerraVest. Charles Pellerin, who was the original activist from Clarke, owns 3.5 million shares, and the retired CEO, Dale Laniuk, owns 2.1 million shares. Option grants, provided to the CEO and CIO, were equal to 2% per year of the shares outstanding over the past three years.
Valuation
| Senstitivity Table |
| Price |
| Upside |
| Current Earnings |
| $2.95 |
| 7-year Expected EPS Growth Rate |
| 15.0% |
| 0.5% |
| $28.03 |
| 0.1% |
| Historical EPS Growth Rate |
| 35% |
| 5.0% |
| $54.58 |
| 94.9% |
| Current AAA Bond Rate |
| 4.3% |
| Growth Rate |
| 10.0% |
| $84.08 |
| 200.3% |
| Implied Graham Mutiplier * |
| 38.50 |
| 15.0% |
| $113.58 |
| 305.6% |
| Implied Value |
| $113.58 |
| 20.0% |
| $143.08 |
| 411.0% |
| Current Price |
| $28.00 |
| 25.0% |
| $172.58 |
| 516.3% |
| * (2*Growth Rate + 8.5) |
The key to the valuation of TerraVest is the expected growth rate. The current valuation implies an earnings/FCF increase of 0.5% in perpetuity using the Graham formula ((8.5 + 2g)). The historical 10year earnings growth has been 35% per year including acquisitions and the current return on equity of 24%.
A bottom-up analysis based upon market growth rates of TerraVest’s markets’ (HVAC and fuel equipment, gas processing equipment, and oil and gas services) results was used to estimate an organic growth rate of 2% for TerraVest. This is based upon the revenue growth assumption for the 2022 goodwill impairment and the historical five-year organic revenue growth rate of 3%. This does not include any future acquisitions. If we include 13% growth for acquisitions, then the base EPS growth rate is 15%. Historically, TerraVest’s EPS growth rate was 35% per year driven by 14 acquisitions over seven years. If we assume half of the number of acquisitions over the next seven years and a forward return on equity of high-teens to low-twenties, declining from the current rate of 24%, retaining 85% of earnings, then the incremental 13% growth per year is conservative. Using a 15% expected growth rate, the resulting current multiple is 39x of earnings, while TerraVest trades at an earnings multiple of 10x. If we look at metal bending comparables, which are larger but have slower growth prospects, they have an average earnings multiple of 16x. If we apply 16x earnings to TerraVest’s estimated FY2023 earnings of $3.04, then we arrive at a value of $49 per share, which is a reasonable short-term target. If we use a 15% seven-year growth rate, then we arrive at a value of $113.58 per share. This results in a five-year IRR of 32%.
Growth Framework
Another way to look at growth and the valuation of companies is to estimate the EPS five years into the future and see how much of today’s price incorporates this growth. Using the same revenue described above results in a 2027 EPS of $6.25, or 4.5x the current price. If we assume a steady-state growth rate from 2026 on of 7%, then this results in a fair value Graham multiple of 22.5x or $140.71 per share, similar to the five-year-forward valuation above of $113.58 per share.
Comparables and Benchmarking
Below are the fuel containment and storage and natural gas processing equipment firms located in the United States and Canada. Most of TerraVest’s competitors are private firms. Compared to these firms, TerraVest has debt on the low end of the range and has better growth prospects and a below-average multiple. TerraVest also has the highest RoEs and the highest five-year growth rates.
| TerraVest Comparable Firm Analysis |
| Price |
| Book Value |
| Earnings |
| FA Turns |
| EBITA Margin |
| 5-Yr EPS Growth |
| RoE |
| P/E |
| P/BV |
| EBITDA |
| Int Coverage |
| Chart Industries |
| 121 27 |
| 64.00 |
| 5.94 |
| 3.81 |
| 12.8% |
| 24.0% |
| 9.3% |
| 20.4 |
| 1 89 |
| 5.00 |
| 3 80 |
| Enerflex |
| 8.1 |
| 12.55 |
| 1.12 |
| 1.59 |
| 10.0% |
| 1.0% |
| 8.9% |
| 7.2 |
| 0.65 |
| 2.32 |
| 3 30 |
| TerraVest Industries |
| 28 |
| 10.26 |
| 2.59 |
| 3.80 |
| 11.7% |
| 35.0% |
| 25.2% |
| 10.8 |
| 2.73 |
| 2.57 |
| 6.67 |
| Trinity |
| 22.78 |
| 12.48 |
| 1.02 |
| 4.60 |
| 9.6% |
| 0.0% |
| 8.2% |
| 22.3 |
| 1 83 |
| 9.10 |
| 2 34 |
| Worthington Industries |
| 59.93 |
| 32.61 |
| 4.18 |
| 7.80 |
| 6.3% |
| 18.0% |
| 12.8% |
| 14.3 |
| 1 84 |
| 1.40 |
| 9.46 |
Risks
The primary risks are:
- slower-than-expected acquisition growth (currently projected to be 50% of the historic acquisition growth rate);
- lower-than-expected growth in TerraVest’s end markets of natural gas and oil processing, storage, and transportation and HVAC equipment replacement (currently projected to grow at 2% per year); and
- a lack of new investment opportunities (mergers and acquisitions) coupled with higher stock prices making buybacks less accretive.
Potential Upside/Catalyst
The primary catalysts are:
- higher-than-expected acquisition growth;
- faster growth in TerraVest’s end markets; and
- increased local scope or purchase of local scale in new markets.
Timeline/Investment Horizon
The short-term target is $49 per share, which is almost 75% above today’s stock price. If the continued acquisition/consolidation thesis plays out over the next five years (with a resulting 15% earnings per year growth rate), then a value of $125 (midpoint of the two methods described above) could be realized. This is a 35% IRR over the next five years.
Footnotes
[1] Case Study from Q12021 Bonhoeffer Fund Letter
[2] See The 3 Engines of Value , presentation given to NCSU on March 29, 2023, by John Huber, Saber Capital Management, LLC
[3] Based upon calculations from Guy Gottfried’s presentation given to Ivey School of Business, 2019
[4] Based upon management’s estimated long-term growth rate for annual impairment test
Disclaimer
This letter does not contain all the information that is material to a prospective investor in the Bonhoeffer Fund, L.P. (the “Fund”). Not an Offer: The information set forth in this letter is being made available to generally describe the philosophies of the Fund. The letter does not constitute an offer, solicitation or recommendation to sell or an offer to buy any securities, investment products or investment advisory services. Such an offer may only be made to accredited investors by means of delivery of a confidential private placement memorandum, or other similar materials that contain a description of material terms relating to such investment. The information published and the opinions expressed herein are provided for informational purposes only. No Advice: Nothing contained herein constitutes financial, legal, tax, or other advice. The Fund makes no representation that the information and opinions expressed herein are accurate, complete or current. The information contained herein is current as of the date hereof but may become outdated or change. Risks: An investment in the Fund is speculative due to a variety of risks and considerations as detailed in the Confidential Private Placement Memorandum of the Fund, and this letter is qualified in its entirety by the more complete information contained therein and in the related subscription materials. No Recommendation: The mention of or reference to specific companies, strategies or instruments in this letter should not be interpreted as a recommendation or opinion that you should make any purchase or sale or participate in any transaction.
Editor's Note: The summary bullets for this article were chosen by Seeking Alpha editors.
For further details see:
Bonhoeffer Capital Management Q1 2023 Letter