PSHZF - Bridging The Gap: Unlocking The Value Paradox Of Pershing Square
2024-01-08 05:12:25 ET
Summary
- Pershing Square is presently experiencing a remarkable 29% discount, trading well below its net asset value per share.
- This gap has even widened last year despite outperforming its benchmark index, the S&P 500 for the 13th time in 19 years.
- Pershing Square is in a comparable demand cycle to industry giants like Berkshire Hathaway and Blackstone.
- The closed-end fund structure paired with significant internal ownership promotes long-term investment incentivization.
Eight months have elapsed since my inaugural coverage of Pershing Square Holdings ( OTCPK:PSHZF ), where I initiated my coverage of the stock with a 'Strong Buy' rating. This article aims to revisit the trajectory of Pershing Square in the intervening period, examining any shifts in the fundamental premises underlying my initial investment thesis, and give an outlook on where I expect the stock to be heading in 2024.
In the time since my last report, Pershing Square has delivered a total return of 31.39%, markedly eclipsing the broader S&P 500's performance by nearly 200% (S&P 500: 12.11%). This noteworthy achievement extends beyond merely outpacing its benchmark; Pershing Square has also surpassed the performance of the top 100 closed-end funds and the broader market across the past two decades. Notwithstanding these achievements, there remains a pronounced discrepancy between the growth in its share price and the escalation in its net asset value ((NAV)), a topic I delved into in my preceding analysis, ' Unlocking the Value Paradox '.
Historical patterns suggest that the disparity between the NAV and market capitalization typically converges over time, aligning more closely with the company's intrinsic value. Recently, the gap between NAV and stock price has contracted, moving from a 35% to a 29% discount. This narrowing, in isolation, indicates a potential upside of 40.8%. Coupled with Pershing Square's proven track record of active asset management and consistent outperformance of the S&P 500 over the past two decades, this offers an attractive proposition for the long-term investor.
Company Overview
Since its establishment on January 1, 2004, Pershing Square Holdings, Ltd. has carved a niche for itself in the investment landscape, operating primarily as a holding entity with a keen focus on a select portfolio of 8-12 publicly traded companies. Structured as a closed-end fund, Pershing Square issued a limited number of shares at its inception, eschewing further capital infusion post its initial public offering. The fund's strategic decisions are under the astute guidance of founder Bill Ackman, backed by an adept team of eight investment professionals, noted for their stability and low turnover over the past half-decade.
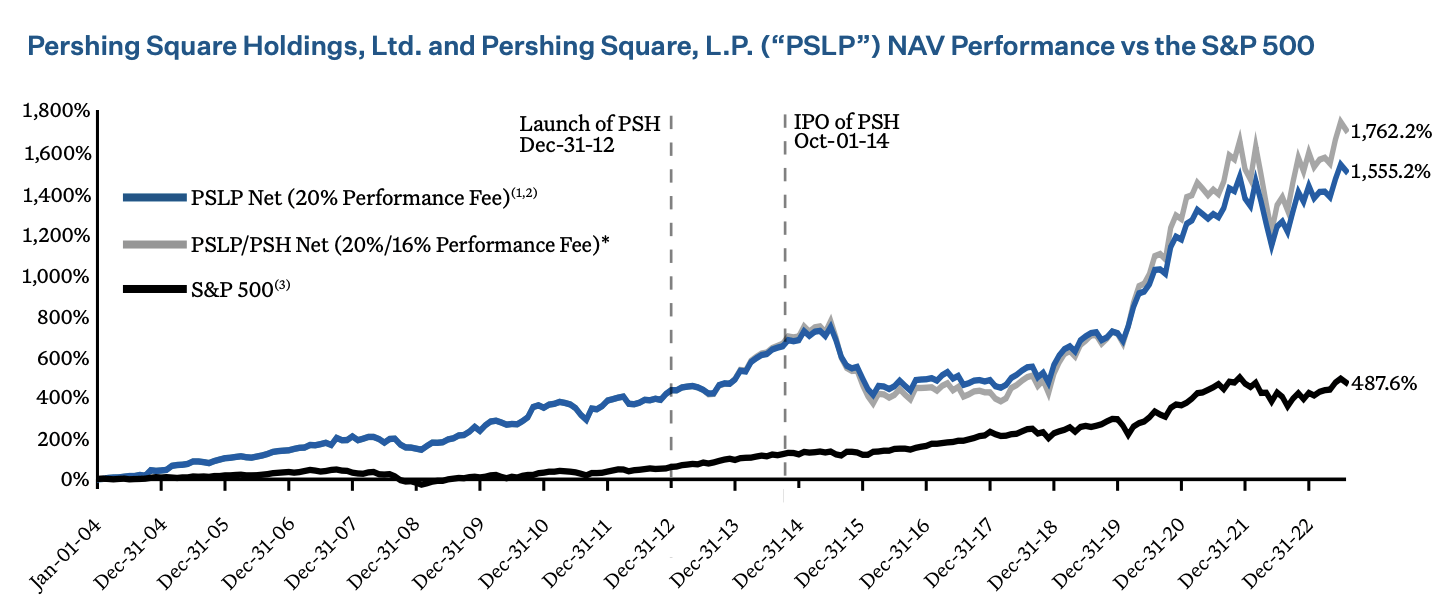
Pershing Square Holdings has consistently demonstrated its financial acumen, achieving an impressive 15.2% annualized net return since its foundation. This performance markedly surpasses that of the S&P 500, which has recorded a 9.7% return in the same period, underscoring the fund's superior investment strategy and execution.
Pershing Square Historic Performance (Pershing Square 2023 Semi-Annual Investor Letter)
Reasons for the disproportional NAV Discount
In his semi-annual letter to shareholders, Bill Ackman once again underscored the significant divergence between Pershing Square Holdings' stock price and its net asset value. On September 26, 2023, this disparity was particularly notable, with the NAV at $56.67 per share, significantly higher than the closing stock price of $36.40. This represents a notable 35% discount to the NAV, a situation where, theoretically, shareholders would stand to gain massively in a liquidation scenario, excluding transaction and liquidation costs.
The roots of this discount trace back to post-2015, following a phase where Pershing Square lagged behind the S&P 500 for three years, mainly driven by Ackman's 'Betting on Zero' Herbalife short-investment. Despite the company's remarkable reversal of fortune and consistent outperformance of the S&P 500 since 2017, the stock's discount to NAV has not only persisted but expanded. This is despite Pershing Square's diligent efforts, including achieving top rankings among large closed-ended equity funds, listings on the London Stock Exchange and FTSE 100, and a significant share buyback program.
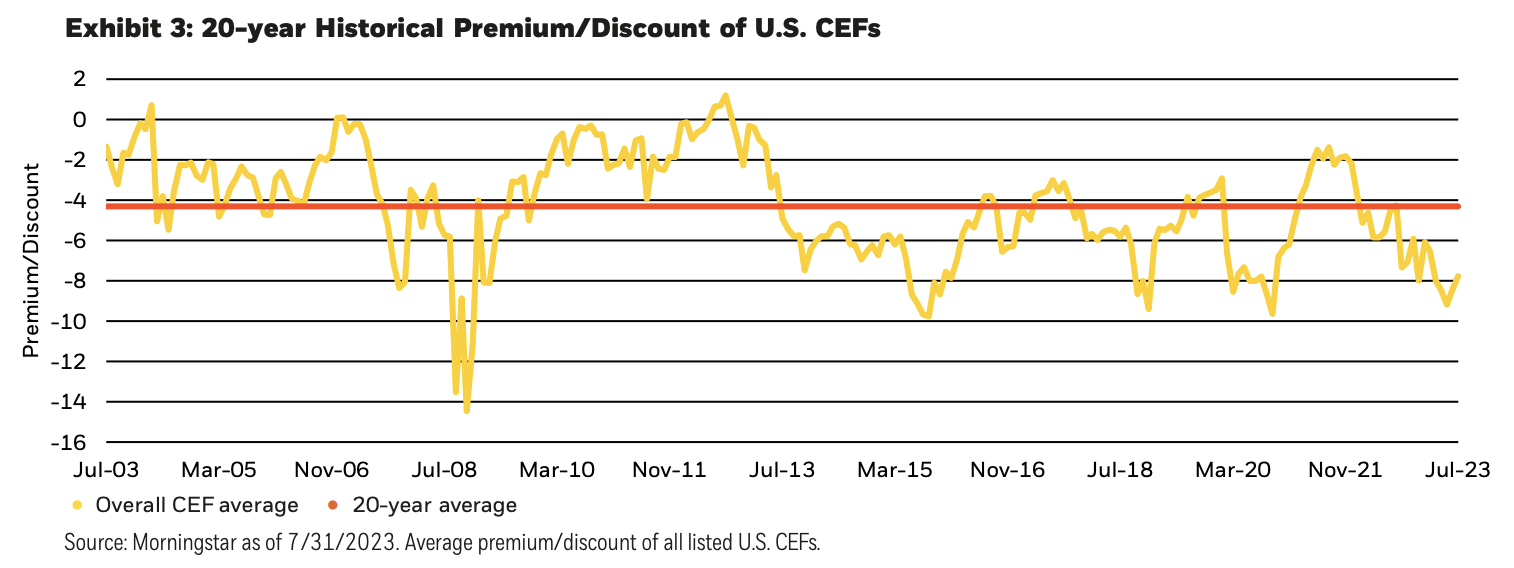
The fund's offshore closed-ended structure, while beneficial for tax purposes, might have played a role in limiting market accessibility, particularly in the U.S. This is contrasted with the broader industry trend, where similar funds have a median five-year discount of around 7.2% as reported by BlackRock, and the Scottish Mortgage Investment Trust trades at a modest 6% discount. However, BlackRock also reiterates the great opportunity that is provided by CEFs that trade at a significant discount, as it simply means buying assets below fair market prices.
Historical Disparity of CEFs (Blackrock Guide on Closed Ended Funds)
A novel perspective is offered by the mean reversion theory, as outlined by
Gujarati and Porter (2009) and applied to the discount disparity phenomenon by Erik Cederberg (2020) . This theory suggests that discounts of closed-ended funds tend to gravitate back toward their historical averages over time. For Pershing Square, this historical average discount is around 10%. If the discount realigns with this mean over time, it implies a semi-arbitrage opportunity of ~20%. The current gap between the stock price and NAV, when viewed through the lens of mean reversion, suggests potential for notable capital appreciation, presenting a compelling case for investment.
Bridging the Gap: Pershing Square's Approach to Aligning Market Price with NAV
Pershing Square Holdings' approach to addressing the significant discount in its stock price relative to the net asset value combines strategic marketing efforts with a robust share repurchase program. This approach, aimed at addressing the current demand shortfall, aligns with the interests of long-term investors, especially given the appealing 29% discount on net asset value. The company's commitment to this challenge is further underscored by the notable insider ownership, approximately 26%, which ranks PSH among the top in its category for closed-end entities. This high level of internal stake, primarily held by Bill Ackman and his team, demonstrates a deep alignment of their interests with those of the shareholders.
The situation with PSH echoes the historical narratives of companies like Berkshire Hathaway ( BRK.B ) and Blackstone ( BX ), which faced initial investor hesitation. For Berkshire Hathaway, early reluctance stemmed from investors' reluctance to relinquish investment allocation control. Over time, however, this hesitation diminished as Berkshire Hathaway demonstrated consistent outperformance and was eventually embraced by numerous prestigious funds and ETFs. Similarly, Blackstone initially struggled to attract investors, despite growing its assets under management, enhancing dividend payouts, and boosting revenues. The turning point for both firms was their ability to consistently deliver superior returns over an extended period, validating the sustainability of their business models.
In a similar vein, Pershing Square Holdings has a track record of delivering above-market returns. The company is positioned to reward patient investors when the market eventually recognizes and aligns with its actual value, reminiscent of the journeys of Berkshire Hathaway and Blackstone. The key lies in the sustained delivery of robust performance, which could eventually lead to a re-evaluation of PSH's market valuation, narrowing the current discount in its stock price.
Portfolio Update
In a recent portfolio update, Pershing Square Holdings has demonstrated strategic shifts in its investments, reflecting both increased stakes and some reductions across its diversified portfolio.
Notably, Alphabet Inc. ( GOOG ) has seen a significant increase in its portfolio share, now accounting for 17.21%. This investment was initially acquired in early March at prices around the low-90s and has since experienced further stake increases, most recently by about 20% at prices ranging from approximately $117 to $139. The current trading price of around $133 surpasses these acquisition ranges, indicating a positive trajectory.
In the case of Hilton Worldwide Holdings ( HLT ), which comprises about 15% of the portfolio, there's been a dynamic history of transactions. Initially established in October 2018, the position saw an increase in Q1 2020 and a substantial selling in Q1 2022. The most recent activity includes a trimming and a further increase in stake. Notably, Pershing Square's overall cost-basis for Hilton is around $72 per share, and they have expressed confidence in the company's capital-light business model post its structural transformation in 2017.
Howard Hughes ( HHH ) also represents a significant portion of the portfolio, approximately 12%, a position that originated from a spin-off in 2010. The majority of this stake comes from an addition in Q1 2020, with subsequent increases over the following quarters. The current price of the stock is $83.15, with recent regulatory filings indicating Pershing Square holds a substantial 38% of the business.
On the other hand, Lowe's Companies ( LOW ) has seen a slight reduction in its portfolio share, currently standing at around 14%. Originally established in Q2 2018, the stake in LOW has experienced several adjustments, including a notable increase in Q1 2020 and reductions in subsequent quarters. Pershing Square's cost-basis for Lowe's is approximately $85 per share.
These movements reflect Pershing Square's active management strategy and its ongoing efforts to optimize its investment portfolio in response to market conditions and company performance.
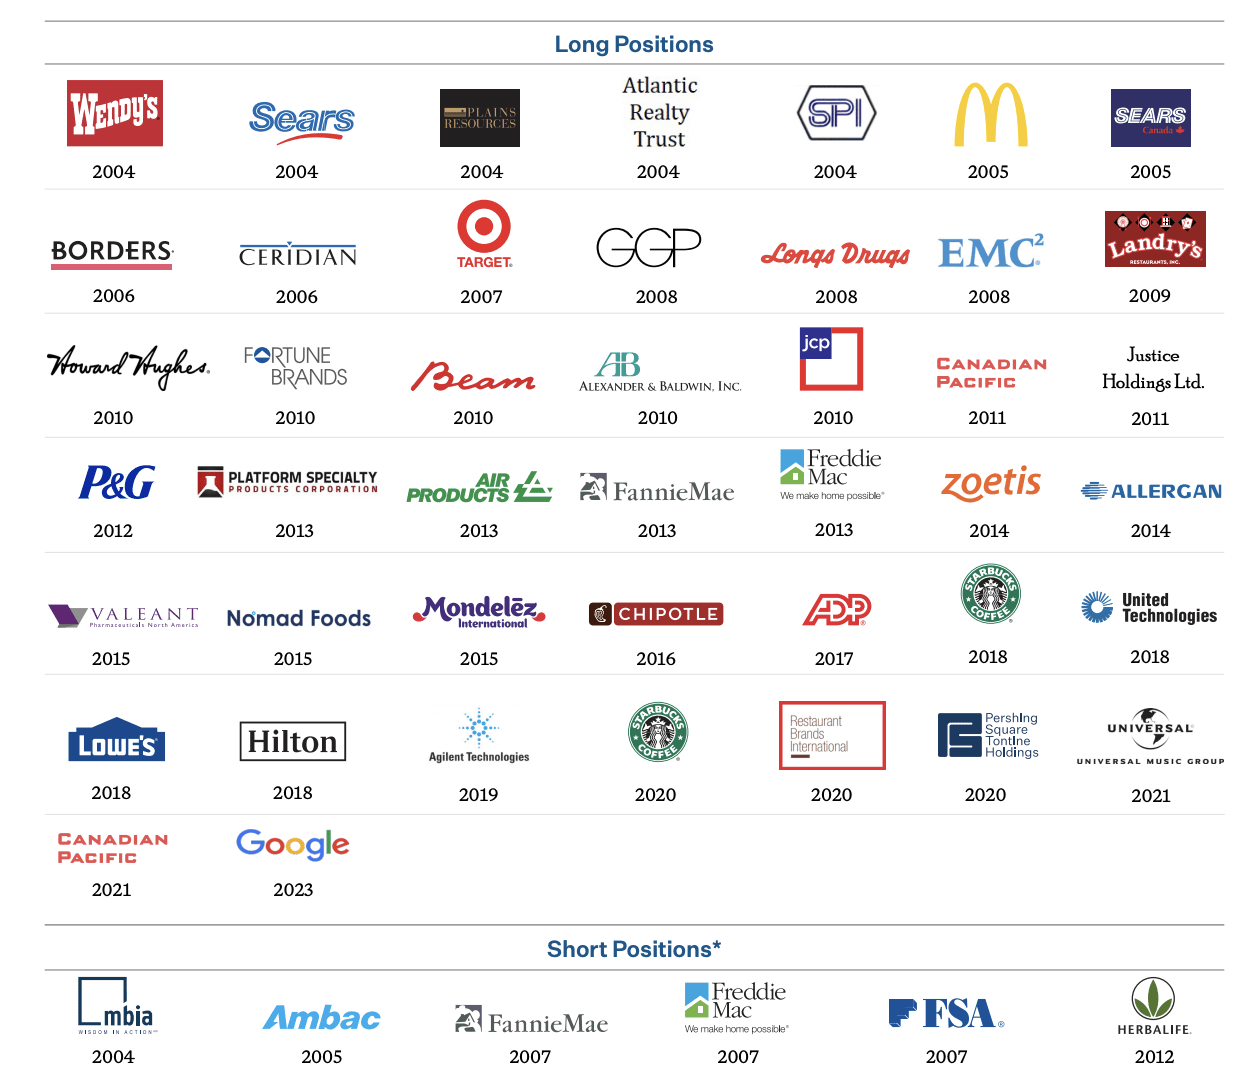
Pershing Square Portfolio Companies (Pershing Square Semi-Annual Shareholder Letter)
Risk Factors
The aforementioned historic performance and potential future reductions of NAV discount heavily rely on two crucial elements. Firstly, it presumes that the fund's performance is to continue at this or at least at a similar rate, an assumption that may prove fragile in the present market scenario, characterized by an uncertain interest environment, geopolitical conflicts, and persistent supply chain issues. However, it's worth noting that PSH tends to thrive amid market uncertainty. This was evident in its active hedging at the onset of the 2020 pandemic, culminating in a remarkable 56.6% return against the S&P 500's 18.4%. The fund also shielded its assets against surging inflation in late 2021, with the purchase of interest rate swaps. At this point, it is worth noting, that total hedges since 2020 the fund has generated more than $5.3 billion in total hedging proceeds from a cost of just $446 million, a staggering 1188% return.
The second factor significantly influencing PSH's share price rests on the company's potential to enhance fund promotion and consequently curtail the NAV discount. This gap while gradually narrowing in recent months - a positive sign, to be sure - has fluctuated a lot over the fund's lifetime.
Furthermore, the fund's concentrated portfolio approach of holding only 8-12 positions can lead to more significant price swings in response to single security performance. Lastly, the fund's ability to sustain its strategy under adverse market conditions and potential key-person risk linked to its founder, Bill Ackman, are additional factors to be taken into account.
Conclusion
In its recent performance analysis, Pershing Square Holdings emerges as a compelling, albeit complex, investment prospect. Its exceptional performance, surpassing that of the top 100 closed-end funds and the broader market, stands in stark contrast to the notable gap between its stock price and net asset value. This dichotomy has spurred a series of strategic initiatives by the company, including stock repurchases and intensified marketing endeavors.
Historical comparisons with entities like Berkshire Hathaway and Blackstone suggest the possibility of narrowing this valuation gap over time. This is particularly likely if Pershing Square maintains its trajectory of delivering above-average returns. However, investors must remain cognizant of inherent risks such as market fluctuations, geopolitical upheavals, and regulatory shifts.
Looking ahead, Pershing Square's prospects appear robust over the long term, especially considering the current 29% discount on its assets. I reiterate my rating for the stock as 'Strong Buy'. Should the firm effectively harmonize its intrinsic value with its market valuation, investors could potentially realize substantial gains, mirroring the successes of other market titans. In these volatile times, a cautious and vigilant approach is advisable, necessitating continuous monitoring of both market dynamics and the company's strategic responses.
For further details see:
Bridging The Gap: Unlocking The Value Paradox Of Pershing Square