NTSI - Building A Better Portfolio With Capital Efficient Funds Responsible Leverage And Alternatives
2023-12-12 16:36:08 ET
Summary
- Using capital efficient funds available to retail traders now, we can create a balanced portfolio using responsible leverage.
- "Responsible leverage" refers to the process of using leverage to obtain exposure to various uncorrelated assets.
- The proposed portfolio has a notional exposure of 180%, but limits risk across the various components by diversifying across managers, strategies, and assets.
- Many of the funds in the portfolio use capital efficiency to magnify the returns, or overlay the returns of several assets.
Introduction
During my work as a financial adviser, I have run across hundreds of model portfolios from dozens of firms. I've used them with dozens of clients. I was never really satisfied with the end results, but didn't have much better to offer them.
This is the second model I am writing about. The other that I published is the 8%-Yielding Fixed Income Portfolio , so I recommend you check that out.
Let's get down to business.
Capital Efficiency
In my search for the "perfect model portfolio," I've been looking for funds that I can use to optimize my exposure to certain assets and factors. One of the most useful tools retail investors are increasingly being given access to are capital efficient derivatives purchased through mutual funds and ETFs.
Capital efficiency refers to the investment strategies of using leverage to obtain exposure to multiple assets or to magnify exposure to a single asset. Leverage is typically obtained through the use of derivatives like options and futures.
There is a cost associated with obtaining this leverage, which is called "carry," and refers to the various transaction costs behind derivatives trading. It can be seen as "interest" charged by the sellers of these derivatives for the leverage we obtain.
The hope behind these strategies is that the exposure obtained by the leverage provides higher returns than the cost of our carry. If we're right, we get to keep the difference.
Using these strategies, the goal is to achieve more than 100% exposure in a portfolio.
Example:
In a portfolio of $100,000 in starting capital, we want exposure to both the S&P 500 and US T-Bills. We want at least 75% exposure to the S&P 500 and as much exposure to T-Bills as possible.
If we were to use traditional methods, we would buy $75,000 of SPY (we get 162 and some change) and put the rest, $25,000, in T-Bills. Our resulting portfolio is a 75/25 allocation and is considered moderate.
We can do better. Let's introduce options.
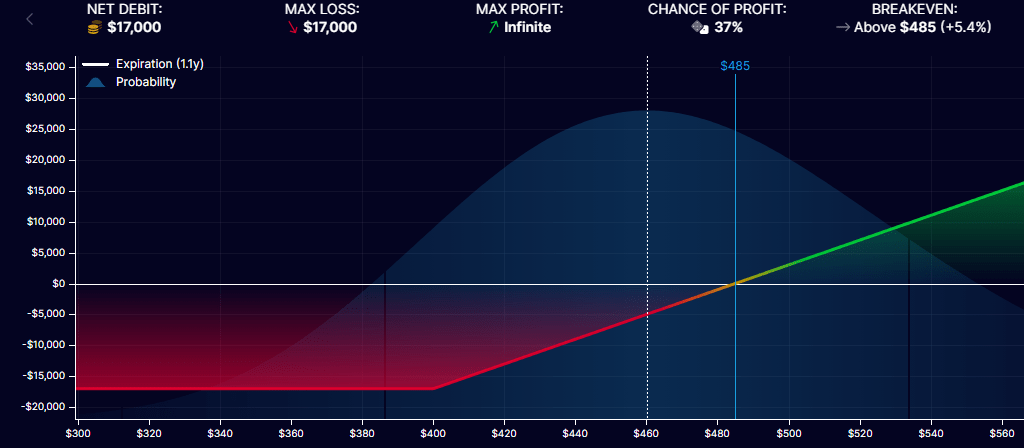
To start, we buy a long-dated call option on the SPDR S&P 500 ETF ( SPY ).
The January 2025 400C had its last mid-price at around $8,500, so we're going to assume that is our cost-basis.
We spend $17,000 on 2 January 2025 400C.
This position gives us a Delta of 189 currently, which means that we have a notional exposure in the position of $75,600.
For those that don't "speak Greek," Delta refers to an option's exposure to shares of the underlying asset. In this case, we are exposed to the value of 189 shares of SPY. If we multiply that by the price of our shares, we get our "notional exposure," or how exposed we are through the leverage.
To recap , we are able to use $17,000 of our $100,000 account to buy x2 Jan 2025 400C, which gives us a notional exposure of $75,600.
We used 17% of our capital and now have 75.6% exposure to the S&P 500 index.
The rest of our capital can be set aside and invested in those aforementioned T-Bills. These are currently yielding 5.3% and are nothing to sneeze at! Last week, I covered a T-Bill fund I recommend here .
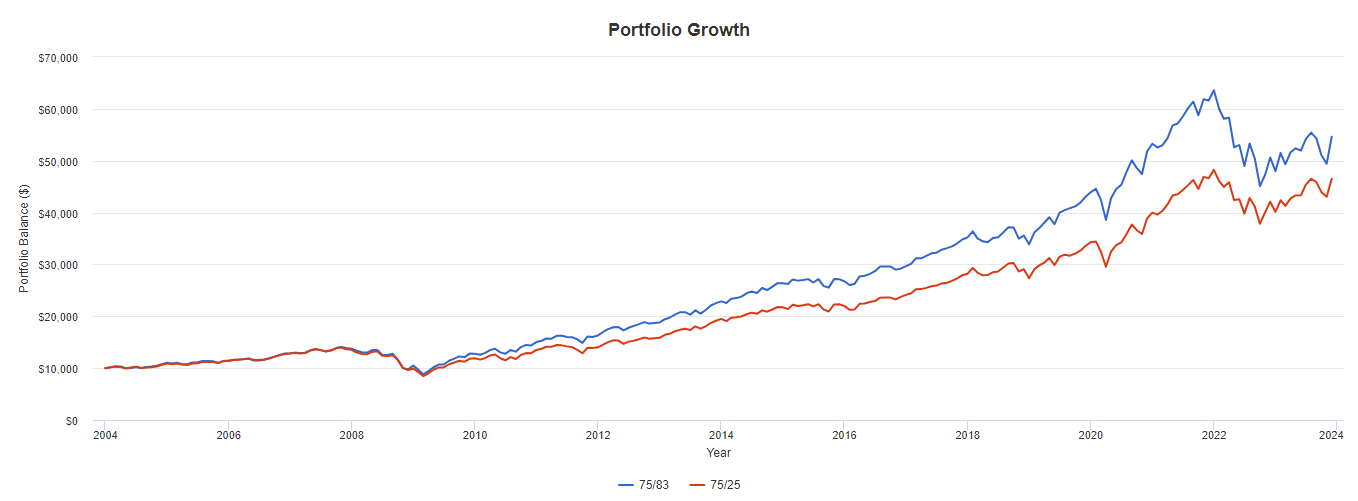
In total, this $100,000 portfolio will have two positions: call options and T-Bills. Its capital (the actual money invested) will be split 17/83 between them respectively. However, our notional exposure will be 75.6/83. This gives our portfolio a total exposure of 158.6%. Using this strategy, we have given ourselves access to an extra 58% of capital.
Without the call options used for leverage, we would only be able to achieve a 25% allocation to bonds. It could make a huge difference in performance over time.
Figure 3 (PortfolioVisualizer)
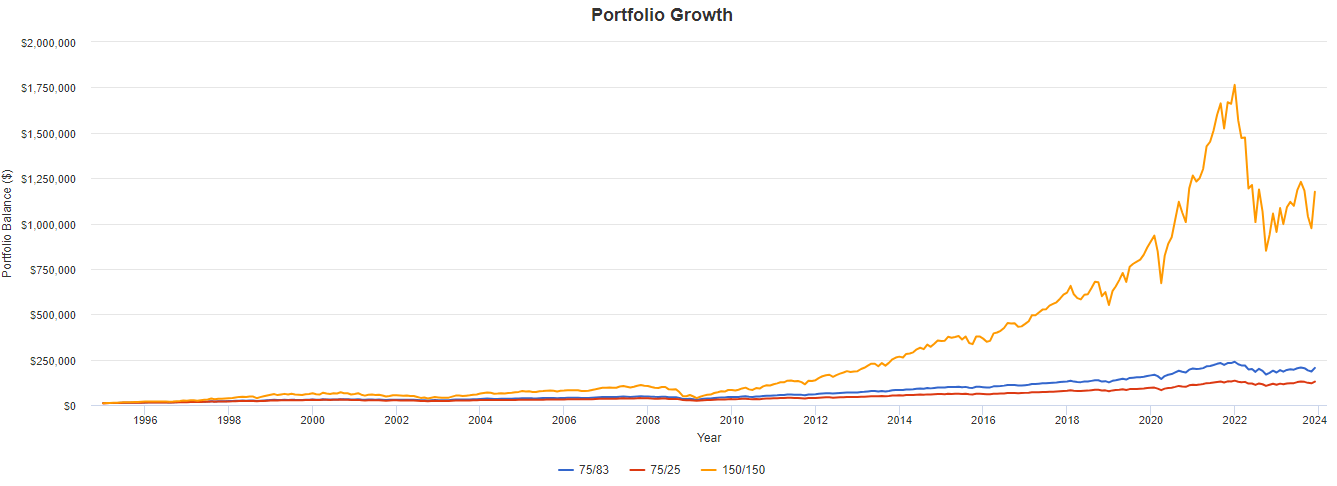
In more risky allocations, where we really ratchet up the exposure, we can achieve fascinating results. Here is 150/150 against our two previous examples.
Figure 4 (PortfolioVisualizer)
Responsible Use
The portfolio I'm presenting here is using funds that employ responsible leverage to overlap exposure to uncorrelated (or at least historically uncorrelated) assets.
Using leverage to gain exposure to beyond 100% of our capital introduces risk to the portfolio, but spreading that exposure across a variety of assets reduces our concentration risk.
By using capital efficient strategies to gain exposure to core holdings like stocks and bonds, we can use extra funds to allocate to alternative strategies that diversify the portfolio's return profile by adding in uncorrelated sources of premia like style investing, quant strategies, trend-following, and more.
Goals
This portfolio has three major goals:
- Positive absolute returns over a full market cycle
- Mild correlation to equity markets
- Obtain leverage through the (indirect) use of futures, total return swaps, and credit default swaps without using funds that reset daily to avoid excess transaction costs
Please note several things that I have chosen not to consider for this model:
- Single issuer risk such as small ETF operators that may go defunct
- Liquidity risk such as low AUM funds making it difficult for large investors
- Fund access such as funds that have minimum investment requirements, though I did not use anything above $10,000
- Transaction costs associated with purchasing some mutual funds, which may or may not present with sales charges or load fees depending on your individual broker
The "CapEff Portfolio"
Note, the data used in this article primarily comes from a backtest found on Portfolio Visualizer. Feel free to use that to play around with the portfolio as well.
I'm running a $100,000 paper portfolio of this set-up for myself, but I've made it viewable by the public.
| Ticker |
| Name |
| Allocation |
| Volatility |
| NTSX |
| WisdomTree US Efficient Core Fund |
| 15% |
| 22.16% |
| NTSE |
| WisdomTree Emerging Markets Efficient Core Fund |
| 10% |
| 20.94% |
| NTSI |
| WisdomTree International Efficient Core Fund |
| 5% |
| 21.33% |
| DSENX |
| DoubleLine Shiller Enhanced CAPE Fund |
| 12% |
| 19.01% |
| DLEUX |
| DoubleLine Shiller Enhanced International CAPE Fund |
| 8% |
| 21.27% |
| QIS |
| Simplify Multi-QIS Alternative ETF |
| 10% |
| 4.67% |
| EQLS |
| Simplify Market Neutral Equity Long Short ETF |
| 5% |
| 12.56% |
| FTLS |
| First Trust Long/Short Equity ETF |
| 5% |
| 7.59% |
| MBXAX |
| Catalyst/Millburn Hedge Strategy Fund |
| 7.5% |
| 9.49% |
| ATRFX |
| Catalyst Systematic Alpha Fund |
| 2.5% |
| 15.44% |
| FSMMX |
| FS Multi-Strategy Alternatives Fund |
| 7.5% |
| 1% |
| KMLM |
| KFA Mount Lucas Managed Futures Index Strategy ETF |
| 12.5% |
| 14.14% |
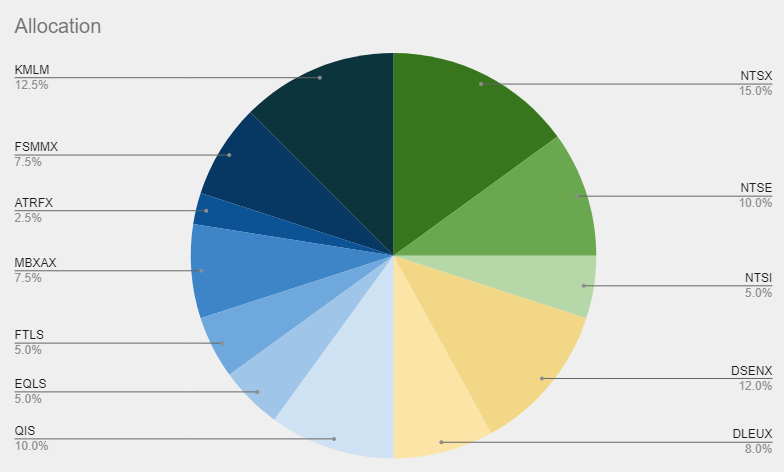
I have ordered the funds thematically by their strategy and color-coded them in the above chart. Green is our "core," yellow is our "value sleeve," and blue is our "alternative sleeve."
There are three primary strategies employed by this portfolio to gain various asset exposures.
- Capital Efficient Core (30% capital, 45% notional exposure)
- Value Sleeve (20% capital, 40% notional exposure)
- Alternatives Sleeve (50% capital, 105.5% notional exposure)
| US Stocks: 28.5% |
| US Bonds: 30% |
| Quant Strats: 20% |
| Ex-US Stocks: 21.5% |
| Ex-US Bonds: 8% |
| Systematic: 20% |
| Managed Futures: 42.5% |
| US T-Bills: 15% |
| Total: 185.5% |
Capital Efficient Core — ( NTSX ), ( NTSI ), & ( NTSE )
The first three funds are our efficient exposure to global stocks and bonds. The NTS family funds are "90/60 funds," meaning they offer 90% exposure to the total stock market of a given region and 60% exposure to the 10yr US Treasury Bond, achieved via futures.
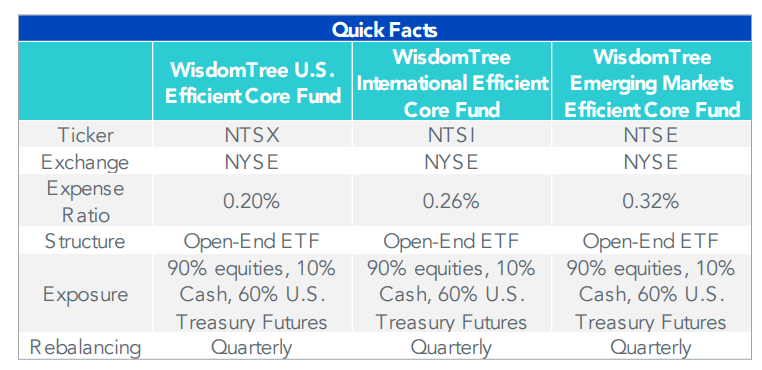
This core allocation uses 30% of our capital and provides us with a notional exposure of 27% to global stocks held at market weight and 18% to US Treasuries.
There is surprisingly little to say here, as this is a "pure beta" play, meaning that we are just seeking to replicate a global index of stocks and aren't doing any fancy weighting. That comes later.
Because it is a leveraged position, we would consider these three holdings to have a 45% weight in our portfolio. If you want to backtest this position, you would weight it as 90% VT, 60% BNDW as the closest approximation. I use the Vanguard Balanced Index Fund ( VBIAX ) as a benchmark because it is a traditional 60/40 portfolio of stocks and bonds.
I also like to use the iShares Allocation collection ETFs, ( AOA ), ( AOM ), ( AOK ) and ( AOR ). These allow us to very easily see how our funds have done against different asset allocations.
Value Investment Sleeve — ( DSENX / DSEEX ) & ( DLEUX/ DSEUX )
These two sister funds make up our value investment sleeve. These funds do two things that make them remarkably unique and interesting.
The first is that they use total return swaps to give investors exposure to stocks and bonds at a 1:1 ratio. As shown below, investors will be given access to an actively managed bond portfolio and have the value rotation strategy overlayed on top of its returns.
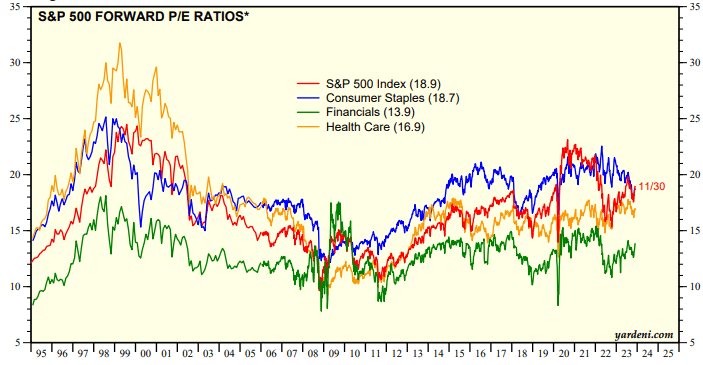
In an era where fixed income portfolios can yield 8% or more, like we find ourselves in now, this fund has become very enticing. DSENX/DLEUX are far more attractive now than when rates were held to zero and may not be attractive if real rates return to zero or become negative in the future.
Figure 8 (DoubleLine)
DoubleLine's managers coordinate the equity exposure by ranking sectors based on their value and momentum scores and weighting them accordingly. Every quarter, the fund rebalances into the four most undervalued sectors. This will allow us to be in the deepest "value" position during all economic cycles as the rotation will adjust as markets shift.
Figure 9 (DoubleLine)
As sectors move in and out of favor with investors, the strategy adjusts. This will allow us to have dynamic exposure to the value factor. Using a momentum screener allows for the removal of "value trap" sectors from the index.
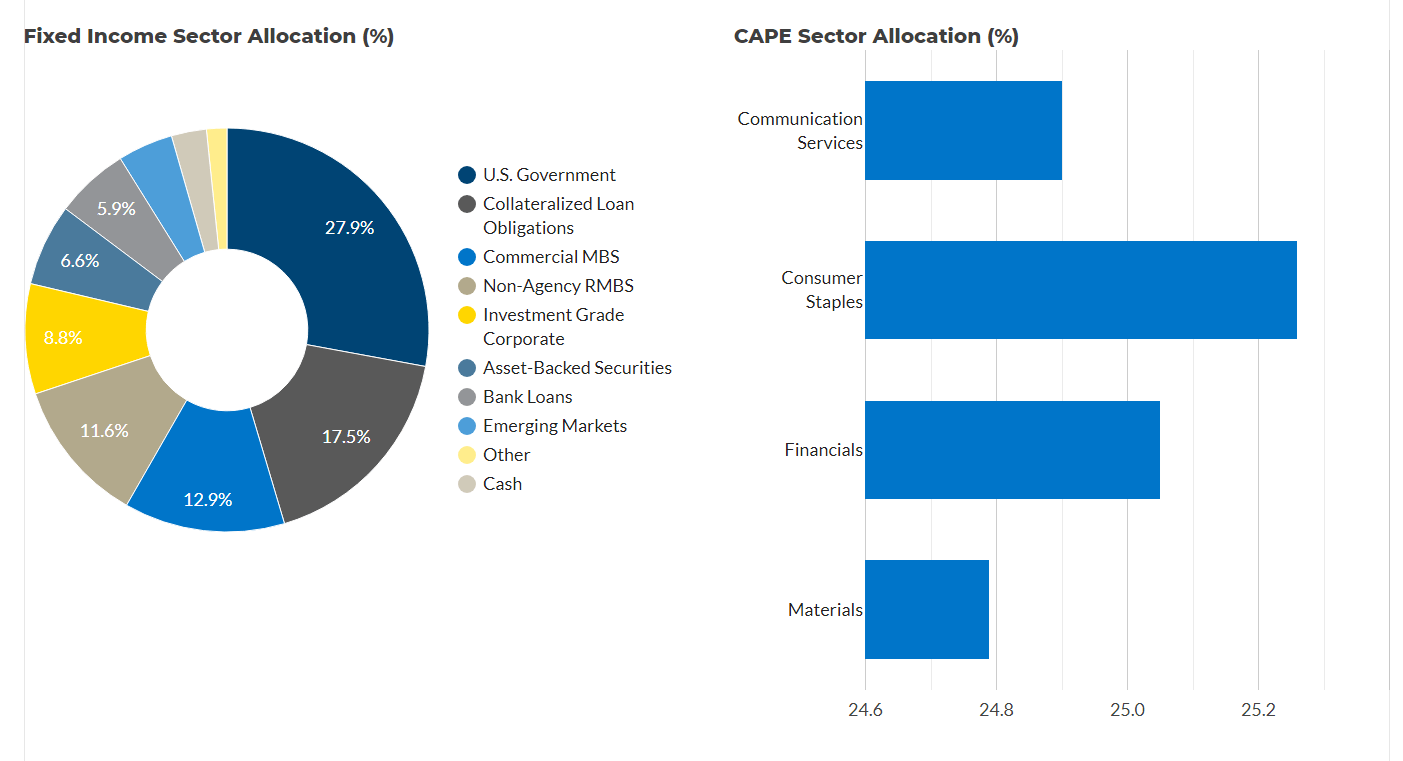
These two funds, split between the US and ex-US exposure, uses 20% of our capital and provides 40% of notional exposure, since each gives us access to 20% exposure to bonds and 20% exposure to their respective index.
These funds bring some volatility, especially in years like 2022 where both stocks and bonds lost, but can provide access to defensive equities that dynamically adjust to market cycles. This kind of tool can help navigate flat markets where undervalued, quality companies shine. These funds also pay fairly hefty dividends since they usually hold stocks that pay dividends on top of the bond portfolio.
Currently, DSENX/DSEEX, the US fund, is holding Communication Services, Consumer Staples, Financials, and Materials. This may change as we get into the next quarter and a re-balancing event happens.
The beauty of the US and ex-US funds being separate is that it allows us to rotate into and out of different sectors in each region.
Unlike in the US, where tech is the most overvalued sector in the market by earnings, the ex-US fund DLEUX/DSEUX holds the ex-US Information Technology sector as its second-largest holding.
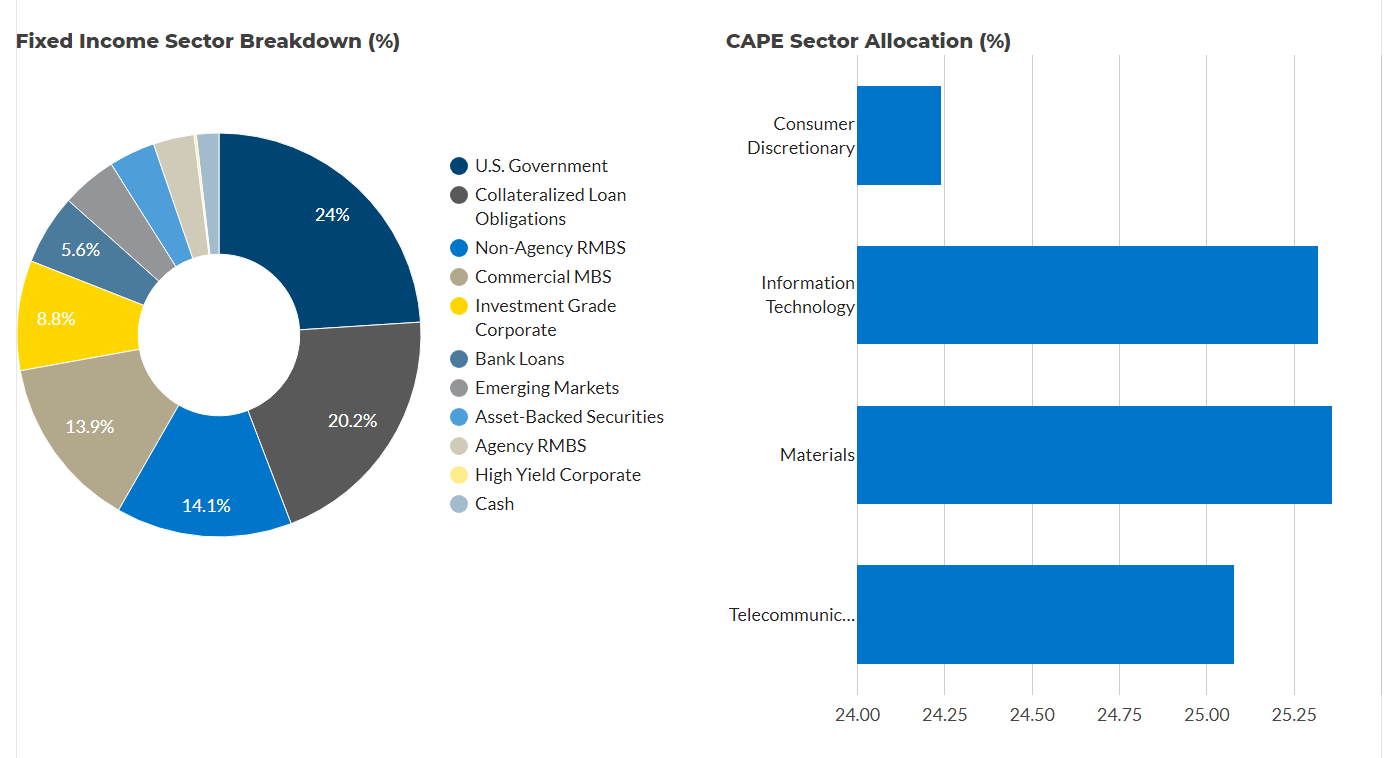
So far, they have had mixed results in 2023, but overall are performing well.
Alternatives Sleeve —( QIS ), ( EQLS ), ( FTLS ), ( MBXAX ), ( ATRFX ), ( FSMMX ), & ( KMLM )
Here's where we get weird.
These strategies are mostly uncorrelated with traditional markets and are seeking absolute returns in all environments. This sleeve is heavily allocated to actively managed strategies seeking to exploit established and studied risk premia. Because of this, we will seek to mitigate a few risks:
1) Manager risk, by having all of our actively managed component held by a single or very few managers, we risk them being "unlucky" or performing poorly. We mitigate this by holding the same strategy across multiple funds. In the alternatives space, there is a great amount of variance between QIS funds. Accessing this diversity will ensure that we spread out this idiosyncratic risk.
2) Concentration risk, by having too many of our strategies be focused on the same asset, factor, or other quantitative signal, we risk the underperformance of that "edge." We mitigate this by gaining exposure to a variety of proprietary and non-proprietary strategies by using multiple quantitative investment strategy ("QIS") funds.
Our exposure to alternative strategies ensures that this sleeve will provide a counterbalance to the beta and volatility taken on with the core stock/bond portfolio and the value investment sleeve. Spreading across several strategies including long/short trading, leveraged futures positions, and quantitative investment strategies, the alternatives sleeve of this portfolio should serve as the counter-balance that bonds alone have not been offering investors in the last decade.
Each of these funds deserves their own extensive analysis, and this article is not going to be long enough to do all of them justice (it's already too long!), but I will do my best to provide an overview of the strategy, why I picked it, and what it offers us.
Simplify Multi-QIS ETF ( QIS )
I've written about QIS before in a detailed article here , which I recommend checking out. I remain the only analyst on Seeking Alpha to cover QIS with any primary or secondary analysis. It blows my mind!
Essentially, the fund has 100% of its capital deployed into T-Bills. It then uses those bills to secure total return swaps on 10-20 quantitative investment strategies. These are algorithmic or computer-driven trading systems that seek to capitalize on mispricing, arbitrage, or other opportunities in the market to be a "middle man" and collect transaction costs and slippage. They may also take directional positions that offer some kind of carry, like what I mentioned in the beginning of the article.
QIS is unique in that it trades return swaps on live quant strategies. It is not trying to replicate their positions in an ETF wrapper. This means that QIS investors will get the actual return of these live algorithms as they trade on the stock market.
I picked a 10% allocation to QIS in order to add negative beta to the portfolio, as well as introduce an uncorrelated asset to the mix. This will balance the fund out during drawdowns and provide absolute returns in most environments.
It is intended to be a capital efficient instrument, and the use of swaps allows us to get access to 20% notional exposure. We get access to 10% exposure to T-Bills and 10% to quant strategies.
Simplify Market Neutral Equity Long/Short ETF ( EQLS )
This is a fund that needs a primary analysis done of it for Seeking Alpha, as there are none currently. I hope I can find time to do a longer, more in-depth look at this fund in the future.
EQLS is an ETF that does two things:
The first is that management uses quantitative modeling to build two pools of equities, one with positive characteristics, and one with negative characteristics. Then, the managers buy return swaps by going long the quality equities and short the low-quality equities.
The second is that it uses swaps to magnify exposure to about 400% on average. That exposure is dynamic and can be adjusted as needed (it is currently closer to 200%). Typically, exposure to 200% long and 200% short is expected.
Because the fund is long and short by the same amount of exposure, this neutralizes "beta," or the shared movement of stocks due to the broader market moving. By neutralizing beta, we isolate the positive factors and amplify their returns by shorting the negative factors.
I picked this fund because it provides us access to equity risk without taking on market risk. It also allows us to get magnified exposure to these factors for very little of our capital, because of how the fund is built.
Here is the breakdown of the current machine learning model's long/short positions.
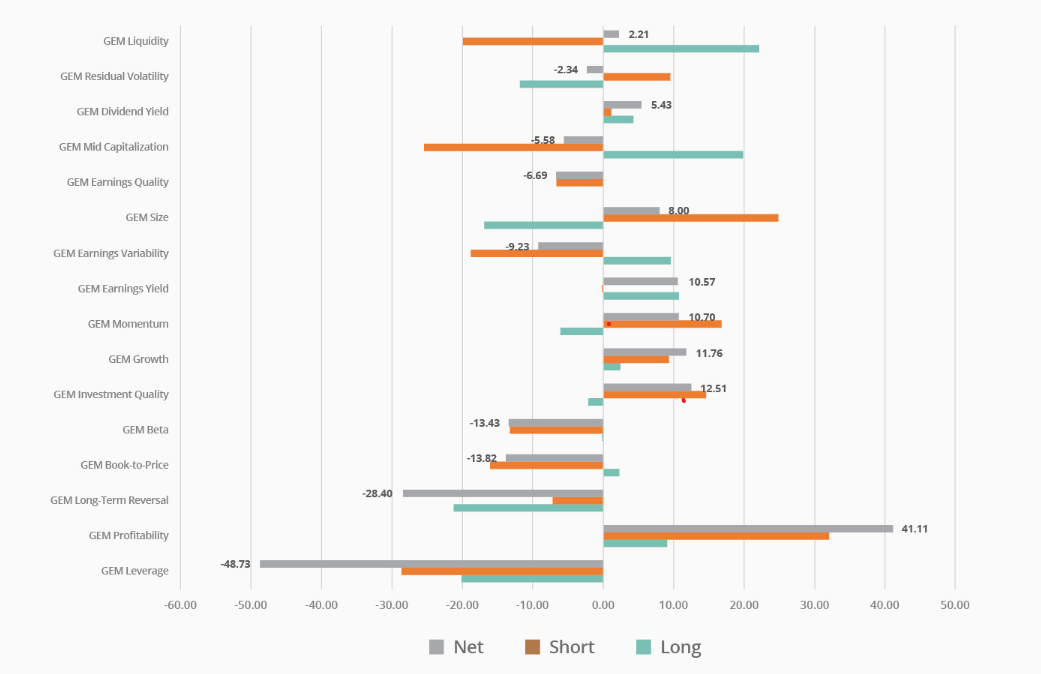
The most directional positions are going long profitability and short leverage. This kind of factor investing, without market risk, can provide returns driven by equities but not correlated with equities.
EQLS gives us exposure to 5% T-Bills and 10-20% dynamic exposure to Long/Short Strategies.
First Trust Long/Short Equity ETF ( FTLS )
This was included as a secondary long/short fund to cut down on manager risk and to diversify the factors we are going long/short on.
The primary difference is that FTLS directly owns and shorts equities itself, so we only get access to 5% exposure to the strategy. This limits our total exposure to the Long/Short strategy to 25% when EQLS is fully leveraged, which was necessary for risk management. In a perfect world, I would like 10% allocated to this, like if I had 105% to allocate.
The secondary differences that are important to note is that FTLS can include a bias and end up net long on occasions, typically about 60% and aims to achieve similar returns to US equities with less volatility.
Figure 17 (First Trust)
The selection criteria of the fund is different from EQLS' and this leads to different factors being isolated, as FTLS uses a proprietary, mixed quantitative and qualitative "forensic accounting" methodology to weight its long and short positions.
This adds 5% exposure to Long/Short strategies and further diversifies our management pool and factor exposure.
Catalyst/Millburn Hedge Strategy Fund ( MBXAX / MBXIX )
An older "hedge strategy" fund, Catalyst/Millburn has an impressive track record with their uncorrelated returns exceeding the market's.
This fund allocates across several strategies, including an active long/short strategy, trend-following managed futures, and strategic equity exposure. Millburn is unusual as a quantitative manager because of their inclusion of "non-price data," where they factor in large amounts of real-world data into their pricing models to find and exploit market trends.
The fund itself is levered to about 1.2 and is 40% US stocks and 80% trend following managed futures. While it holds a long directional bias, that has proven to be an edge for MBXIX in its history. This does mean that we need to limit our exposure to it if we're worried about being overexposed to US stocks.
I picked this fund because of its manager's track record and history. This will be a good diversifying component to our alternatives sleeve as it dilutes our manager risk in the actively managed components, with more proprietary factors identified by Millburn.
For our 7.5% invested, we have exposure to 3% US stocks and 6% managed futures.
Catalyst Systematic Alpha Fund ( ATRFX / ATRAX )
This fund is very similar to QIS in its use of quantitative models to invest across a broad basket of strategies, including carry, volatility, momentum, and liquidity. The fund uses a systematic approach to its investments, meaning that all decisions are made using quantitative data fed into a model.
This kind of quant strategy is compelling because it is trying to isolate just the "alpha" or excess returns of a market and not take on any of the typical risk/reward return profile or "beta."
These strategies provide absolute returns in many different kinds of macroeconomic environments and are very adaptive to market trends shifting.
Here are examples of the kinds of components that make up ATRFX's index.
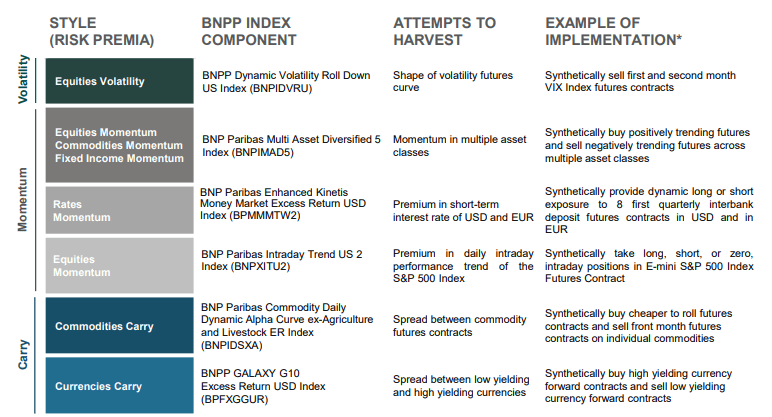
The fund is volatile and is kept to a small amount of the portfolio, but can really shine during unexpected times due to its uncorrelated nature. While not leveraged, the fund is fairly aggressive.
This 2.5% of our portfolio gives us 2.5% exposure to quant strategies.
FS Multi-Strategy Alternatives Fund ( FSMMX / FSMSX )
To further solidify our diversity of managers, we add FSMMX, a fund-of-funds of QIS hedge funds and in-house strategies. This fund is much more conservative than our other QIS funds.
Having a breadth of managers is designed to reduce the risk that all of the alternatives funds move together in a crash or black swan.
This fund has done very well with those kinds of events in the past and FS are quick to market it.
Figure 22 (FS Investment Solutions)
FS allocates across both their own direct strategies and with several hedge funds, named below. Here is a timeline (histograph? histochart? Let me know in the comments if you know) of their asset allocation changes in the fund.
Figure 23 (FS Investment Solutions)
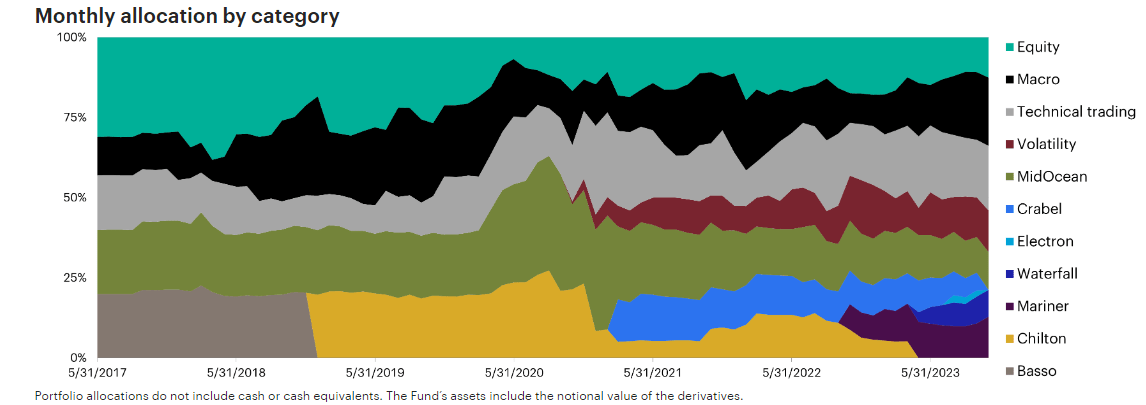
Notice the change of strategies in 2020-21, primarily the inclusion of these new hedge funds, which correspond to the change in return pattern in the chart below. The inclusion of Crabel, the in-house volatility strategy, Mariner, and Waterfall have proven to be great things for FSMMX.
This 7.5% of our portfolio gets us exposure to 7.5% quant strategies, with no real capital efficiency as they invest directly in their assets.
KFA Mount Lucas Index Strategy ETF ( KMLM )
KMLM is our more direct managed futures play, since it uses trend-following signals to trade its assets. This will capitalize on price dislocations in various markets by focusing on momentum and technical indicators to make trades.
The use of futures to take positions in most of the fund's assets allows KMLM to take on a lot of leverage. KMLM primarily invests in three markets, to each of which the ETF gives 70-130% notional exposure: commodities, currencies, and bonds.
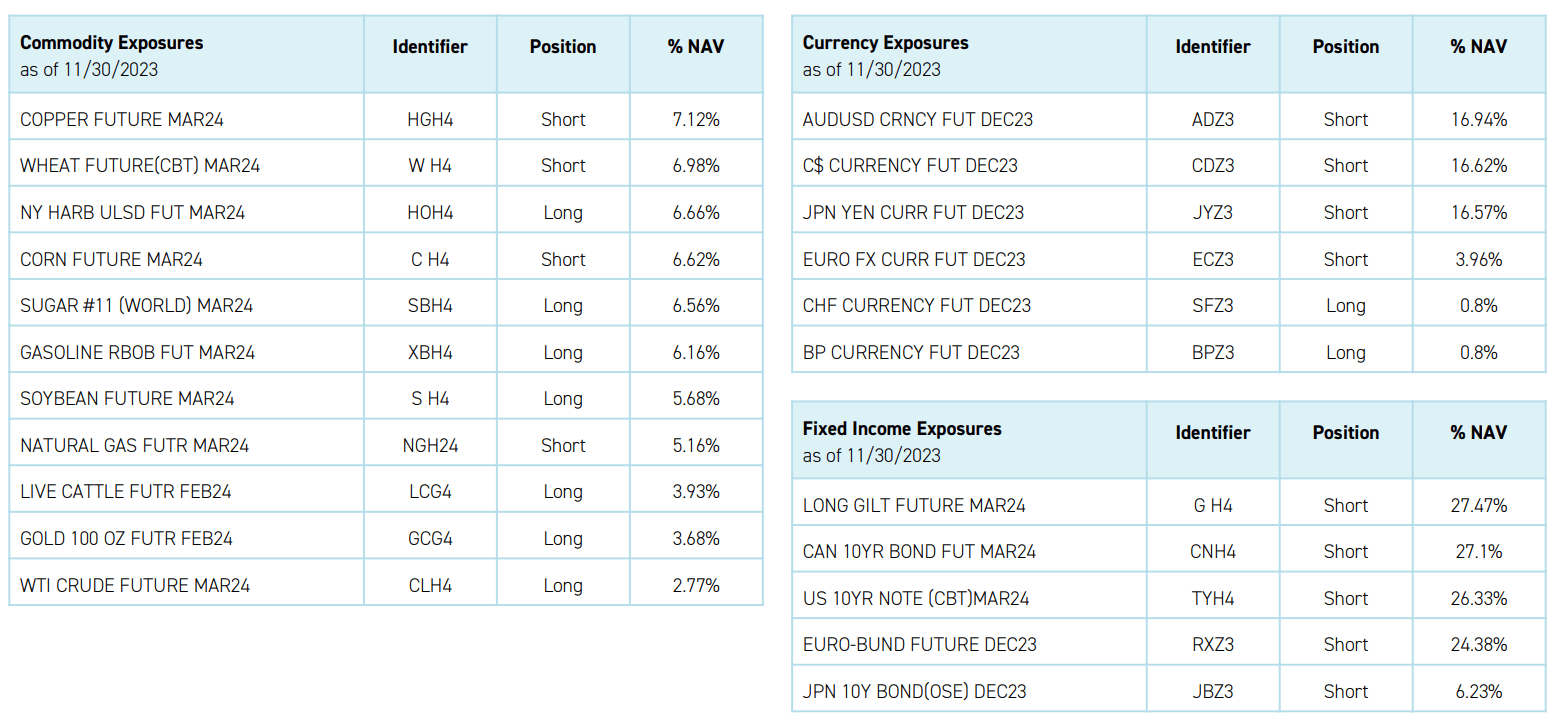
This means that our 12.5% exposure to KMLM gives us a total exposure of 37.5%!
This position is one of our least risky (besides FSMMX) and contributes "negative risk" to our risk decomposition in the backtest. Managed futures strategies in particular have had the historic capacity to lower portfolio volatility. KMLM has a target volatility of 15% and has performed well in the past during crises and drawdowns. Below are its signal charts, overlayed with its performance.
Note, there are two different graphs in each chart below; this is a mess from KraneShares, but really beautiful data when you read it right. Double check the axes.
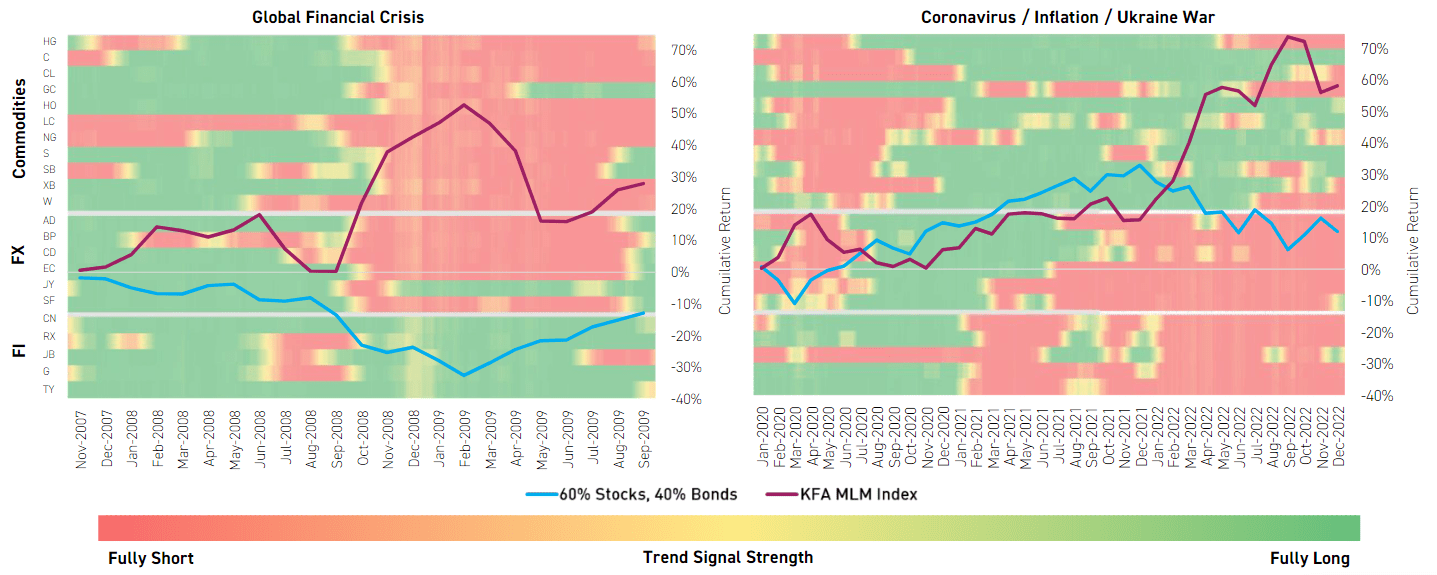
This rounds out our alternatives exposure and sets us up with a now very dense set of strategies that will run atop our core equity and bond exposure.
Performance
So how does it do?
Well, performance is tough to gauge because some of the components in the strategy are very new to market and don't have available backtesting data.
The portfolio's best "full asset allocation fund" competitor is the Standpoint Multi-Asset Fund ( BLNDX / REMIX ), so I'm using that as a benchmark, as well as a 60/40 portfolio represented by VBIAX. You could also use the iShares AO series ETFs as good benchmarks.
Figure 27 (PortfolioVisualizer)
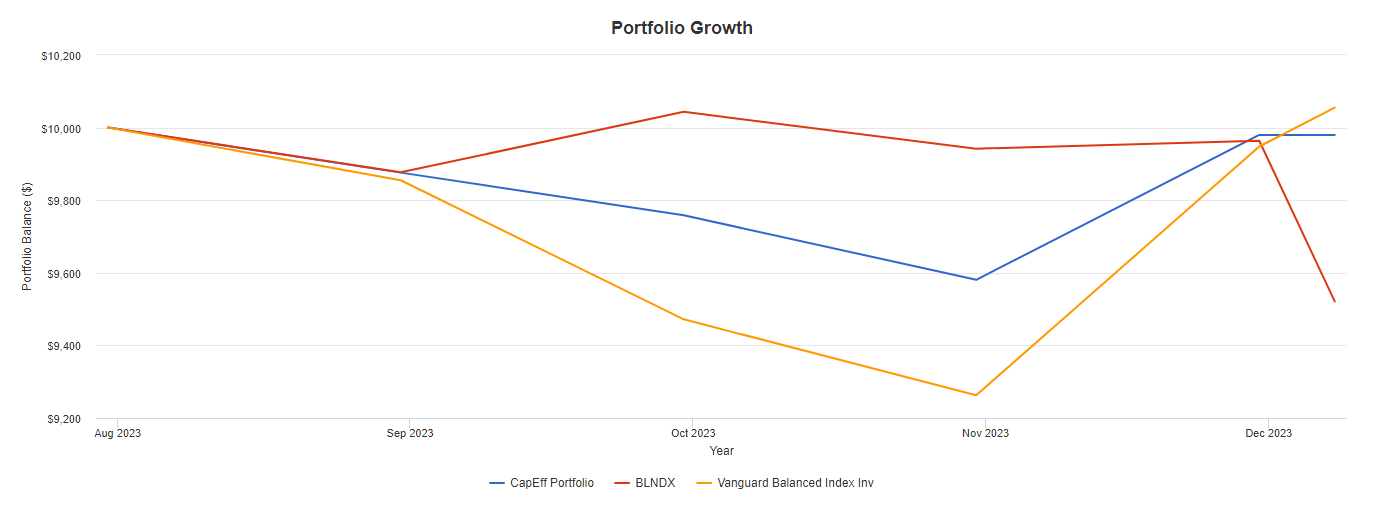
I can only get data as far back as August of this year, but so far it has performed as expected - on par with a 60/40 portfolio but with less volatility.
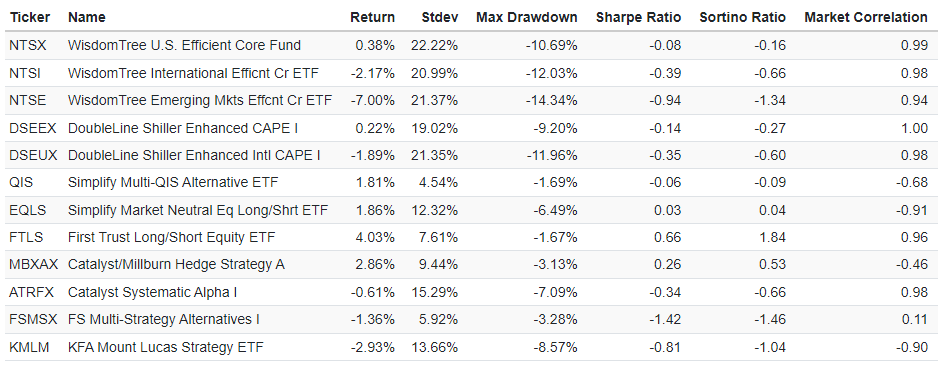
Figure 28 (PortfolioVisualizer)
The CapEff Portfolio had a standard deviation almost half that of a 60/40 portfolio.
Figure 29 (PortfolioVisualizer)
These statistics are not incredibly indicative of long term performance because these are only about five months of data. Note the distribution of standard deviation, with our core and value sleeves taking on the bulk on our risk.
Figure 30 (PortfolioVisualizer)
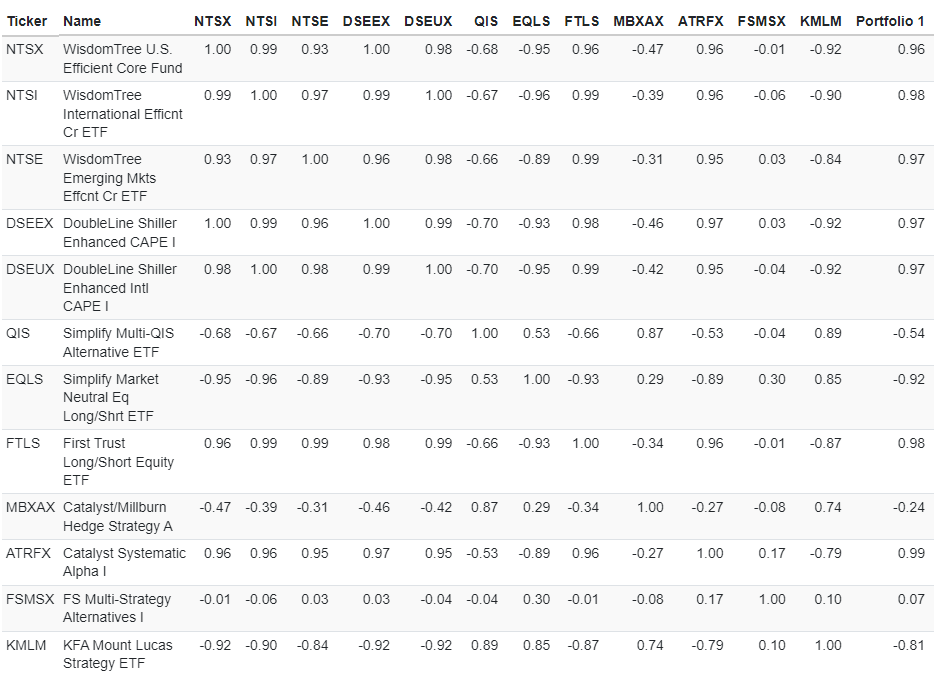
Immediately, the correlation matrices start to show us how different all of the strategies are. Here, we can see the alternative sleeve getting to work on lowering inter-portfolio correlations ("IPC").
Figure 31 (PortfolioVisualizer)
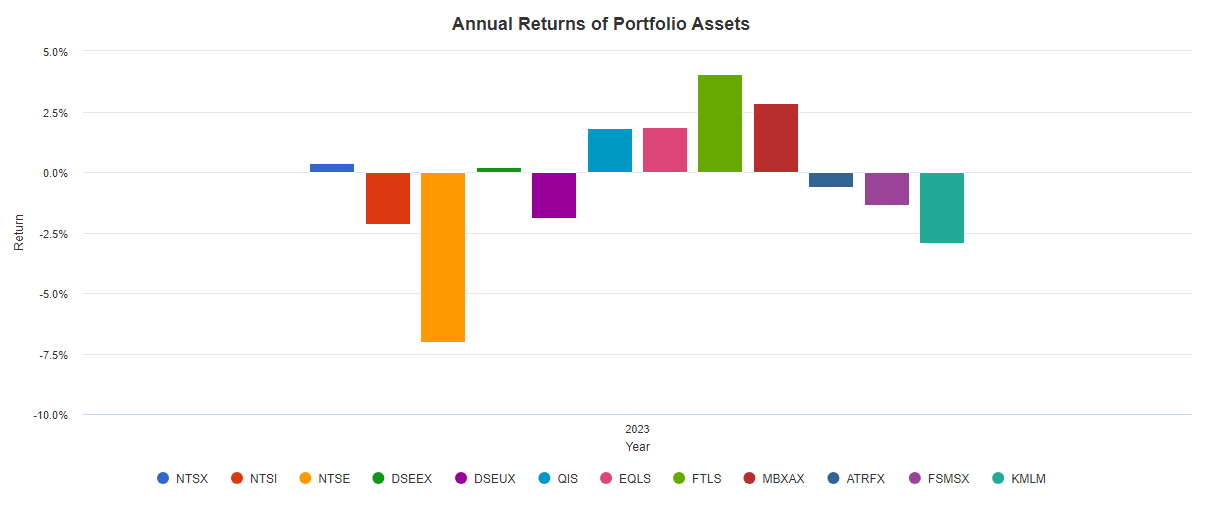
Here is the risk decomposition, which measures how much each asset added to overall portfolio standard deviation. Our beta exposure via the NTS funds and DoubleLine funds added the most risk, and all of our alternatives bar FTLS and ATRFX (two of our lowest weighted alternatives holdings) had negligible or outright negative risk contribution.
Figure 32 (PortfolioVisualizer)
Keep in mind that even though Figure 32 says annual, the backtest is only from 8/1/23 - 12/11/23.
This portfolio is going to be something that will need a follow up, as in total, this is too little data to say anything else meaningful. Because of the idiosyncratic nature of alternatives funds, especially funds like EQLS and QIS that hamper backtesting, there are no good alternatives to substitute in for them.
Time will tell.
Conclusion
I will be following up on this, as well as the 8%-yielding income portfolio I proposed here.
I'm running it for myself, but I've made it publicly available so that folks can check in on it if they'd like.
I will also like to follow-up on this article in a quarter or two to see how it handles market volatility. Please leave a comment below if you would be interested in updates on either this portfolio or the income portfolio.
If you made it this far in the article, thank you so much. I hope you enjoyed the read and learned about a new fund or a new strategy. Please let me know if anything in particular stood out or if you would be interested in further coverage of one of the assets in the portfolio.
For further details see:
Building A Better Portfolio With Capital Efficient Funds, Responsible Leverage, And Alternatives