OPI - Can Fallen Angels Soar Again In 2023?
Summary
- We explore the factors that may contribute to 2023 returns, including interest rate policy and its effect on the real economy, bond market expectations, and the impact of the yield curve.
- Fallen angels underperformed broad HY by 2.78% (-14.00% vs. -11.22%) for 2022, with more than 100% underperformance happening within the year's first four months.
- Overall, interest rate movements explained more than 100% of the fallen angel underperformance.
We explore the factors that may contribute to 2023 returns, including interest rate policy and its effect on the real economy, bond market expectations, and the impact of the yield curve.
Fallen angels (as represented by the ICE US Fallen Angel High Yield 10% Constrained Index, Ticker: H0CF; subsequently referred to herein as "the index") underperformed broad HY (as represented by the ICE BofA US High Yield Index, Ticker: H0A0) by 2.78% (-14.00% vs. -11.22%) for 2022, with more than 100% underperformance happening within the year's first four months. Fallen angels were lagging broad HY by 3.19% thru 4/30 (where the Fed had only hiked by 0.25% in their March meeting, but the 10Y had increased by 1.37%), but then outperformed broad HY for the remainder 8 months of the year by 0.34% (with the Fed adding +4.00% and the 10Y increasing by 0.99%).
Source: ICE Data Services, US Treasury. Past performance is no guarantee of future results. Fallen Angels: ICE US Fallen Angel High Yield 10% Constrained Index. Broad HY: ICE BofA US High Yield Index, 10Y US treasury and Fed Funds.
2022: Year in Review
2021 was a smooth ride where fallen angels outperformed as the energy sector, alongside oil prices, contributed the most. But 2022 was an entirely different story. We expected rising stars and or the Fed to drive returns and were not completely wrong, as the Federal Reserve ((FED)) actions were at center stage. There were rising stars, but the impact on returns was overshadowed by rising interest rates as the market adjusted to persistently high inflation.
- Investors grappled with numerous challenging developments in 2022: 40-year high inflation that led the Fed to +4.00% of rate hikes and the markets taking a big hit; central banks tightening around the world trying to fight inflation; the Russia Ukraine War bringing volatility into oil and commodities; global growth concerns; yield curve inversion, among others.
- The 10Y yield continued its 2021 upward trend, starting at 1.52% and rising relatively quickly to 3.12% at the beginning of April. It hit its highest level since the GFC at 4.25% in mid-October and finished the year at 3.88%.
- Broad HY and fallen angels had their second to-last worst calendar year since 2004, only outperforming 2008, where returns were in the mid -20%. 10Y+ Treasuries returned -28.15%, US investment grade -15.44%, the US bond broad market return -13.16%, US IG Floating Rates notes +0.48% and 0-3-month Treasuries +1.53%, showing how long duration asset classes did worse.
- Broad HY outperformed fallen angels for the fourth time since 2004, adding 2022 to 2007, 2011, and 2018 where broad HY came out on top. For the 2004-2022 calendar year average return, fallen angels are still on top despite 2022 underperformance; fallen angels average 9.53% vs. 7.19% for broad HY.
- Overall, interest rate movements explained more than 100% of the fallen angel underperformance. After adjusting for duration, selection and allocation effects contributed positively and partially offset some of the interest rate movements.
The yield to worst for fallen angels (7.49%) is now above the historical average (7.06%), providing a level where adding exposure may be attractive for investors as the higher level of carry offers a significant cushion for returns in a range of potential rate/spread scenarios (including upgrades/downgrades) going forward. Spreads are still under long-term averages, meaning there is room for them to widen, particularly if credit markets price in slowing growth or a recessionary environment which hasn't been the case yet. On the other hand, fundamentals generally remain strong, and current spread levels reflect that. Fallen angel spreads have been oscillating between the low 200s-to lows 400s levels since the end of 2020 but have yet to reach the 500 mark. Wider spread environments with weakening fundamentals would most likely lead to an increase in fallen angel volume, which has driven outperformance of fallen angels versus broad high yield historically. The ability to earn a high level of carry, and the higher overall credit quality of fallen angels, may make fallen angels an attractive place for high yield investors to wait for a turn in the credit cycle.
Fallen Angels Yield-to-Worst (12/31/2003 - 12/31/2022)
Source: ICE Data Services, VanEck. Past performance is no guarantee of future results. Fallen Angels: ICE US Fallen Angel High Yield 10% Constrained Index.
The 2023 Story: Fed, Spreads and Rating Migrations
We believe there are couple of factors that may drive returns in the coming year.
- Investors will continue to closely watch the Fed. There is currently a disconnect between market expectations for a Fed pivot and recent Fed speak suggesting a higher terminal rate, and staying at that level for an extended period. The impact on the real economy and high yield borrowers is going to be a key driver in high yield bond returns this year.
- Bond market expectations and the impact on the yield curve will also be important. The significant increase in longer term rates in 2022 may not be matched in 2023, and even if bond yields do continue to move up, the higher carry helps cushion the impact. Fed hikes and rising bond yields have not necessarily meant underperformance of fallen angels, despite their longer duration. Two periods known and one to be determined, show that fallen angels have yet to underperform:
- June 2004 to June of 2006:
- Fed Funds were raised from ~1% to ~5.25% while the 10Y change 0.53% (from 4.62% to 5.15%)
- Fallen angels outperformed by 1.49% (17.31% vs 15.82%)
- October 2015 to January 2019:
- Fed Funds were raised from ~0% to ~2.5% while the 10Y change 0.42% (from 2.27% to 2.69%)
- Fallen angels outperformed by 9.03% (32.45% vs 23.42%)
- March 2022 to December 2022:
- Fed Fund were raised from ~0.25% to ~4.25% while the 10Y change 1.56% (from 2.32% to 3.88%)
- Fallen angels underperformed by 0.47% (-7.49% vs -7.02%) but the expectation is for the Fed to continue raising them so the current cycle is not yet over
- June 2004 to June of 2006:
- As of the end of last year, fallen angels' spreads were at 337 and broad HY at 481 with historical averages of 466 and 521; still tight relative to historical levels. Despite the difference between them being wider than usual, compositional differences help explain it as fallen angels finished the year with an 87% BB rated vs 51% for broad HY.
- Sell side forecasts on credit migration (upgrades and downgrades) vary in 2023, reflecting an uncertain macro environment. Downgrades may continue to be more idiosyncratic and less sector specific than what we've seen over the last few years, looking more like 2022 where all 8 issuers were from different sectors. The corporate fundamental backdrop may become more challenged, translating into sector dispersion and potentially some defaults, with the expected high yield default rate increasing to 2-3% by December of 2023. Upgrades may continue their momentum in 2023 and some issuers (Occidental Petroleum, Ford, etc.) are on a good deleveraging path and will most likely see their credit ratings improve.
- Overall, we believe a repeat of 2022 is unlikely given the support from yields .
Fallen angels' overall stats
Duration, the sensitivity of the price of a bond to a change in interest rates, was the major player this year, thus detracting any bond strategy with mid to long term duration. Unfortunately, fallen angels have a slightly longer duration that broad HY, despite cutting it by 22% whereas broad HY remained flat for 2022, so it was hit harder than broad high yield. In terms of yields, fallen angels yield to worst continues to look attractive versus historical averages despite retreating from the yearly highs on mid-October, but are still on the higher end after increasing 119% vs 106% for broad HY from the end of 2021.
New fallen angels
2022 saw 8 downgrades for a total market value of 8.37% added to the index, with Las Vegas Sands being top weight as there was limited confidence in the recovery of Macau's gaming industry due to very strict governmental Covid policies which have started to shift over the last few weeks of 2022 and should continue in 2023. The last downgrade issuer for the year was Kohl's, as Moody's states that the erosion of market position and the deterioration in their credit metrics does not reflect an IG rating. There is low visibility for fallen angels in 2023, likely reflecting a very uncertain macro environment but we believe there will be some next year.
| Month-end Addition |
| Name |
| Rating |
| Sector |
| Industry |
| % Mkt Value |
| Price |
| April |
| Steelcase Inc |
| BB1 |
| Services |
| Support-Services |
| 0.36 |
| 97.82 |
| June |
| Las Vegas Sands |
| BB1 |
| Leisure |
| Gaming |
| 3.32 |
| 89.72 |
| July |
| Ohio National Financial Services |
| BB1 |
| Insurance |
| Life Insurance |
| 0.59 |
| 99.87 |
| August |
| Pacific Western Bank |
| BB1 |
| Banking |
| Banking |
| 0.33 |
| 89.61 |
| August |
| Toledo Hospital |
| BB1 |
| Healthcare |
| Health Facilities |
| 0.58 |
| 63.58 |
| November |
| Office Properties Income Trust |
| BB1 |
| Real Estate |
| REITs |
| 1.54 |
| 79.44 |
| November |
| Western Digital Corp. |
| BB1 |
| Technology & Electronics |
| Tech Hardware & Equipment |
| 0.73 |
| 76.91 |
| December |
| Kohl's Corp. |
| BB1 |
| Retail |
| Department Stores |
| 0.91 |
| 74.21 |
Source: ICE Data Services, VanEck. Past performance is no guarantee of future results. Not a recommendation to buy or sell any of the names/securities mentioned herein. Fallen Angels: ICE US Fallen Angel High Yield 10% Constrained Index.
Rising Stars
As mentioned last year, rising stars were a big part of the conversation in 2022, although their impact on returns was overshadowed by rising yields. Overall, there were 8 issuers upgrades to IG from HY that removed 18.36% of market value weight of the index which was higher than 2021 rising stars (12 issuers for a 12.13% weight), although, Kraft account for half of this past year weight.
| Month-end Exit |
| Name |
| Rating |
| Sector |
| Industry |
| % Mkt Value |
| Price |
| January |
| Freeport-McMoran Inc |
| BB1 |
| Basic Industry |
| Metals/Mining Excluding Steel |
| 2.73 |
| 111.46 |
| March |
| EQT Corporation |
| BB1 |
| Energy |
| Energy - Exploration & Production |
| 2.00 |
| 105.82 |
| March |
| Kraft Heinz Foods Company |
| BB1 |
| Consumer Goods |
| Food - Wholesale |
| 9.70 |
| 106.50 |
| April |
| Michael Kors ((USA)) Inc |
| BB1 |
| Retail |
| Specialty Retail |
| 0.35 |
| 97.50 |
| May |
| HCA |
| BB1 |
| Healthcare |
| Health Facilities |
| 0.27 |
| 108.75 |
| August |
| DCP Midstream |
| BB1 |
| Energy |
| Gas Distribution |
| 1.36 |
| 103.57 |
| October |
| Deutsche Bank AG NY Branch |
| BB1 |
| Banking |
| Banking |
| 1.32 |
| 93.05 |
| December |
| Hexcel Corporation |
| BB1 |
| Capital Goods |
| Aerospace/Defense |
| 0.63 |
| 95.02 |
Source: ICE Data Services, VanEck. Past performance is no guarantee of future results. Not a recommendation to buy or sell any of the names/securities mentioned herein. Fallen Angels: ICE US Fallen Angel High Yield 10% Constrained Index.
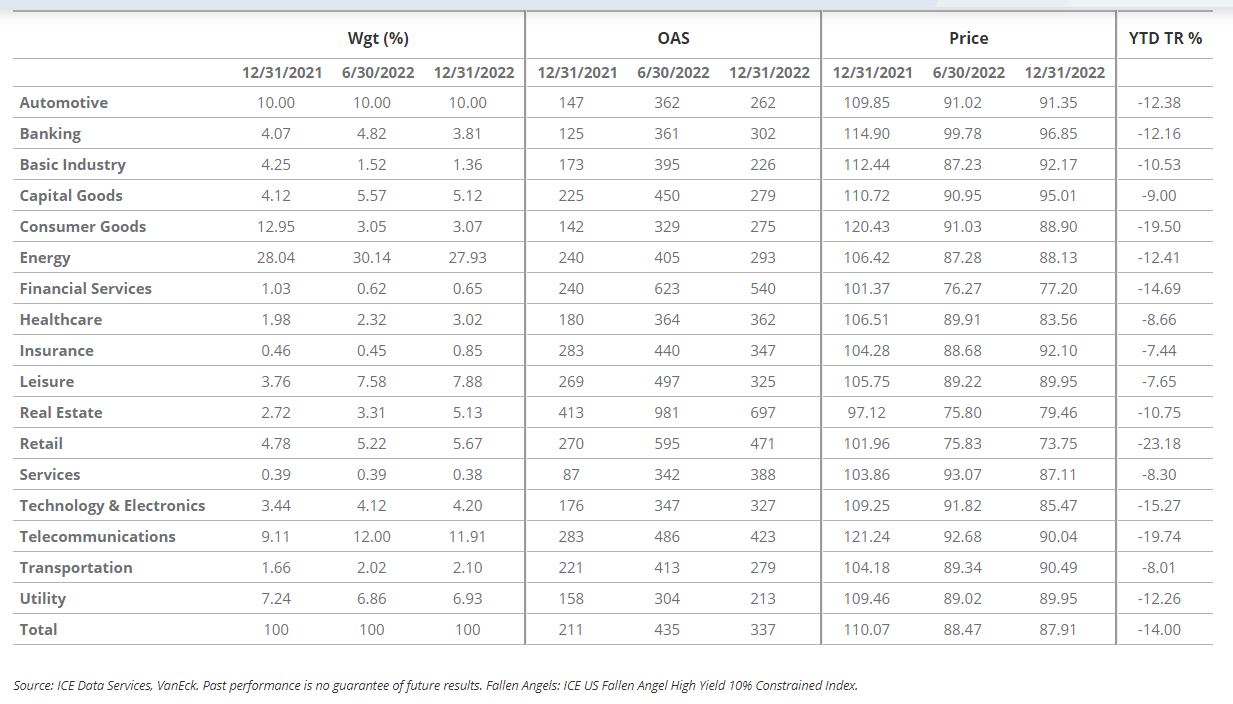
Fallen angels' performance by sector
No sector posted a positive return this past year with the Insurance sector posting the best total return of all at -7.44% and Retail posting the worst at -23.18%. There were some changes to the sector allocation, but Energy still dominates the fund. With the upgrade of Kraft to investment grade, the Consumer Goods saw its allocation decrease by 9.88% which was then redistributed mostly to Leisure (Las Vegas Sands downgraded) and to the Telecom sector. Spreads, as expected, widened for all sectors but are still on the tighter end. The index price is getting closer to $90 with only 11.45% of the index in the $70s, 53.40% in the $80s and 35.15% in the 90s, allowing for future price appreciation and good entry points as the historical average is still in the mid $90s.
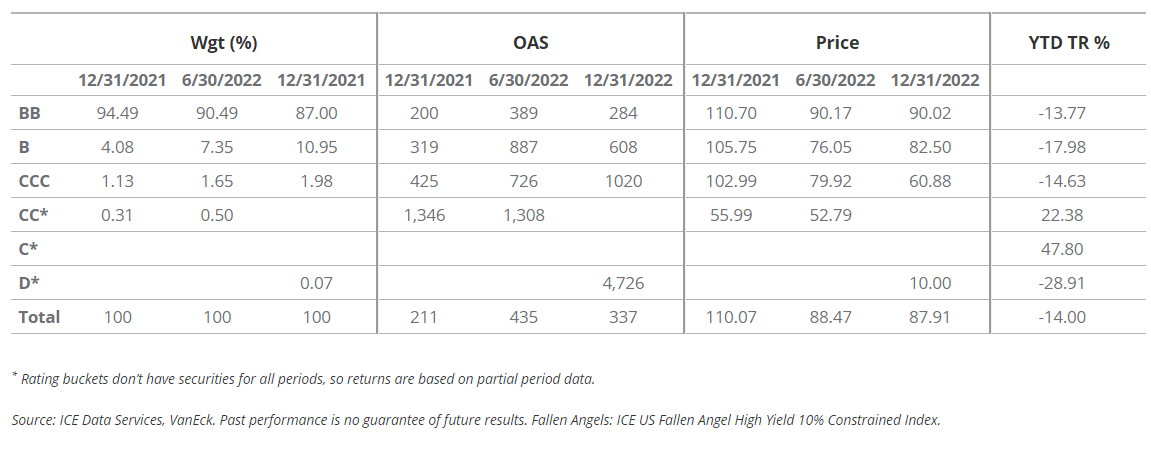
Fallen angels' performance by rating
Fallen angels have decreased its exposure to BB-rated bonds over the last year but the index is still offering higher quality within high yield. In general, lower rated buckets (single-B and CCC-and-lower) were ahead at the beginning of the year, for the first four months, but it was BBs that ended the year on the top spot.
Important Definitions and Disclosures
Data throughout sourced from ICE Data Services and VanEck as of 12/31/2022.
Please note that VanEck may offer investments products that invest in the asset class(es) or industries included in this blog.
This is not an offer to buy or sell, or a recommendation to buy or sell any of the securities/financial instruments mentioned herein. The information presented does not involve the rendering of personalized investment, financial, legal, or tax advice. Certain statements contained herein may constitute projections, forecasts and other forward looking statements, which do not reflect actual results, are valid as of the date of this communication and subject to change without notice. Information provided by third party sources are believed to be reliable and have not been independently verified for accuracy or completeness and cannot be guaranteed. VanEck does not guarantee the accuracy of third party data. The information herein represents the opinion of the author(s), but not necessarily those of VanEck or its employees.
Yield-to-Worst (YTW): This is the lowest yield that can be received on a bond that fully operates within the terms of its contract without defaulting.
Option-Adjusted Spread (OAS): The measurement of the spread of a fixed-income security and the risk-free rate which is then adjusted for an embedded option.
A fallen angel bond is a bond that was initially given an investment-grade rating but has since been reduced to junk bond status.
High yield bonds may be subject to greater risk of loss of income and principal and are likely to be more sensitive to adverse economic changes than higher rated securities.
A rising star is a high yield bond that is upgraded to investment grade.
Duration is an estimate of how much the value of a bond portfolio would be affected by a change in prevailing interest rates. The longer a portfolio's duration, the more sensitive it is to changes in interest rates.
There are inherent risks with fixed income investing. These risks may include interest rate, call, credit, market, inflation, government policy, liquidity, or junk bond. When interest rates rise, bond prices fall. This risk is heightened with investments in longer duration fixed-income securities and during periods when prevailing interest rates are low or negative.
Index returns are not Fund returns and do not reflect any management fees or brokerage expenses. Certain indices may take into account withholding taxes. Investors cannot invest directly in the Index.
ICE BofA US High Yield Index (H0A0, "Broad HY Index"), formerly known as BofA Merrill Lynch US High Yield Index prior to 10/23/2017, is comprised of below-investment grade corporate bonds (based on an average of various rating agencies) denominated in U.S. dollars.
ICE US Fallen Angel High Yield 10% Constrained Index (H0CF, "Fallen Angels Index") is a subset of the ICE BofA US High Yield Index and includes securities that were rated investment grade at time of issuance.
Fallen Angel U.S. High Yield index data on and prior to February 28, 2020 reflects that of the ICE BofA US Fallen Angel High Yield Index (H0FA). From February 28, 2020 forward, the Fallen Angel U.S. High Yield index data reflects that of the Fund's underlying index, the ICE US Fallen Angel High Yield 10% Constrained Index (H0CF). Fallen Angel U.S. High Yield index data history which includes periods prior to February 28, 2020 links H0FA and H0CF and is not intended for third party use.
ICE Data Indices, LLC and its affiliates ("ICE Data") indices and related information, the name "ICE Data", and related trademarks, are intellectual property licensed from ICE Data, and may not be copied, used, or distributed without ICE Data's prior written approval. The licensee's products have not been passed on as to their legality or suitability, and are not regulated, issued, endorsed, sold, guaranteed, or promoted by ICE Data. ICE Data MAKES NO WARRANTIES AND BEARS NO LIABILITY WITH RESPECT TO THE INDICES, ANY RELATED INFORMATION, ITS TRADEMARKS, OR THE PRODUCT((S)) (INCLUDING WITHOUT LIMITATION, THEIR QUALITY, ACCURACY, SUITABILITY AND/OR COMPLETENESS).
All investing is subject to risk, including the possible loss of the money you invest. As with any investment strategy, there is no guarantee that investment objectives will be met and investors may lose money. Diversification does not ensure a profit or protect against a loss in a declining market. Past performance is no guarantee of future results.
© Van Eck Securities Corporation, Distributor, a wholly owned subsidiary of Van Eck Associates Corporation.
Editor's Note: The summary bullets for this article were chosen by Seeking Alpha editors.
For further details see:
Can Fallen Angels Soar Again In 2023?