SOJE - CDC: Dividend ETF With Unconventional Market Timing
2023-09-01 14:48:52 ET
Summary
- VictoryShares US EQ Income Enhanced Volatility Wtd ETF is a defensive fund with inverse volatility weighting and unconventional market timing.
- The heaviest sectors in the portfolio are utilities and financials. Portfolio quality is inferior to the S&P 500.
- The CDC ETF has underperformed the S&P 500 and competitors, but has shown lower risk in drawdown and volatility. Market timing rules have often been counter-productive.
CDC strategy and portfolio
VictoryShares US EQ Income Enhanced Volatility Wtd ETF ( CDC ) started investing operations on 07/01/2014 and tracks the Nasdaq Victory US Large Cap High Dividend 100 Long/Cash Volatility Weighted Index. CDC has a portfolio of 100 companies, a dividend yield of 4.01% and a net expense ratio of 0.35%. It pays monthly dividends.
As described by Victory Capital and Nasdaq , the starting universe is the Nasdaq Victory US Large Cap 500 Volatility Weighted Index (Reference Index), which selects 500 stocks with larger capitalization and positive trailing 12-month earnings. Real estate investment trusts, or REITs, are excluded. Then, the highest 100 dividend-yielding stocks are selected and weighted based on the inverse of volatility, measured as the standard deviation of daily returns over the last 180 days. Moreover, the underlying index has embedded market timing rules designed to reduce equity exposure in market downturns. These rules are based on the month-end value of the Reference Index relative to its All-Time Highest Daily Closing Value ("AHDCV"):
- Down less than 10% from AHDCV: 100% invested;
- Down 10% or more: 25% invested, 75% cash;
- Down 20% or more: 50% invested, 50% cash;
- Down 30% or more: 75% invested, 25% cash;
- Down 40% or more: 100% invested.
In other words, the timing strategy is "sell 75% after a first 10% dip, then buy back 25% on every additional 10% dip." This is a reversal rationale: the idea is to come back fully invested before the crowd. It is a bit counter-intuitive relative to the usual market timing rules based on moving averages or macroeconomic indicators.
In summary, CDC is a defensive exchange-traded fund implementing 3 safety levels:
- Fundamental screening.
- Inverse volatility weighting.
- Market Timing (unconventional).
As of writing (9/1/2023), CDC is fully invested in equities because the Reference Index was in a drawdown by less than 10% on the last monthly decision point. However, the fund is in drawdown by about 23% relative to its all-time high of April 2022, which is a clue that the market timing hasn't worked very well since then.
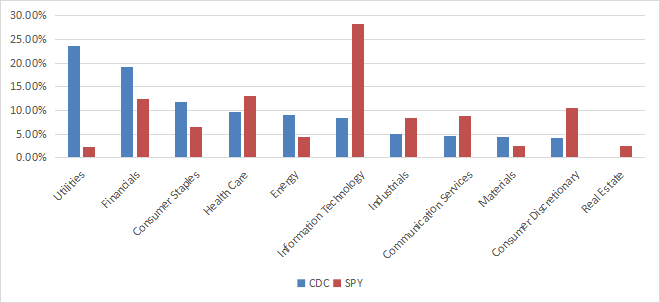
The fund holds almost exclusively U.S.-based companies (over 98% of asset value). The next chart compares sector breakdowns of the CDC and the S&P 500 ( SPY ) based on data at the end of July. The top sectors are utilities (23.5%), financials (19.1%) and consumer staples (11.8%). Other sectors are below 10%. Compared to the S&P 500 (SP500), CDC overweights these three sectors, along with energy and materials. It underweights all other sectors and ignores real estate by choice.
Sector breakdown (chart: author; data: Victory Capital and SSGA)
The next table lists the top 10 holdings as of writing. They represent 15.4% of asset value and no holding weights more than 2% of assets, so the portfolio is well-diversified and risks related to individual stocks are low.
| Ticker |
| Name |
| Weight % |
| EPS growth % TTM |
| P/E TTM |
| P/E fwd |
| Yield % |
| Johnson & Johnson |
| 1.97 |
| -28.25 |
| 32.75 |
| 15.51 |
| 2.94 |
| The Coca-Cola Co. |
| 1.71 |
| 9.95 |
| 24.73 |
| 22.64 |
| 3.08 |
| Kimberly-Clark Corp. |
| 1.62 |
| -8.19 |
| 26.56 |
| 19.96 |
| 3.66 |
| Amgen, Inc. |
| 1.55 |
| 25.70 |
| 17.29 |
| 14.04 |
| 3.32 |
| International Business Machines Corp. |
| 1.52 |
| -64.96 |
| 68.09 |
| 15.33 |
| 4.52 |
| CME Group, Inc. |
| 1.50 |
| 1.52 |
| 24.76 |
| 22.46 |
| 4.39 |
| Cisco Systems, Inc. |
| 1.44 |
| 9.02 |
| 18.66 |
| 14.12 |
| 2.72 |
| The Southern Co. |
| 1.35 |
| -0.42 |
| 24.01 |
| 18.81 |
| 4.13 |
| Kellogg Co. |
| 1.35 |
| -42.10 |
| 24.28 |
| 14.73 |
| 3.93 |
| Philip Morris International, Inc. |
| 1.34 |
| -11.23 |
| 18.58 |
| 15.38 |
| 5.29 |
Past performance
Since inception in July 2014, CDC has underperformed SPY, as reported in the next table. However, it looks less risky in drawdown and standard deviation of monthly returns (named "volatility" below).
| Total Return |
| Annual Return |
| Drawdown |
| Sharpe ratio |
| Volatility |
| CDC |
| 113.21% |
| 8.63% |
| -21.37% |
| 0.63 |
| 13.00% |
| SPY |
| 170.40% |
| 11.48% |
| -33.72% |
| 0.72 |
| 15.42% |
Data calculation: Portfolio123.
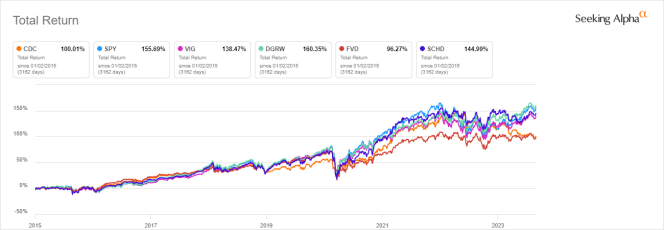
The next chart compares total returns since 1/1/2015 of CDC, SPY and four dividend ETFs focused on quality:
- Vanguard Dividend Appreciation Index Fund ( VIG ).
- WisdomTree U.S. Quality Dividend Growth Fund ( DGRW ).
- First Trust Value Line Dividend Index Fund ( FVD ).
- Schwab U.S. Dividend Equity ETF ( SCHD ).
CDC is second to last by a short margin.
CDC vs. benchmark and competitors, since 2015 (Seeking Alpha)
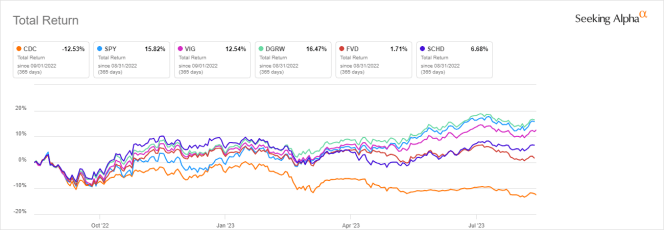
In the whipsaw of the last 12 months, CDC has often been on the wrong foot, reducing exposure before market rallies.
CDC vs. benchmark and competitors, 12-month total return (Seeking Alpha)
The sum of annual distributions has increased from $1.13 per share to $2.16 between 2015 and 2022. This is a 91% growth rate in 7 years, whereas the cumulative inflation has been about 25% in the same time (based on CPI). This is a good point.
CDC distribution history since 2015 (Seeking Alpha)
In previous articles, I have shown how three factors may help cut the risk in a dividend portfolio: Return on Assets , Piotroski F-score , and Altman Z-score .
The next table compares CDC since inception with a subset of the S&P 500: stocks with an above-average dividend yield, an above-average ROA, a good Altman Z-score, a good Piotroski F-score and a sustainable payout ratio. The subset is rebalanced annually to make it comparable with a passive index.
| Total Return |
| Annual Return |
| Drawdown |
| Sharpe ratio |
| Volatility |
| CDC |
| 113.21% |
| 8.63% |
| -21.37% |
| 0.63 |
| 13.00% |
| Dividend & quality subset |
| 161.18% |
| 11.06% |
| -38.40% |
| 0.68 |
| 16.37% |
P ast performance is not a guarantee of future returns. Data calculation : Portfolio123.
CDC underperforms the dividend quality subset by 2.4 percentage points in annualized return. However, it shows a lower risk in drawdown and volatility. My core portfolio holds 14 stocks selected in this subset (more info at the end of this post).
Portfolio quality
I have scanned holdings with the quality metrics described in the previous paragraph. I consider that risky stocks are companies with at least 2 red flags among: bad Piotroski score, negative ROA, unsustainable payout ratio, bad or dubious Altman Z-score, excluding financials where these metrics are less relevant. With these assumptions, 17 stocks out of 100 are risky, and they weigh 16.6% of asset value. This is a bad point.
Based on my calculation, the aggregate return on assets, Altman Z-score and Piotroski F-score are below S&P 500 values. These metrics point to a portfolio quality inferior to the benchmark.
| CDC |
| SPY |
| Altman Z-score |
| 2.06 |
| 3.54 |
| Piotroski F-score |
| 5.39 |
| 5.66 |
| ROA % TTM |
| 5.45 |
| 7.04 |
Takeaway
VictoryShares US EQ Income Enhanced Volatility Wtd ETF is a defensive exchange-traded fund seeking to mitigate risks in 3 ways: fundamental screening, inverse volatility weighting and market timing. Market timing rules are unconventional: it is a "sell first, then buy the dips" strategy. The heaviest sectors in the portfolio are utilities and financials. The portfolio is well-diversified across sectors and holdings. Aggregate quality metrics are inferior to the benchmark. Historical performance relative to the benchmark and competitors is underwhelming, even if the fund shows a low risk regarding drawdown and volatility. Market timing rules have often been on the wrong foot in the last 12 months. CDC is fully invested in equities in September 2023.
For further details see:
CDC: Dividend ETF With Unconventional Market Timing