ECCV - CEF Weekly Review: Comparing Yield To Long-Term Performance Requires Care
2023-05-21 04:45:06 ET
Summary
- We review CEF market valuation and performance through the second week of May and highlight recent market action.
- CEFs were broadly down this week, under pressure from falling Treasuries and stocks.
- We take a look at the recent trend in analyzing funds by comparing their yields to longer-term total NAV return - something which requires care.
- And highlight AFT hike and Eagle Point NAVs.
This article was first released to Systematic Income subscribers and free trials on May 14.
Welcome to another installment of our CEF Market Weekly Review where we discuss closed-end fund ("CEF") market activity from both the bottom-up - highlighting individual fund news and events - as well as the top-down - providing an overview of the broader market. We also try to provide some historical context as well as the relevant themes that look to be driving markets or that investors ought to be mindful of.
This update covers the period through the second week of May. Be sure to check out our other weekly updates covering the business development company ("BDC") as well as the preferreds/baby bond markets for perspectives across the broader income space.
Market Action
It was a tough week for the CEF space with nearly all sectors finishing in the red. Month-to-date, only two sectors are in the green with all but one sector experiencing discount widening.
Systematic Income
Discounts pushed wider on the week toward double-digit levels. Equity CEF sector discounts are now at their widest level since 2021. Fixed-income CEF sector discounts are still about 1% tighter than their recent October wides. Given the number of macro challenges on the horizon, discounts look to be in the fair-value range in aggregate.
Systematic Income
Market Themes
Something we have always liked to do in our CEF analysis is to compare the fund's yield with its long-term total NAV return. This is important to give us a sense of the fund's longer-term return potential. For example, if a fund's yield on NAV is 12% but its 10Y total NAV return is closer to 3% then investors should question whether that 12% yield actually translates into a much smaller wealth increase in the long term.
We have used this type of analysis for years and we recently started to see more of it elsewhere which suggests it is becoming increasingly accepted. However, it's very easy for this kind of analysis to go awry in a couple of ways. In this section we highlight two things investors need to understand in this kind of analysis. We restrict our analysis to credit (i.e. non-equity) funds since that's where it applies most directly.
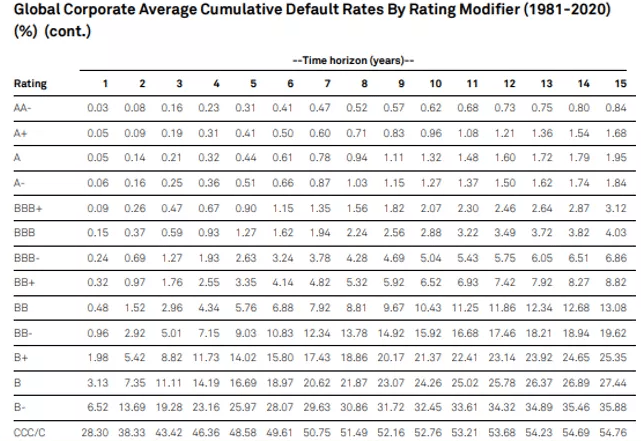
First, for a fund that's distributing nearly all of its income it is nearly impossible to maintain a flat or increasing NAV over time. This is because of a number of frictions that credit CEFs encounter. One of the greatest is simply credit losses. The following table shows that a fund holding B-rated assets (not far off the typical high-yield corporate bond or loan CEF) may face a default rate of 3-4% per year and a loss rate of around 1-2%. Once we add leverage, that loss rate could be even higher on a NAV basis. In other words, all else equal, total NAV return for a credit fund is going to be lower than its net investment income and, very likely, NAV yield.
Apart from credit losses, other frictions include deleveraging, trading costs and others. This means that, in the absence of very high alpha, credit funds that roughly distribute their net income will tend to see NAV deflation over time, resulting in total NAV returns that are below their NAV yields.
There is nothing inherently wrong with this. Many investors explicitly avoid funds with falling NAVs, however, a falling NAV is just a reflection of the mechanics of distributions and these frictions for credit assets.
The second key dynamic to understand is that any kind of yield and total NAV return comparison has to be done on what we call the flat-yield basis. This means that the starting point and end point of the analysis need to feature roughly the same yields. If this is not done, the total NAV return will either overstate or understate the expected annual CAGR of the fund and asset class over the long term.
At the moment various income assets feature relatively elevated yields. This means that a comparison of a fund's yield and its (very likely much lower) annualized total NAV return is not a reasonable one. For this reason investors need to be suspicious of any claim that "this fund returned only X over the last Y years relative to its Z yield", where X is well below Z. They should instead ask the analyst to run the same comparison over the period where the yield was the same in order to avoid this bias.
Market Commentary
The Apollo Senior Floating Rate Fund ( AFT ) raised its distribution once again. Interestingly, its sister fund Apollo Tactical Income Fund ( AIF ) which we hold in our High Income Portfolio did not hike even though the two are usually in step.
The reason likely has to do with a higher floating-rate allocation in AFT than in AIF. AFT has 93% of its portfolio in loans whereas AIF is at around 85% (split between loans and CLO Debt). At this point the AFT NAV distribution rate is slightly higher at 9.65% vs. 9.24% for AIF which makes sense.
We continue to favor AIF in this pair due to a more diverse portfolio featuring loans, bonds and CLO Debt, creating greater relative value opportunities for the fund. AIF has outperformed AFT across various time periods in total NAV terms.
Eagle Point funds released April NAV updates with the Eagle Point Credit Co. ( ECC ) falling 2.5% and the Eagle Point Income Co. ( EIC ) falling marginally. These funds have rallied strongly and are now at double-digit premiums - ECC is near a sky-high 30% premium. The implied view here is "yes I know the market demands yields for CLO Equity at around 15-20% but I’m happy to take a third less" - something which doesn't make a ton of sense to us.
Another CLO Equity CEF - Oxford Lane Capital ( OXLC ) - has not rallied as sharply so the valuation difference between OXLC and ECC is unusually high - around 15-20% or so. There is some uncertainty here as OXLC has not released the April NAV.
For further details see:
CEF Weekly Review: Comparing Yield To Long-Term Performance Requires Care