NMI - CEF Weekly Review: Discount Pro-Cyclicality Is Not Fully Rational
2023-07-15 08:55:25 ET
Summary
- We review CEF market valuation and performance through the first week of July and highlight recent market action.
- CEFs were roughly flat on the week as NAVs fell while discounts remained resilient.
- CEF discounts tend to be procyclical, which remains an odd but welcome feature of the CEF market.
- We highlight a number of CEF distribution changes.
Welcome to another installment of our CEF Market Weekly Review, where we discuss closed-end fund ("CEF") market activity from both the bottom-up - highlighting individual fund news and events - as well as the top-down - providing an overview of the broader market. We also try to provide some historical context as well as the relevant themes that look to be driving markets or that investors ought to be mindful of.
This update covers the period through the first week of July. Be sure to check out our other weekly updates covering the business development company ("BDC") as well as the preferreds/baby bond markets for perspectives across the broader income space.
Market Action
CEFs were roughly flat on the week as most sector NAVs were down while discounts tightened for most sectors.
Discounts remain fairly wide even as the CEF market has held up well since the start of the year.
Systematic Income
The chart below shows a plot of high-yield corporate bond credit spreads (x-axis) and credit CEF discounts (y-axis). This is a nice way of looking at discounts as discounts are correlated to overall market sentiment (discounts tend to widen when markets drop / credit spreads widen and vice-versa).
What the chart also shows is that the current discount level (marked by the red dot) is fairly wide relative to the historical range conditional on today's credit spreads. They have only been meaningfully wider in October 2018 and have tended to cluster between -4 and -8% conditional on a 4% level of credit spreads.
Market Themes
Investors who have spent some time with CEFs tend to know that discount behavior is procyclical. In other words, discounts tend to widen when NAVs drop and vice-versa. The following chart shows that discounts tend to move in the same direction as NAVs i.e. discounts tighten (i.e. generate a positive price return) when NAVs rally (i.e. when NAVs also generate a positive price return).
Systematic Income
On the one hand this makes sense as investor sentiment improves when NAVs rally. And as investor sentiment improves, investors are more likely to put cash to work and buy CEFs, pushing their discounts tighter. As sentiment worsens due to falling NAVs, investors sell CEFs, pushing their discounts wider.
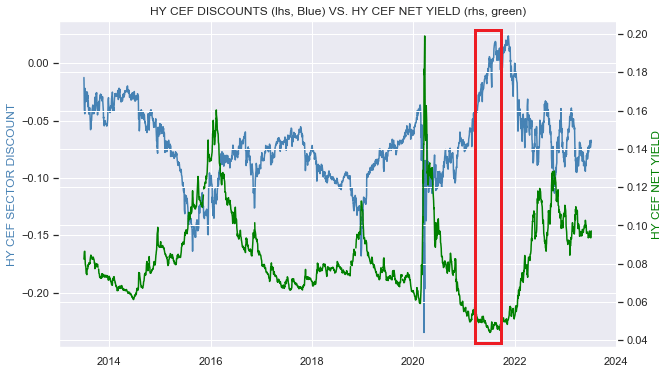
However, this also creates an odd dynamic that we can see in the chart below. When internal credit CEF yields (green line) are low, discounts (blue line) are very tight and when internal credit CEF yields are high, discounts tend to be wide.
For example, in 2021 the yield that HY corporate bond CEFs could generate internally was on the order of just 4-5% - an extremely low level historically. However, investors didn't mind that fact and rushed into credit CEFs, pushing their discounts into premium territory - also an uncharted level.
However, now in 2023, internal yields of HY corporate bond CEFs are on the order of 10%. However, discounts are trading significantly wider at around 7%. Overall, we can see a clear relationship in the chart. When the green line rises (i.e. when HY bond CEF internal yields rise), investors dump the funds, pushing their discounts wider and vice-versa.
This dynamic is there because the majority of investors allocate to CEFs with a momentum perspective. When CEF prices fall, they tend to get out. The fact that internal yields also rise when prices fill is largely irrelevant.
What many investors miss is that there is a double benefit when prices fall. Not only do yields move higher but discounts also move wider, pushing yields even higher. In a more rational market, we should see the opposite. As bond CEF prices fall and yields increase, we should see greater demand for bond CEFs not less. In our view, this dynamic is a great one for discerning investors and an inefficiency that makes CEFs appealing.
Market Commentary
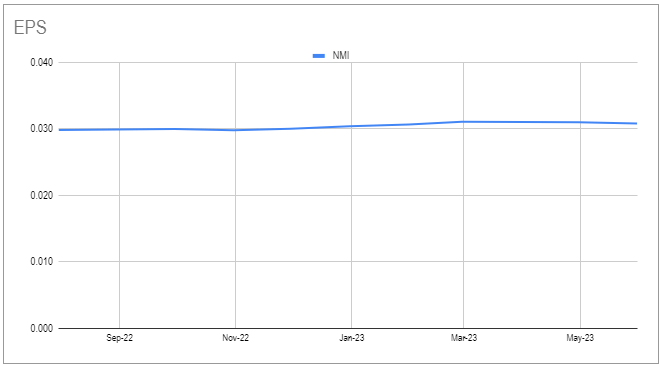
Start of the month brought some CEF distribution changes. Unleveraged Nuveen Muni CEF (NMI) raised its distribution for the second time in the past year. There is not a great reason for this - earnings have been fairly stable. Last July they were $0.03 and this May they were $0.031.
Unleveraged Muni CEFs are not going to have widely changing net income as their assets are longer-term and fixed-rate and they have no leverage. Their bonds are callable and despite the rate backup some are getting redeemed.
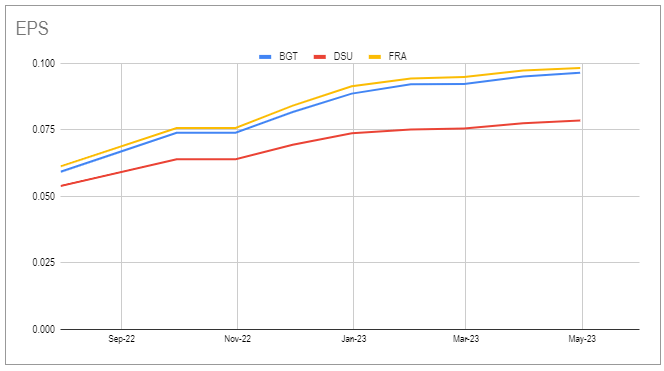
For corporate bonds, the fund would be able to recycle the capital into higher-coupon bonds (because yields are now relatively wide) which would generate a higher level of net income however that's not really the case for Munis as Munis have tended to be issued at coupons of 4% or 5% by convention. Elsewhere, floating-rate BlackRock CEFs [[BGT]], [[DSU]] and [[FRA]] raised again. Their net income has been growing so this makes sense.
For further details see:
CEF Weekly Review: Discount Pro-Cyclicality Is Not Fully Rational