ECCV - CEF Weekly Review: EPS More Instructive Than Coverage These Days
Summary
- We review CEF market valuation and performance through the third week of February and highlight recent market action.
- Nearly all CEF sectors were down as worries about further rises in the policy rate returned on the back of upside inflation surprises.
- We take a look at why distribution coverage figures don't tell the whole story.
- And highlight recent Eagle Point monthly NAVs.
This article was first released to Systematic Income subscribers and free trials on Feb. 19.
Welcome to another installment of our CEF Market Weekly Review where we discuss closed-end fund ("CEF") market activity from both the bottom-up - highlighting individual fund news and events - as well as the top-down - providing an overview of the broader market. We also try to provide some historical context as well as the relevant themes that look to be driving markets or that investors ought to be mindful of.
This update covers the period through the third week of February. Be sure to check out our other weekly updates covering the business development company ("BDC") as well as the preferreds/baby bond markets for perspectives across the broader income space.
Market Action
All but one CEF sector were down on the week, spooked by hawkish Fed-speak as longer-duration sectors underperformed. February has given back some of the strong January performance as investors have begun to evaluate the Fed's terminal policy rate due to a still strong economic backdrop.
Systematic Income
Discounts appear to be rolling over at a similar level they did in December. Arguably, the weaker price action then was driven by tax-loss selling whereas the price action now is linked to worries about further significant rises in the policy rate due to upside surprises in inflation.
Systematic Income
Market Themes
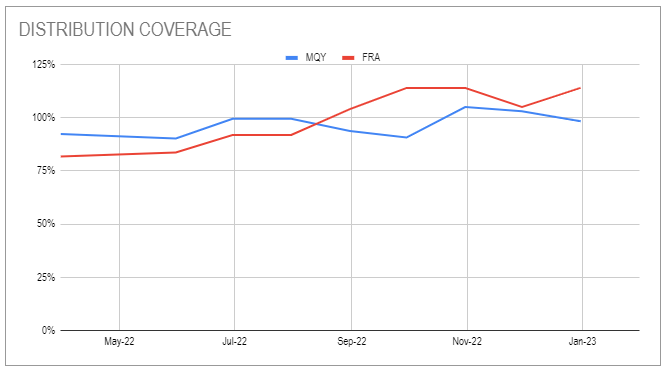
CEF investors, sensibly, like to use distribution coverage as a key metric in their due diligence of various funds. However, distribution coverage has a couple of weak points. Looking at a snapshot of distribution coverage can give a false sense of security if it is around 100% since at that level a fund should have no need to cut the distribution. Investors who like to dig deeper also look at time-series of distribution coverage like the one below from our CEF Tool for a couple of BlackRock CEFs: the MuniYield Quality Fund ( MQY ) and the Floating Rate Income Strategies Fund ( FRA ).
The chart above shows that while FRA is a bit ahead in both trajectory and absolute coverage, both funds have steadily increased coverage over time so there is not much interesting going on here.
However, both the last snapshot and the coverage time-series can easily send the wrong signal and for these funds is where it falls down. The reason the coverage of both funds looks on a fairly similar trajectory is because FRA has increased its distribution this year by 21% while MQY has cut its distribution by 25%. Looking at distribution coverage will not tell investors what they really want to know which is what's happening to the net income of these funds.
To get a better sense of this dynamic we would have to look at EPS i.e. net income. This does a better job of providing investors with what they want to know - how the level of net income is changing over time and what that means for distributions in the medium term. It also prepares investors for turns in markets - for instance if short term rates start moving lower investors know they can expect FRA net income (and likely distributions) to move south and vice-versa for MQY. This is why distribution coverage by itself is typically an inadequate metric of income and distribution prospects.
Market Commentary
Eagle Point CLO Equity CEFs ( ECC ) and ( EIC ) have released their January NAVs. EIC NAV rose 6% and ECC NAV rose 6.5% - the two funds’ NAVs have been trading in line as EIC has grown its CLO Equity allocation, becoming less of a CLO Debt fund.
It’s also interesting to compare total NAV performance over 2022. [[OXLC]] fell 18% versus ECC which fell 10%. OXLC has tended to be a higher-beta fund which is usually attributed to it holding CLO Equity tranches with a shorter reinvestment period.
Systematic Income CEF Tool
What’s also interesting is that EIC underperformed ECC which is unexpected. EIC, being a mixed CLO Equity / Debt fund should, in theory, have been more resilient however it underperformed ECC by 4.5%. Overall, the performance of EIC since inception of around -3% CAGR has been disappointing. For CLO Debt, [[JBBB]] is a good higher-quality ETF option with a double-digit portfolio yield.
Stance And Takeaways
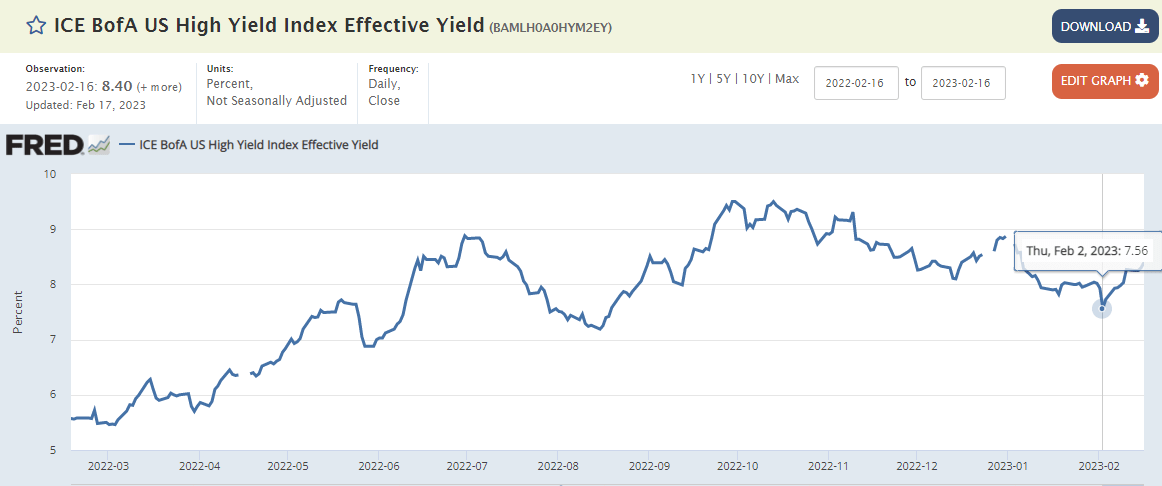
High-yield bond yields have retraced higher, now trading a full 0.84% off their low though about 0.5% below their 2022-end level. If this trend continues it could make sense to rotate from some of the floating-rate focused options such as [[FINS]] and [[DMO]] which we have liked for some time into longer-duration funds such as [[CIK]] and [[EAD]].
For further details see:
CEF Weekly Review: EPS More Instructive Than Coverage These Days