IHIT - CEF Weekly Review: What Drives CEF Portfolio Turnover Costs?
2023-10-14 06:12:53 ET
Summary
- We review CEF market valuation and performance through the first week of October and highlight recent market action.
- CEFs have fallen to their lowest level year-to-date, under pressure from rising interest rates.
- We discuss the key factors that drive CEF portfolio turnover costs.
- And highlight CEF distribution changes.
Welcome to another installment of our CEF Market Weekly Review, where we discuss closed-end fund ("CEF") market activity from both the bottom-up - highlighting individual fund news and events - as well as the top-down - providing an overview of the broader market. We also try to provide some historical context as well as the relevant themes that look to be driving markets or that investors ought to be mindful of.
This update covers the period through the first week of October. Be sure to check out our other weekly updates covering the business development company ("BDC") as well as the preferreds/baby bond markets for perspectives across the broader income space.
Market Action
All CEF sector NAVs but one (Covered Calls) were down on the week, under pressure from rising interest rates, credit spreads and subdued sentiment. Unless returns recover from here, October could be the third down month in a row.
Systematic Income
CEFs have fallen sharply since the most recent peak in late July and are down by close to 10%. Sectors like REITs, Utilities and Munis have borne much of the brunt of the 0.8% rise in 10Y Treasury yields. Loans and Limited Duration sectors have outperformed, as expected.
Systematic Income
CEF returns have fallen to the lowest point year-to-date and remain down for the year.
Systematic Income
CEF discounts are not far from their post-COVID wides. Interest rate volatility, distribution cuts and macro concerns continue to weigh on the space.
Systematic Income
Market Themes
The Invesco High Income 2023 Target Term Fund (IHIT) remains an interesting one to watch for CEF investors. This is not only because of its potential termination and discount compression but what it tells us about the structure of fixed-income markets.
Recall that IHIT has tended to be a lower-beta version of its sister fund IHTA. The main reason for that is that its portfolio has a lower weighted-average maturity than that of IHTA which is a 2024 target term CEF.
However IHIT's lower-beta profile unexpectedly changed around August when its NAV fell a lot more than that of IHTA despite the fact that its portfolio was already 15-20% in cash - in preparation for a potential termination later this year.
Systematic Income
The only possible explanation is that the fund is incurring significant costs unwinding its portfolio. This dynamic raises the question of what drives portfolio turnover costs?
There are really 4 factors at play when thinking about portfolio turnover or trading or bid/offer costs - market liquidity (how difficult it is to trade overall), asset liquidity (how easy it is to trade a given asset conditional on market liquidity), quality / duration factors and size.
Market liquidity at the moment looks fine - volatility is reasonable, credit spreads are fairly tight etc.
As far as asset liquidity - short-dated and mostly investment-grade CMBS don't seem to be all that exotic to warrant large bid/offers. The sector is under some stress however valuations have retraced significantly.
Turning to quality/duration factors, typically lower-quality assets have larger bid offers (in spread terms) and longer-duration assets have larger bid offers (in price terms).
As far as quality, an asset trading at a 10% spread (e.g. CCC bond) will tend to be quoted with a wider bid/offer (e.g. 0.5%) than an asset that trades at a 1% spread e.g. a AA corporate bond (e.g. a 0.05% bid/offer) - i.e. bid/offer tends to be proportional to spreads.
As far as duration (we include both interest rate and spread duration here), the same bid/offer in basis point terms ends up larger in price terms for longer duration assets i.e. a 0.5% bid/offer for an asset with a duration of 10 equates to a chunky 5% bid/offer in price terms (i.e. a cost of 2.5% to trade). The same spread bid/offer of 0.5% for an asset with a duration of 1 costs 0.25% in price terms.
Finally, all else equal, a larger amount of assets is harder to trade than a smaller amount of assets. Dealers will typically quote a wider bid/offer for a larger amount of assets. This is because they take more market exposure by warehousing a larger amount of assets and / or it will typically cost them more to hedge a larger amount while they look to offload it.
The combination of "decent"-quality (i.e. mostly BBB/BB), very low rate and spread duration and a relatively small portfolio means that IHIT should not be incurring significant costs to unwinding its portfolio. There is likely something else going on with IHIT above and beyond "typical" portfolio turnover costs.
Apart from IHIT, these costs are important to keep in mind as they can exert a significant drag on other CEFs, particularly those with either an elevated level of portfolio turnover, a relatively large amount of illiquid assets or a lower-quality portfolio.
Market Commentary
Start of the month brought some CEF distribution news. For BlackRock this touched BTT - their lower duration 2030 target term fund, a hike for the loan/HY bond fund BLW and cuts for 3 equity CEFs: BMEZ, BSTZ and BIGZ by about a third from previous double-digit distribution rates.
For Nuveen there were a couple of trims in the Muni sector: NMZ and NMCO and small hikes for unleveraged Muni funds NUV, NUW as well as a double-digit hike for JLS, bringing it to a double-digit 10.8% distribution rate. The fund remains off investors' radar and trades at a nearly 16% discount. It remains in the Defensive Income Portfolio.
For Invesco, loan CEF VVR hiked and Eaton Vance once again trimmed EVV and EVG.
PIMCO taxable CEF valuations look pretty odd even without getting into the 26-40% premiums for RCS and PCM. Outside of the 3 expensive funds (PCM, RCS and PTY), valuations aren't cheap but, by PIMCO standards, fairly reasonable, trading mostly at low single-digit premiums or discounts.
Another oddity is in relative value between something like PDO and PHK. The two funds are trading on top of each other at discounts of around 2% which doesn't make much sense.
PHK's management fee is much lower than that of PDO and its total NAV return is higher. The main allocation difference between the two funds is the higher CMBS allocation in PDO so maybe people just can't get enough of CMBS and are happy to pay up for PDO - clearly an odd thing to do.
PAXS trades at only a slightly wider discount, however, its fee is higher than that of PDO so in that sense it's equally as expensive as PDO versus PHK.
CEF Tool Update
We have highlighted a number of times the tendency by investors (and many analysts) to choose the wrong peer group for gauging the performance of individual CEFs. The combination of fairly inflexible sectors and, frankly, mistakes by CEFConnect means investors are getting the wrong end of the stick in CEF analysis.
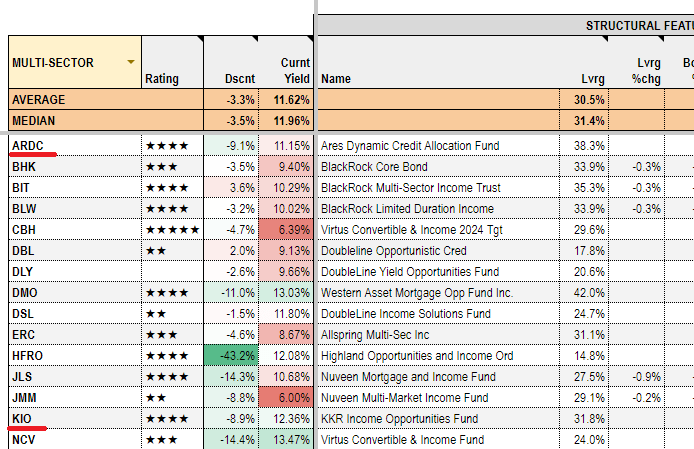
Credit CEFs like KIO and ARDC are, roughly, evenly matched between bonds and loans i.e. fixed-rate and floating-rate assets. These funds don't fit neatly into the usual High Yield (i.e. high-yield corporate bond) and Loan sectors. This makes sector comparisons difficult, particularly when we think about returns. This is because a 50/50 bond/loan fund has a significantly different duration than either a bond fund or a loan fund.
For instance, comparing KIO to its "peer" group of High Yield CEFs (where CEFConnect puts it) will send the wrong signal over a period when long-term rates have moved significantly. It will make KIO look either better or worse than warranted, not by virtue of its own alpha but because of an external market tailwind or headwind.
For this reason we moved both funds to the "Multi-Sector" sector which already hosts CEFs that allocate across a broader spectrum of credit assets. This is different than what CEFConnect or CEFdata do but it makes more sense.
Stance and Takeaways
The recent rise in longer-term Treasury yields alongside fairly modest corporate bond credit spreads and an inverted yield curve means higher-quality / medium-duration assets are fairly attractive in this environment.
Systematic Income
If the current trend persists we will consider adding more to our preferred and Muni allocations which take advantage of these market factors.
For further details see:
CEF Weekly Review: What Drives CEF Portfolio Turnover Costs?