CGDV - CGDV ETF: A Competent ETF But Not Quite A Buy
2023-12-05 15:48:46 ET
Summary
- CGDV has better qualities than the benchmark ETF but the pace of dividend growth looks set to slow even further.
- We think the dividend qualities of CGDV's top holdings are solid, and its exposure to the tech sector could abet it as well.
- Despite a largely favorable take on this product, we conclude with some thoughts on why a fresh long position may not be too conducive at this juncture.
Better Than The Benchmark, But Payouts May Dip
The Capital Group Dividend Value ETF ( CGDV ) is a relatively new actively managed ETF, having made its debut on the bourses back in February 2022. Interestingly enough, despite its limited trading history of less than two years, it has still managed to amass close to $5bn in AUM!
So, what makes CGDV such a big draw?
Well, as far as the underlying investment objective goes, we don’t believe there’s anything overly unique about CGDV’s aspirations. Basically, the goal here is to conjure up a portfolio of dividend-paying stocks, (or those with the potential of paying dividends) that can generate income that exceeds the average yield of the S&P 500.
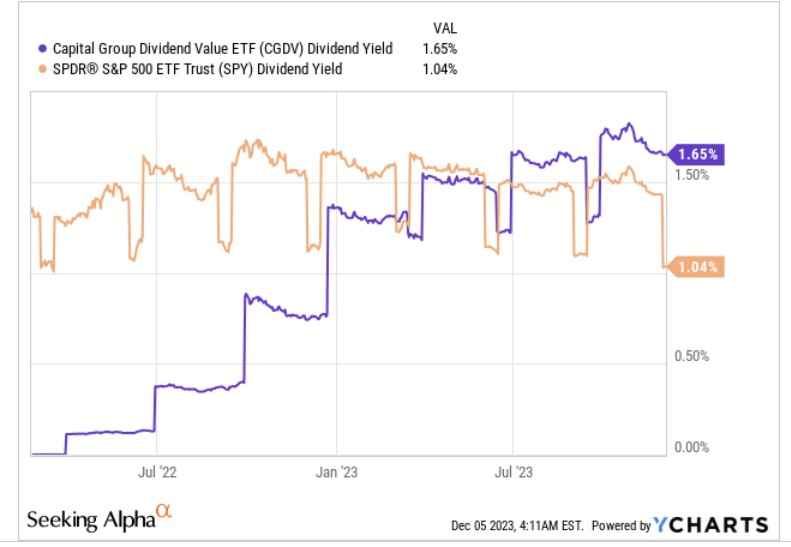
Has CGDV been able to execute on that front? Well, the image below shows us that it's only in H2 of this year, where CGDV's yield has managed to overtake the yield of the S&P 500. As things stand, the positive differential is quite reasonable at over 60bps, although a 1.65% figure isn’t exactly pulling up trees, when you consider that the median yield of all ETFs is almost 100bps better at 2.55% .
YCharts
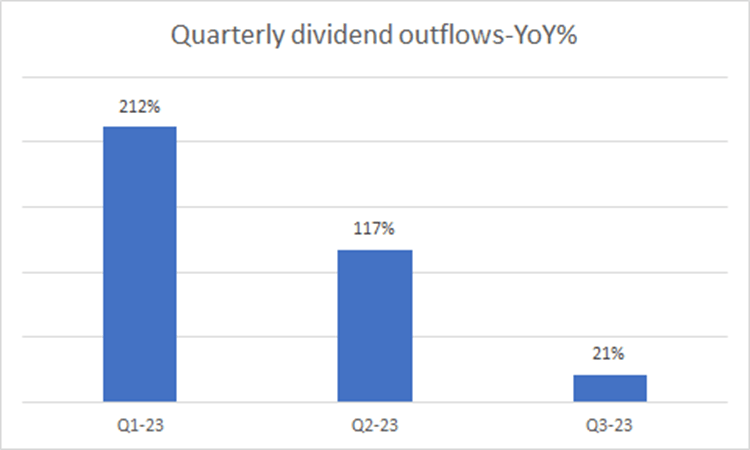
Now given that the yield comfortably beats that of the SPY, investors may want to dial down their expectations for the Q4 outflow. It’s worth noting that CGDV has already been exhibiting a trend of lower dividend growth across the first three quarters. Also, in Q4 last year, the payout was exceptionally steep at 0.1394, so given the tough base, we think it would be reasonable to expect a continuation in the trend of YoY declines, probably to single-digit levels, or even a YoY decline.
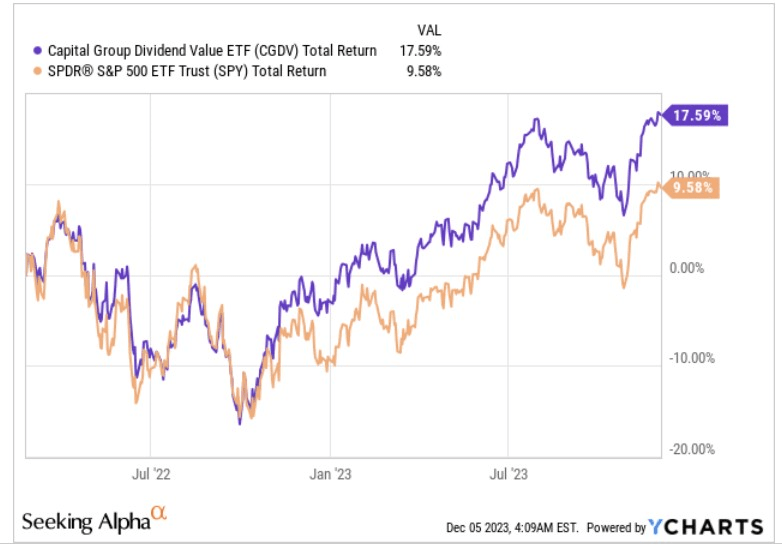
Now when you combine the income facet, alongside the capital appreciation angle, you get a pretty impressive narrative. All in all, since its inception, note that CGDV has managed to outperform the benchmark by 1.83x.
YCharts
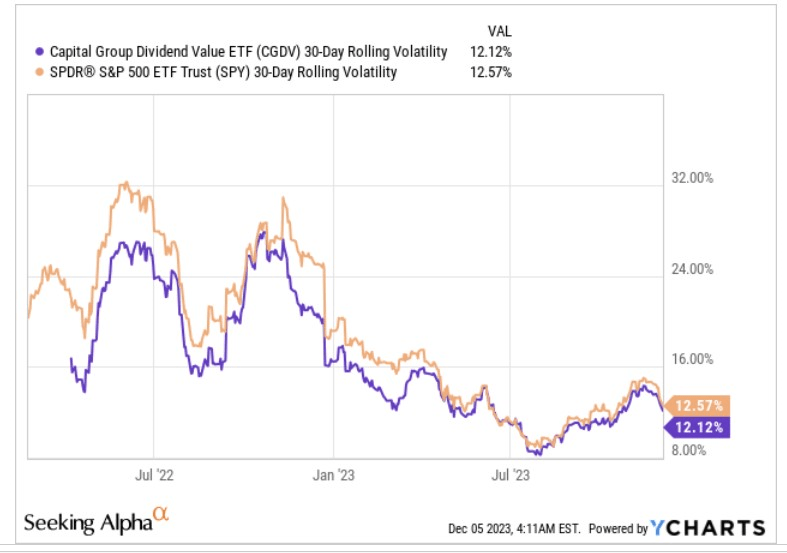
CGDV’s allure is also enhanced by the fact that it comes across as a relatively low-risk vehicle compared to the S&P 500. Note that since its inception, the rolling volatility profile has consistently lagged that of the S&P 500, although in recent periods that gap has compressed.
YCharts
The Dividend Credentials Of The Top Holdings Look Solid
CGDV focuses on roughly 50 stocks, but the top 10 stocks alone have a meaningful aggregate weight of over 40% and will play a key role in CGDV’s fortunes. When we review some of the dividend-oriented sub-plots of these top holdings, we feel quite enthused.
Companies with longer track records of paying dividends are typically loath to bring through dividend cuts, and thus there’s an inherent reliability in pursuing these names. When it comes to CGDV’s top holdings, note that on average, these stocks have typically been paying dividends for 22 years, with at least five stocks having paid dividends for over three decades.
Seeking Alpha
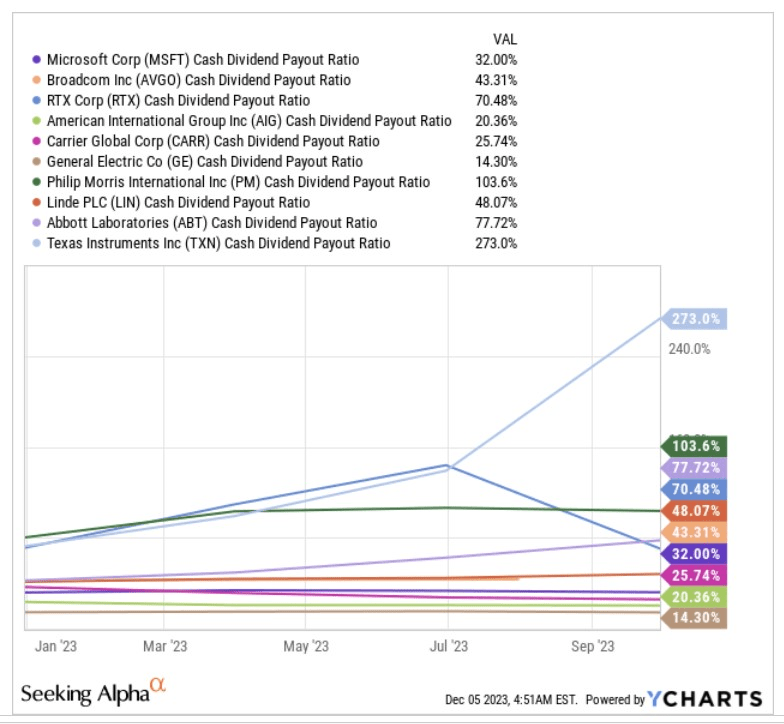
It isn't just the longevity that brings a degree of reassurance. Ideally, you also want these stocks to be in a position to have ample FCF that covers the dividend. Given that the operating cash flow (OCF) position isn't skewed by non-cash items, it makes greater sense to focus on OCF-related metrics rather than EPS coverage metrics. In that regard, one may consider looking at the cash dividend payout ratio which measures the total cash dividends paid out as a function of the operating cash flow less CAPEX and preferred dividends. From the image below what we can see is that with the exception of Texas Instruments ( TXN ), and Philip Morris ( PM ), most of these stocks generate ample FCF to cover their dividends (taking out both those names, the average cash payout works out to a healthy ratio of over 41%).
YCharts
Tech Sector Exposure Is Useful
The other major theme to pick out is CGDV’s exposure to the tech sector which has the highest weight at 22%. We’ve spotted quite a few encouraging tailwinds which bode well for the future.
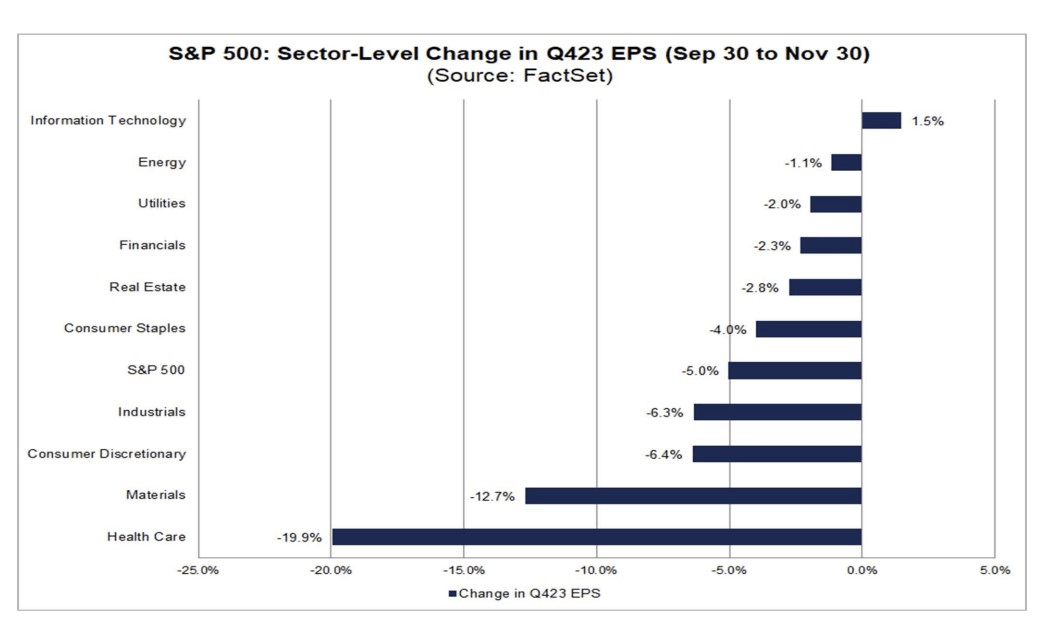
Firstly, it looks like this is the only sector that is currently witnessing any upward revisions to aggregate forward EPS estimates. Data from FactSet shows that whilst all other sectors have seen downward revisions to their Q4 EPS estimates, CGDV has witnessed a benefit of 1.5%.
FactSet
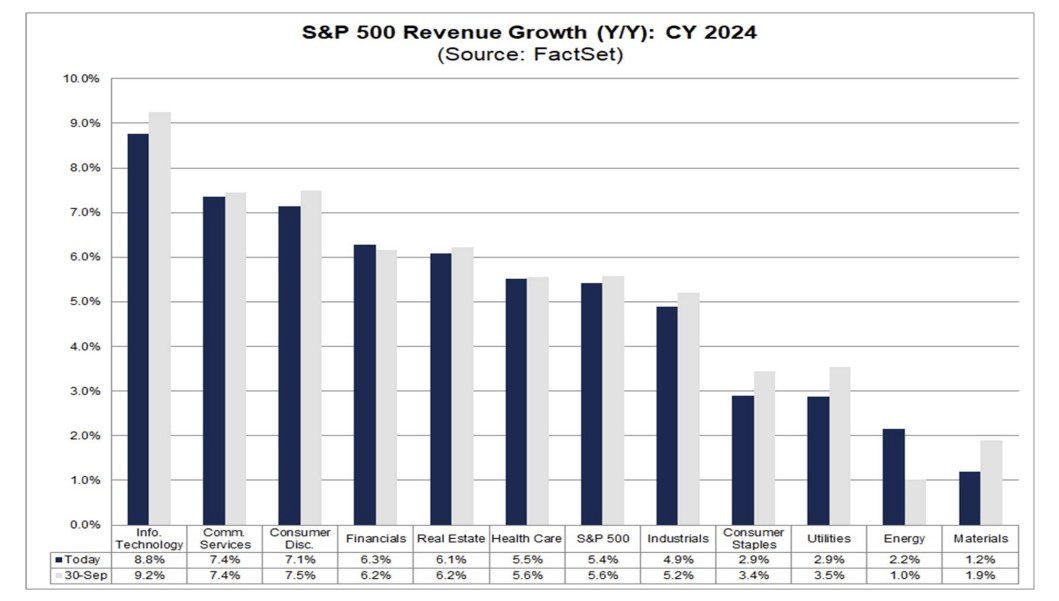
It’s not just that, even next year, it looks like this is the sector with the most favorable topline outlook, with expected growth of 9%.
FactSet
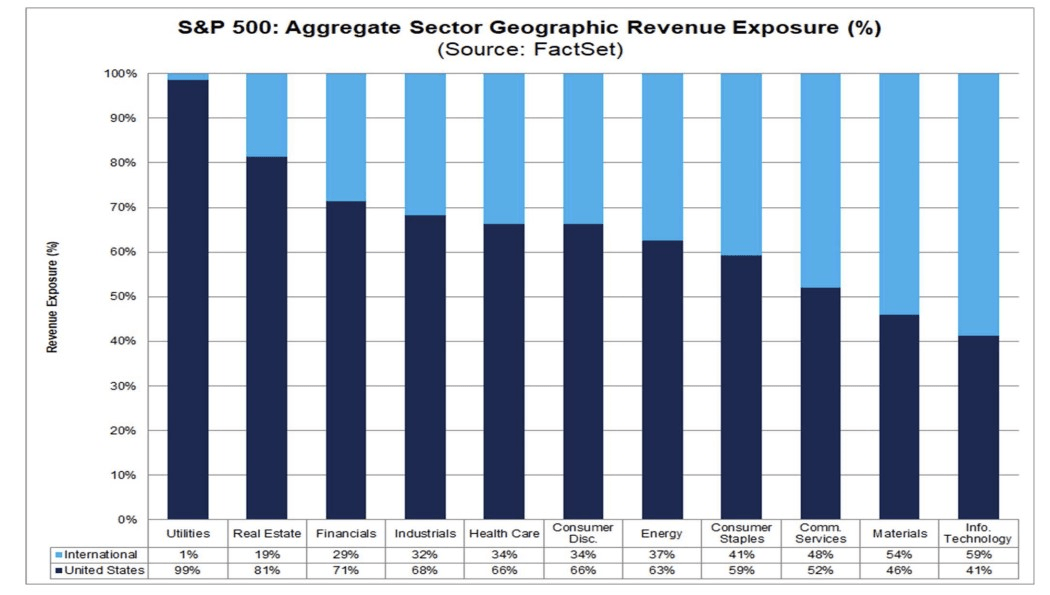
We also appreciate the fact that the tech sector is favorably exposed to the international markets (59% exposure). We’ve seen the 10-year yield come off quite significantly over the past month, and the Feds Futures Market now expects an overwhelming possibility of five 25bps cuts next year, which may dampen interest in the dollar even further. With dollar weakness expected to linger, this could improve the competitive positioning of US tech in the global markets.
FactSet
Closing Thoughts
Whilst we have been mostly favorable with our commentary on CGDV so far, we don’t think it would be the best time to kickstart a long position. Here are a few reasons why.
Firstly, it's worth considering that the pace of dividend growth across the US has been slowing. It has been down fo r eight str aight quarters, and most recently in Q3, the pace of the YoY growth only came in at a miserly pace of 0.5%.
Janus Henderson
Secondly, we would point to the fact that this is very much a large-cap oriented fund (80% large-caps and only 20% mid and small-caps) and we don’t think large-caps offer great value at this juncture. The chart below contextualizes the large-cap to small-cap ratio which is now 19% higher than the mid-point of the long-term range.
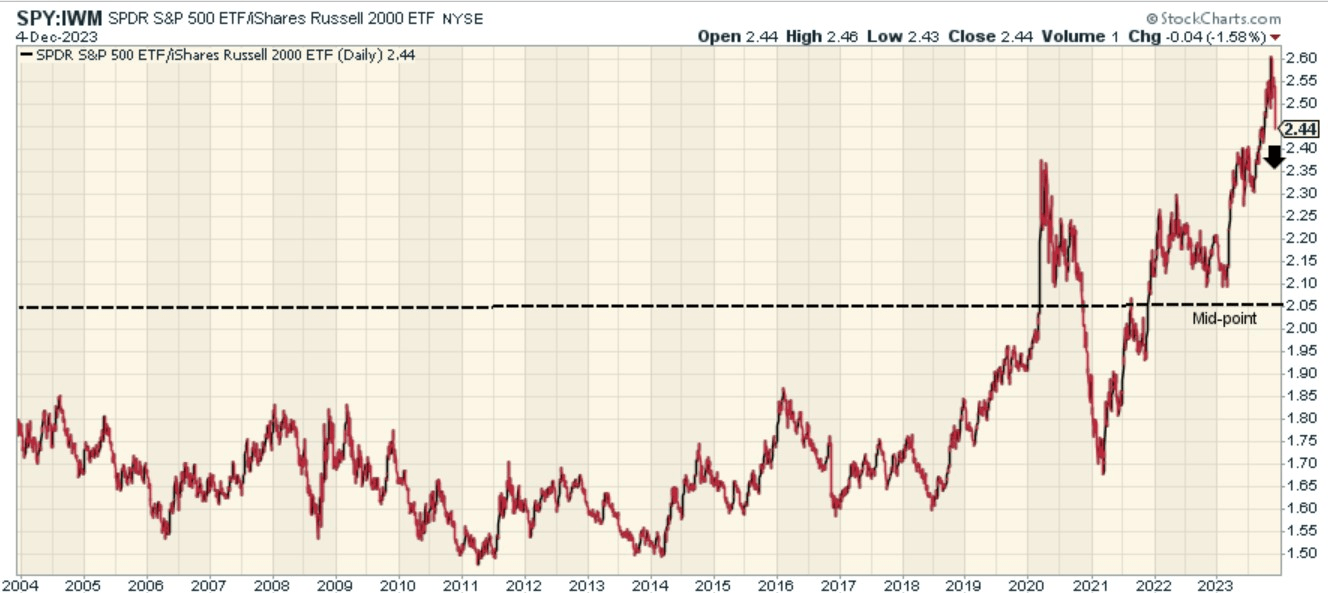
StockCharts
Finally, when it comes to CGDV’s price imprints, what we can see is that since the gap-down in mid-June 2022, the ETF has been on a rather healthy uptrend, which has taken place within a certain ascending channel. Right now, the price is in the midst of re-testing previous highs seen in late July (from where there was a reversal), and we don’t think that’s a conducive point to be going long. Rather, we think the more suitable entry point could be somewhere closer to the lower boundary of the channel at around sub $26.5.
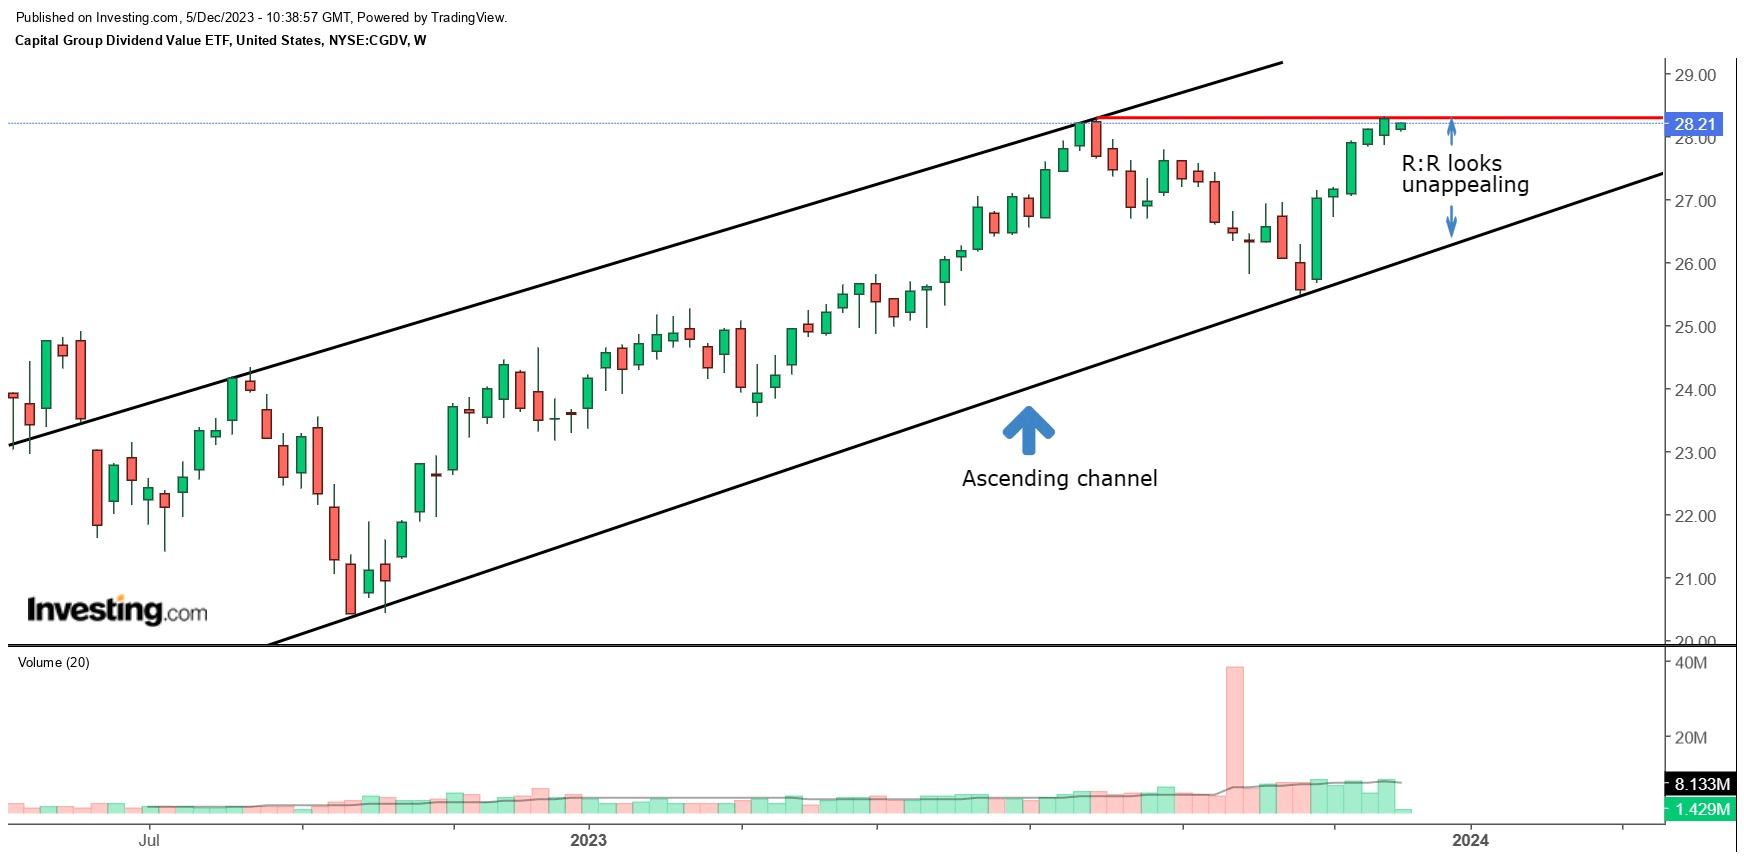
Investing
For further details see:
CGDV ETF: A Competent ETF, But Not Quite A Buy