CGDV - CGDV: High Quality But Weak Yield A Lot To Dislike On The Value Front
2023-12-06 13:10:01 ET
Summary
- CGDV offers an active take on the value factor with an income ingredient.
- CGDV delivers an interesting factor story, but certainly not for value or dividend maximalists, since it has exposure to numerous richly priced stocks.
- I appreciate the fund's strong quality characteristics coupled with its remarkable performance since inception.
- Nevertheless, I am not particularly impressed by its factor mix, so I would prefer to maintain the rating today.
The Capital Group Dividend Value ETF (CGDV) offers an active take on the value factor with an income ingredient. I have been covering this investment vehicle since January 2023, with the most recent analysis published in April. Today's note is supposed to provide a necessary update on the fund's factor exposure changes to decide whether a rating upgrade is justified.
A strategy recap
As described on its website , CGDV is an actively managed vehicle, with the goal being:
To produce consistent income that exceeds the average yield of the S&P 500 by focusing on companies that pay dividends or have the potential to pay dividends.
As I have already emphasized in the previous note, the fund might invest in non-U.S. stocks. As said in the prospectus :
The fund may invest up to 10% of its assets in equity securities of larger companies domiciled outside the United States.
So investors should understand that minor FX risks do exist. Below is the list of stocks with country codes other than 'US' in their ISIN that I found in the holdings dataset as of December 4, where 'CA' stands for Canada, 'IE' for Ireland, 'GB' for Great Britain, and 'LR' for Liberia.
| Ticker |
| Company |
| Weight |
| ISIN |
| ( CNQ ) |
| CANADIAN NATURAL RESOURCES |
| 1.68% |
| CA1363851017 |
| ( CVE ) |
| CENOVUS ENERGY INC |
| 0.88% |
| CA15135U1093 |
| ( TFII ) |
| TFI INTERNATIONAL INC |
| 0.61% |
| CA87241L1094 |
| ( BTI ) |
| BRITISH AMERICAN TOBACCO PLC |
| 2.27% |
| GB0002875804 |
| ( LIN ) |
| LINDE PLC |
| 2.93% |
| IE000S9YS762 |
| ( MDT ) |
| MEDTRONIC PLC |
| 0.99% |
| IE00BTN1Y115 |
| ( RCL ) |
| ROYAL CARIBBEAN CRUISES LTD |
| 1.63% |
| LR0008862868 |
For investors unfamiliar with RCL, which is headquartered in Miami, Florida, I should quote page 2 of its Form 10-K :
Royal Caribbean was founded in 1968 as a partnership. Its corporate structure has evolved over the years and, the current parent corporation, Royal Caribbean Cruises Ltd., was incorporated on July 23, 1985 in the Republic of Liberia under the Business Corporation Act of Liberia.
CGDV adds and removes stocks periodically. For example, as I was preparing the note for a few days, I noticed that between November 29 and December 4, the fund removed Baker Hughes ( BKR ) and added Amazon ( AMZN ). And since the end of March, the fund has replaced about 8.5% of the portfolio, removing such stocks as Public Service Enterprise Group Incorporated ( PEG ), Stryker ( SYK ), and Prologis ( PLD ), etc., and adding United Rentals ( URI ) and Alphabet ( GOOGL )(GOOG), to name a few. These changes resulted in shifts in the sector mix, with CGDV now having no exposure to real estate, compared to 70 bps (via PLD) in March.
A fresh look at factor exposures
The first factor to review today will be value. Here, I should acknowledge that, depending on the definition, investors do get some notable value exposure with this ETF, but with numerous nuances, as usual.
More specifically, my calculations show CGDV's earnings yield at 5.1% (December 4), which certainly looks robust assuming the weighted-average market cap is at $400.8 billion, indicating the ETF has an overweening exposure to traditionally richly priced mega caps. For context, the iShares Core S&P 500 ETF ( IVV ) has an EY of about 4.3%. Nevertheless, as I have already emphasized in the previous article, investors should understand that the EY here is driven mostly by tobacco, oil, and chemicals. For instance, if the fund had no exposure to British American Tobacco ( BTI ) (I used the U.S.-quoted stock for the analysis instead of the London-quoted BATS held by the fund) and Altria Group ( MO ), which together account for only 3.3% of the net assets, its EY would drop to 4.5%. Without Celanese ( CE ), a firm with a substantial portfolio of high-performance engineered polymers that it sells globally, the yield would be 4.8%, precisely like if the fund did not hold EOG Resources ( EOG ), an oil & gas company focused on the Delaware Basin and South Texas. But the EY is, obviously, just the very tip of the iceberg, and there are a few other parameters worth discussing.
| Metric |
| March |
| December |
| Market Cap |
| $283.7 billion |
| $400.8 billion |
| EY |
| 5.68% |
| 5.1% |
| P/S |
| 3.59 |
| 4.44 |
| Fwd EPS |
| 7.33% |
| 7.48% |
| Revenue Fwd |
| 5.68% |
| 7.93% |
| ROE |
| 24.31% |
| 28.48% |
| ROA |
| 8.81% |
| 9.25% |
| Fwd DY |
| 2.43% |
| 2.21% |
| Relatively Overvalued |
| 54.3% |
| 65.1% |
| Relatively Undervalued |
| 15.3% |
| 11.9% |
| Top Quality |
| 89% |
| 91.9% |
| Low Quality |
| 1.5% |
| 1.3% |
Calculated using data from Seeking Alpha and the fund. Holdings as of December 4; financial data as of December 5
First, I should briefly explain why the WA market cap has risen more than 1.4x. The main culprits are the four $1 trillion club members, including AMZN, Apple ( AAPL ), GOOGL, and Microsoft ( MSFT ), with a combined weight exceeding 10%. In March, we saw only three such names in the portfolio. This also resulted in a higher P/S of 4.4x. But this is not the main disappointment. The primary problem is that the share of stocks with a B- Quant Valuation grade or higher ('Relatively Undervalued' in the table above) fell to below 12%. Meanwhile, those with a D+ rating or worse now account for more than 65%. This is a suboptimal proportion.
Regarding quality, there is still close to nothing to criticize, as approximately 92% of the holdings have a B- Quant Profitability grade or better. Capital efficiency indicators are at a healthy level. Growth characteristics (forward revenue, EPS growth rates) are also generally fine.
What is CGDV offering regarding dividends now?
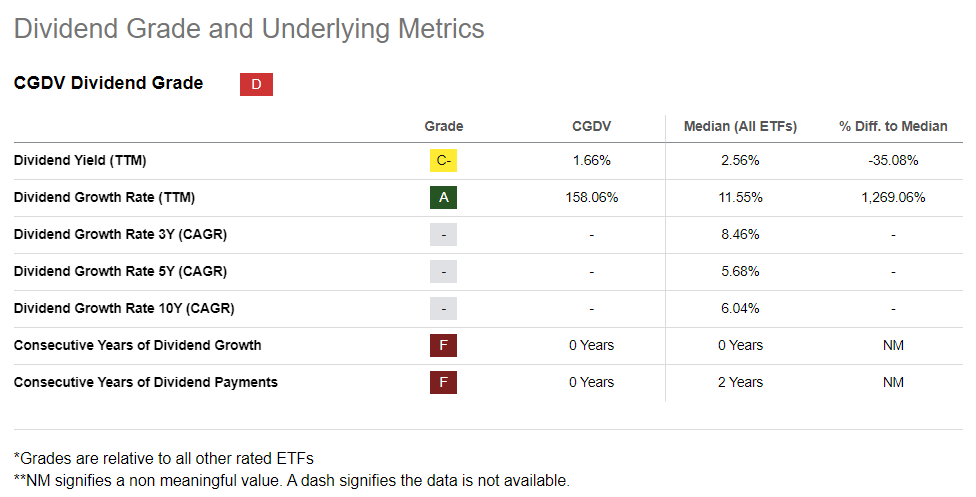
With this ETF, investors get solid dividend consistency and safety, but not much yield.
| Quant Grade (B- or higher) |
| Weight |
| Dividend Consistency |
| 62.1% |
| Dividend Safety |
| 76.4% |
| Dividend Yield |
| 36.3% |
Calculated using data from Seeking Alpha and the fund
One of the culprits is that the strategy is rather flexible, and investors might have to tolerate exposure to companies that, surprisingly, do not pay a dividend at this juncture, but "have the potential to pay dividends." I found six such stocks, with a total weight of 7.4%, including the above-mentioned RCL and GOOGL. Certainly, this has also eaten into the portfolio's weighted-average dividend yield, which currently stands at just 2.18%. CGDV itself has a DY of only 1.66%.
Next, I should mention that tobacco stocks are again among the main contributors here. For example, without MO and BTI, which both have TTM DYs approaching 9%, the weighted-average figure would drop to 1.88%.
| TTM DY |
| Div Growth 3Y |
| Div Growth 5Y |
| 2.18% |
| 11% |
| 6.4% |
Calculated using data from Seeking Alpha and the fund
Meanwhile, dividend growth characteristics look robust, especially the 3-year CAGR. For context, below is the table comparing the weighted-average CAGRs of the portfolios of the ProShares S&P 500 Dividend Aristocrats ETF ( NOBL ) and the WisdomTree U.S. LargeCap Dividend Fund ETF ( DLN ) from my November article .
| Fund |
| Div 3Y CAGR |
| Div 5Y CAGR |
| DLN |
| 9.9% |
| 9.5% |
| NOBL |
| 6.8% |
| 7% |
Calculated using data from Seeking Alpha and the fund
Final thoughts
Since its launch in February 2022, CGDV has delivered a fairly healthy total return, not only beating the market proxied by IVV but also a few peers, including the Schwab U.S. Dividend Equity ETF ( SCHD ), the Global X S&P 500 Quality Dividend ETF ( QDIV ), and the SPDR Portfolio S&P 500 High Dividend ETF ( SPYD ). The data below are for the March 2022-November 2023 period. The downside here is its maximum drawdown (delivered during March-September 2022), which is the weakest in this group. Nevertheless, in the autumn of last year, CGDV recovered much quicker than IVV, managing to beat it by about 6.2% (a negative total return of 4.83% vs. 11.02% for March-December 2022).
| Portfolio |
| IVV |
| CGDV |
| QDIV |
| SCHD |
| SPYD |
| Initial Balance |
| $10,000 |
| $10,000 |
| $10,000 |
| $10,000 |
| $10,000 |
| Final Balance |
| $10,744 |
| $11,463 |
| $9,755 |
| $9,979 |
| $9,339 |
| CAGR |
| 4.19% |
| 8.12% |
| -1.41% |
| -0.12% |
| -3.83% |
| Stdev |
| 20.55% |
| 19.52% |
| 19.26% |
| 17.66% |
| 21.91% |
| Best Year |
| 20.75% |
| 20.44% |
| 0.10% |
| 1.45% |
| -2.76% |
| Worst Year |
| -11.02% |
| -4.83% |
| -2.55% |
| -1.63% |
| -3.97% |
| Max. Drawdown |
| -20.28% |
| -20.50% |
| -16.50% |
| -14.18% |
| -19.30% |
| Sharpe Ratio |
| 0.12 |
| 0.31 |
| -0.17 |
| -0.13 |
| -0.24 |
| Sortino Ratio |
| 0.18 |
| 0.47 |
| -0.24 |
| -0.19 |
| -0.33 |
| Market Correlation |
| 1 |
| 0.95 |
| 0.89 |
| 0.88 |
| 0.85 |
Data from Portfolio Visualizer
The fund has also beaten the S&P 500 since the previous article was published on April 2.
Seeking Alpha
In sum, CGDV delivers an interesting factor story, but certainly not for value or dividend maximalists since it has exposure to numerous richly priced stocks, as illustrated by their Quant Valuation grades, even though its weighted-average earnings yield might look attractive. I appreciate the fund's strong quality characteristics coupled with its remarkable performance since inception, yet I am not particularly impressed by its factor mix, so I would prefer to maintain the hold rating today.
For further details see:
CGDV: High Quality, But Weak Yield, A Lot To Dislike On The Value Front