BTAFF - CGDV: Valuation Quality And Performance Are Promising
2023-06-30 15:16:43 ET
Summary
- Capital Group Dividend Value ETF is an actively managed fund investing in dividend stocks.
- It is well-diversified across sectors, but quite concentrated in the top holdings.
- Valuation and quality metrics are better than in the large cap benchmark S&P 500.
- History is short, but promising: The CGDV ETF beats a number of passively managed value ETFs.
This article series aims at evaluating ETFs (exchange-traded funds) regarding past performance and portfolio metrics. Reviews with updated data are posted when necessary.
CGDV strategy and portfolio
Capital Group Dividend Value ETF ( CGDV ) is an actively managed ETF that started investing operations on 02/22/2022. It has a portfolio of 49 stocks, a 30-Day SEC Yield of 1.94%, and an expense ratio of 0.33%. Distributions are paid quarterly.
As described by Capital Group in the prospectus,
the fund invests at least 80% of its assets in dividend-paying common stocks of larger, more established companies domiciled in the United States with market capitalizations greater than $4.0 billion (...) The fund also ordinarily invests at least 90% of its equity assets in the stock of companies whose debt securities are rated at least investment grade (…) The fund may invest up to 10% of its assets in equity securities of larger companies domiciled outside the United States.
The portfolio is divided into segments managed by five individual managers, with a discretionary approach based on their professional judgement. Such an organization offers a lot of flexibility while mitigating risks. On the downside, the fund's strategy is a black box that cannot be duplicated or back-tested.
The fund invests mostly in U.S. companies (94% of equity value) and in large companies (about 80%). The portfolio is quite concentrated: the top 10 holdings, listed in the next table with valuation ratios, represent 41.6% of asset value. Exposure to each of the top three names is above 5%.
| Ticker |
| Name |
| Weight (%) |
| P/E TTM |
| P/E fwd |
| P/Sales TTM |
| P/Book |
| P/Net Free Cash Flow |
| Yield % |
| Broadcom Inc. |
| 6.72% |
| 27.26 |
| 20.53 |
| 10.51 |
| 16.74 |
| 37.88 |
| 2.13 |
| Microsoft Corp. |
| 5.94% |
| 36.32 |
| 34.83 |
| 12.05 |
| 12.85 |
| 65.76 |
| 0.81 |
| General Electric Co. |
| 5.48% |
| 14.46 |
| 52.70 |
| 1.60 |
| 3.73 |
| 28.89 |
| 0.30 |
| Carrier Global Corp. |
| 4.48% |
| 16.77 |
| 19.20 |
| 2.00 |
| 5.19 |
| 36.23 |
| 1.50 |
| Raytheon Technologies Corp. |
| 4.44% |
| 26.13 |
| 19.47 |
| 2.10 |
| 1.98 |
| N/A |
| 2.41 |
| American International Group, Inc. |
| 3.51% |
| 7.46 |
| 8.63 |
| 0.83 |
| 0.99 |
| 11.63 |
| 2.52 |
| Linde plc |
| 2.88% |
| 42.12 |
| 27.51 |
| 5.64 |
| 4.70 |
| 61.75 |
| 1.35 |
| Baker Hughes Co. |
| 2.76% |
| N/A |
| 20.19 |
| 1.45 |
| 2.17 |
| 63.85 |
| 2.42 |
| Abbott Laboratories |
| 2.75% |
| 32.73 |
| 24.48 |
| 4.54 |
| 5.10 |
| 54.57 |
| 1.89 |
| BTI * |
| British American Tobacco plc |
| 2.63% |
| 9.27 |
| 6.85 |
| 2.19 |
| 0.82 |
| 19.04 |
| 8.23 |
* U.S. ticker for convenience. The fund holds shares in the primary exchange.
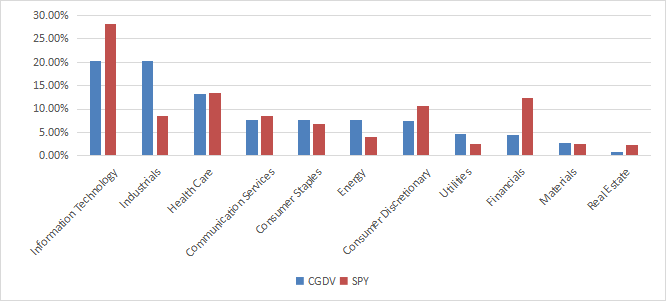
The two heaviest sectors are technology and industrials, tie at 20.2% of assets. Then comes healthcare with 13.2%. Other sectors are below 8%. Compared to the large-cap benchmark SPDR® S&P 500 ETF Trust ( SPY ), CGDV overweights mostly industrials, energy, and utilities. It underweights technology, financials, consumer discretionary, and real estate. As a result, the fund is more diversified across sectors than SPY.
Valuation and quality
As expected, CGDV is cheaper than the S&P 500 regarding aggregate valuation ratios, reported in the table below.
| CGDV |
| SPY |
| P/E |
| 17.17 |
| 21.5 |
| P/Book |
| 2.76 |
| 3.75 |
| P/Sales |
| 2.3 |
| 2.39 |
| P/Cash Flow |
| 13.22 |
| 15.14 |
Data: Fidelity
In previous articles, I have shown how three factors may help cut the risk in a dividend portfolio: Return on Assets , Piotroski F-score , and Altman Z-score . In my ETF reviews, risky stocks are companies with at least 2 red flags among: bad Piotroski score, negative ROA, unsustainable payout ratio, bad or dubious Altman Z-score, excluding financials and real estate where these metrics are unreliable.
Out of 49 holdings, 10 are risky regarding these criteria, and they weigh 14.6% of asset value. This ratio is not very good, but it is acceptable. Based on my calculation of aggregate Altman Z-score, Piotroski F-score and ROA, CGDV is slightly superior to SPY regarding portfolio quality.
| CGDV |
| SPY |
| Altman Z-score |
| 3.92 |
| 3.5 |
| Piotroski F-score |
| 5.82 |
| 5.72 |
| ROA % TTM |
| 9.23 |
| 7.44 |
Performance
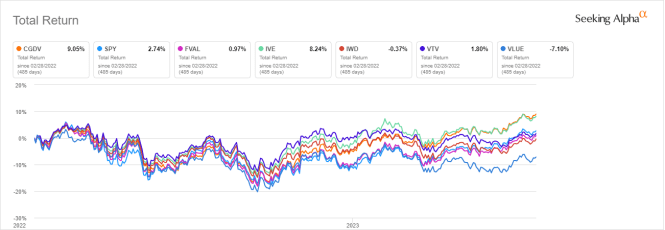
I think it is more appropriate to compare CGDV to value funds than to dividend funds, because the yield is quite low. The next chart plots total returns since 2/28/2022 of CGDV, SPY, and five large and mid-cap value ETFs based on different underlying indexes:
- Fidelity Value Factor ETF ( FVAL ), reviewed here ,
- iShares S&P 500 Value ETF ( IVE ), reviewed here,
- iShares Russell 1000 Value ETF ( IWD ), reviewed here,
- Vanguard Value Index Fund ( VTV ),
- iShares MSCI USA Value Factor ETF ( VLUE ).
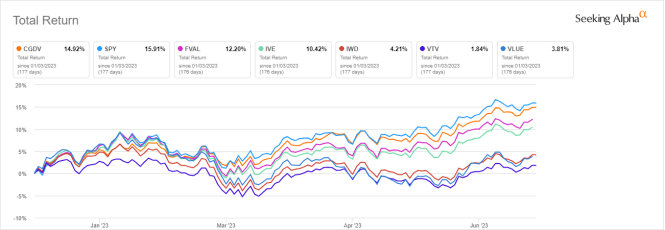
CGDV is the best performer, shortly ahead of the S&P 500 Value Index fund. In 2023 to date, CGDV also beats the other value funds, but it lags SPY by a short margin of 1%.
Takeaway
Capital Group Dividend Value ETF holds 49 dividend stocks based on the discretionary decisions of five portfolio managers. The portfolio is better balanced across sectors than the S&P 500, but it is quite concentrated in the top holdings. CGDV is slightly superior to the large-cap benchmark S&P 500 regarding both valuation and quality metrics. Capital Group Dividend Value ETF has a short, but promising, history: it has outperformed a number of passively managed value ETFs. Its main downside is the lack of transparency in the strategy.
For further details see:
CGDV: Valuation, Quality And Performance Are Promising