CGGR - CGGR: Banner 2023 Amid Growth Rotation Issues Under The Hood
2023-07-03 21:37:11 ET
Summary
- CGGR is a relatively novel investment vehicle targeting U.S. large and mid caps that "appear to offer superior opportunities for growth of capital," also maintaining a modest footprint overseas.
- There are numerous robust growth stories in its portfolio.
- Nevertheless, there are valuation concerns, a few quality disadvantages, as well as performance nuances.
- Its relative expensiveness (the 39 bps ER) also weighs on my sentiment.
Amid the AI frenzy and the market pricing in expectations for more accommodative monetary policy sooner rather than later, investment vehicles targeting long-duration equities are seemingly back in vogue. The Capital Group Growth ETF ( CGGR ), the fund we will be discussing today, is one of the examples, with an active strategy centered on U.S. and international companies that, as put in its prospectus , "appear to offer superior opportunities for growth of capital." Its website provides the following strategy summary,
Seeks growth by investing in a broad group of companies that have potential for capital appreciation. A broad fund that seeks growth of capital as its objective rather than its investment style, meaning that while the fund will predominantly invest in larger, faster growing U.S. companies, managers have flexibility across different geographies and investment approaches in search of capital appreciation.
CGGR has seen a robust run this year, solidly outpacing the iShares Core S&P 500 ETF ( IVV ), which has been slowed down by its value and pure-value components. Moreover, despite having only around 16 full months in the books, CGGR has already amassed a respectable AUM in excess of $2.3 billion.
All these might look like a solid premise for a bullish thesis, yet hasty conclusions should never be made in investing. Alas, CGGR has a few disadvantages revealed upon a more scrupulous analysis, so let us dig in to elaborate on them, also touch upon unobvious strengths, and arrive at a carefully weighted final rating for this vehicle.
Nuances worth understanding about CGGR strategy and portfolio
Favoring long-duration equities, CGGR's tech- and communication-heavy portfolio of 128 equities obviously has a valuation problem. The first factor to discuss is its weighted-average earnings yield of about 3.1%, as per my calculations. This level will be subject to adjustment by the market in case monetary policy surprises to the upside significantly. A 3.1% EY translates into a P/E of over 32.2x, which materially exceeds IVV's 21.9x. Most importantly, compared to other growth-centered funds, this is still fairly expensive. For instance, the iShares S&P 500 Growth ETF ( IVW ) had a 23.6x P/E as of June 30.
Next, the weighted-average market cap stands at $447.3 billion as per my calculations, despite exposure to five $1 trillion league members including Apple ( AAPL ), Microsoft ( MSFT ), and NVIDIA ( NVDA ) among others. CGGR does maintain a small footprint in the mid-cap universe, with slightly more than 4% allocated, but with more than half of the net assets deployed to mega caps, small wonder only 6.1% of its portfolio has a Quant Valuation rating of B- or better (as of July 2), while close to 82% have a D+ rating or worse, which signalizes relative overvaluation compared to respective sectors and historical averages.
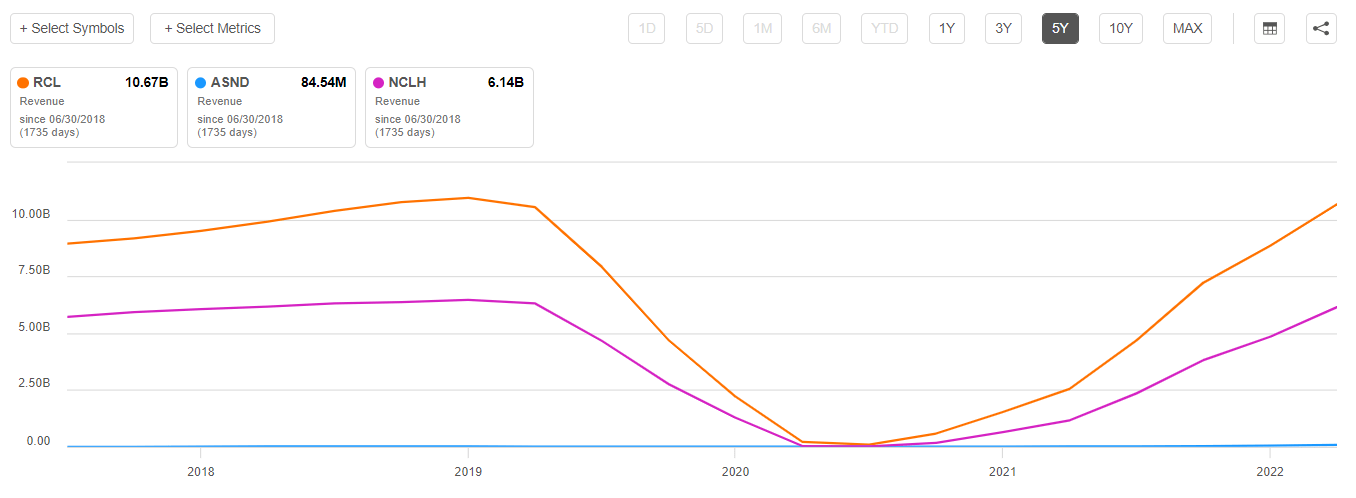
Concerning the growth factor, there is of course something to appreciate about this vehicle. To make the discussion a bit more visual, I have created a chart combining CGGR's holdings' revenue and EPS forward growth rates. Please take notice that to improve its readability, I removed the triple-digit revenue growth rates of the following companies:
| Stock |
| Weight |
| Market Cap |
| Revenue FWD |
| Ascendis Pharma ( ASND ) |
| 0.1% |
| $4.9 billion |
| 249.71% |
| Norwegian Cruise Line ( NCLH ) |
| 0.4% |
| $8.87 billion |
| 142.39% |
| Royal Caribbean Cruises ( RCL ) |
| 0.7% |
| $2.6 billion |
| 113.47% |
Created by the author using data from Seeking Alpha and the fund; data as of July 2
Regarding RCL's and NCLH's rates, it is worth understanding that their spectacular explosive growth stories are mostly the product of the pandemic, which sent their revenues plunging and, as the coronavirus relaxed its grip releasing pent-up demand, they have begun recovering steadily. At the same time, ASND is a biotech company with an entirely different growth pattern.
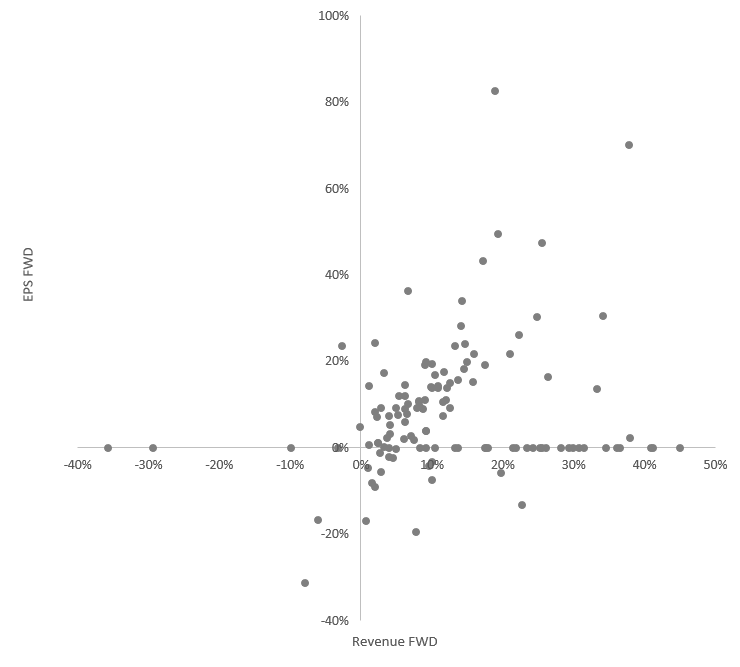
The chart illustrates that a solid deal of the holdings has a revenue forward growth rate of about 20%, though there are a few sales contraction stories as well.
Created by the author using data from Seeking Alpha and the fund
So even though CGGR investors get a WA growth rate of ~14.6%, they still have to tolerate exposure to revenue stagnation & decline stories (about 4.4% of the portfolio), with the notable laggard being Moderna ( MRNA ) which is forecast to deliver the double-digit decline going forward.
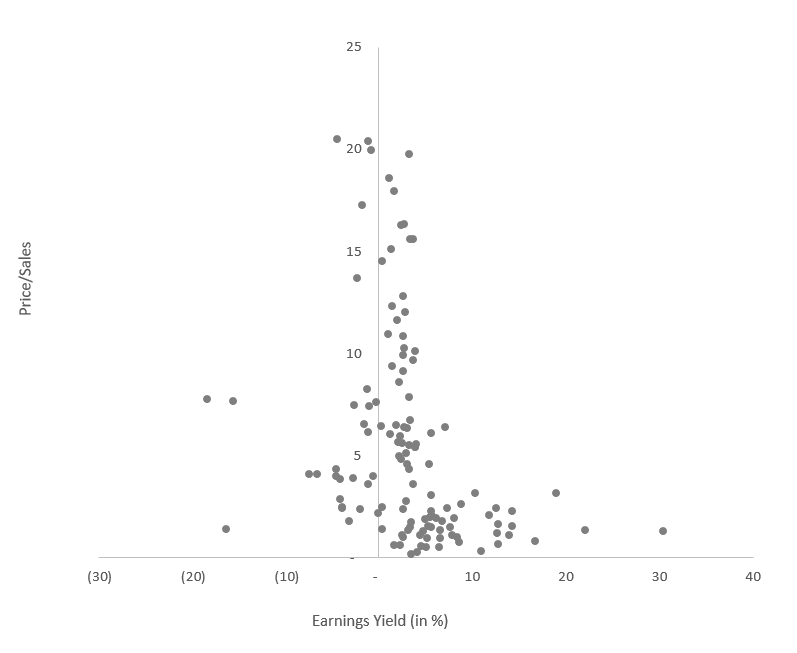
Also, it is worth understanding that the above-mentioned cruise-ship and biotech plays are the top contributors to that rate; with their metrics reduced to 20% for modeling purposes, the figure slips to 13.2%. And as a reminder, the CGGR investors pay about $8.78 per $1 of LTM sales (an 8.78x WA P/S, according to my calculations), which is anything but adequate. The scatter plot below should add a bit more color. The double- and triple-digit P/S ratios for NVDA, ASND, and Karuna Therapeutics ( KRTX ) were removed to improve the readability.
Created by the author using data from Seeking Alpha and the fund
Next, it can also be seen that a few companies have zero EPS growth, which is partly because there are no analyst estimates available or since their LTM earnings are negative. So please remember that the WA forward growth rate of 10.8% I arrived at is heavily impacted by these factors.
Besides, it is worth mentioning that CGGR managed to balance growth exposure with a comparatively strong quality, yet there are still nuances not to be overlooked. First, over 83% of the holdings have a Quant Profitability grade of B- or better, which is solid. However, I would prefer a figure above 90%. Also, there are a few cash burning companies in the portfolio, together accounting for ~5.7% of the holdings.
Performance discussion
As I said earlier, 2023 has been a banner year for CGGR as it has trounced the market represented by IVV. Nevertheless, with more context added, its performance looks less appealing. For example, let us look at its total returns delivered during the March 2022 - June 2023 period compared to passively managed Invesco QQQ ETF ( QQQ ), iShares Russell 1000 Growth ETF ( IWF ), Invesco S&P 500 Pure Growth ETF ( RPG ), iShares Core U.S. Growth ETF ( IUSG ), and iShares Russell Top 200 Growth ETF ( IWY ).
| Portfolio |
| QQQ |
| CGGR |
| IVV |
| RPG |
| IWY |
| IUSG |
| Initial Balance |
| $10,000 |
| $10,000 |
| $10,000 |
| $10,000 |
| $10,000 |
| $10,000 |
| Final Balance |
| $10,762 |
| $10,115 |
| $10,398 |
| $8,649 |
| $10,548 |
| $9,783 |
| CAGR |
| 5.66% |
| 0.86% |
| 2.97% |
| -10.31% |
| 4.08% |
| -1.63% |
| Stdev |
| 28.39% |
| 24.92% |
| 21.58% |
| 25.38% |
| 25.81% |
| 24.39% |
| Best Year |
| 39.14% |
| 26.80% |
| 16.86% |
| 1.53% |
| 32.02% |
| 20.44% |
| Worst Year |
| -22.65% |
| -20.23% |
| -11.02% |
| -14.81% |
| -20.10% |
| -18.77% |
| Max. Drawdown |
| -26.10% |
| -25.33% |
| -20.28% |
| -20.97% |
| -24.47% |
| -23.74% |
| Sharpe Ratio |
| 0.22 |
| 0.03 |
| 0.09 |
| -0.43 |
| 0.16 |
| -0.08 |
| Sortino Ratio |
| 0.32 |
| 0.04 |
| 0.13 |
| -0.56 |
| 0.22 |
| -0.11 |
| Market Correlation |
| 0.92 |
| 0.96 |
| 1 |
| 0.94 |
| 0.95 |
| 0.97 |
Created by the author using data from Portfolio Visualizer
Unfortunately, it underperformed all except for IUSG and RPG. Most importantly, its CAGR is much lower than QQQ's.
It would also be pertinent to add that all the vehicles selected for comparison have lower expense ratios.
| Fund |
| QQQ |
| CGGR |
| IVV |
| RPG |
| IWY |
| IUSG |
| Expense Ratio |
| 0.20% |
| 0.39% |
| 0.03% |
| 0.35% |
| 0.20% |
| 0.04% |
Final thoughts
CGGR is a relatively novel investment vehicle targeting U.S. high-quality large and mid caps that "appear to offer superior opportunities for growth of capital," also maintaining a modest footprint overseas, with names like Paris-based LVMH Moët Hennessy - Louis Vuitton ( LVMUY ) in the portfolio.
After a dismal 2022, when it lost 20.2% in March-December, the fund has been recovering at a solid pace this year, delivering a spectacular run of 27.1%, which secured its A+ ETF Momentum grade. With that being said, I would opt for a more skeptical tone today.
First, the fund's strategy is more of a black box. It is unknown how exactly securities are selected. This might be an advantage nevertheless due to potential secret ingredients other market participants would not replicate, thus giving it an edge and also potentially securing long-term alpha. However, I prefer vehicles that have clear and transparent equity selection & weighting rules. Second, there are valuation concerns, a few quality disadvantages, as well as performance nuances. Its relative expensiveness (the 39 bps ER) also weighs on my sentiment. In sum, CGGR earns a hold rating.
For further details see:
CGGR: Banner 2023 Amid Growth Rotation, Issues Under The Hood