JEPI - Changing My Stance And Loading Up On SCHD
2024-01-08 20:57:03 ET
Summary
- Early last year, I thought SCHD would underperform the S&P500. This has played out as SCHD made negative alpha vs S&P500 of 8.53%. But now I am bullish SCHD.
- I like SCHD's relative underweights vs SPY in: a) Technology due to its premium valuations b) Payment Processing due to decelerating growth c) Retail as that is yet to rebound.
- I like SCHD's relative overweights vs SPY in: a) Asset Management & Custy Banks as I anticipate higher activity b) Soft Drinks & Beverages due to strong growth prospects.
- Valuations wise, SCHD is trading at a 28% discount to the S&P500, providing a good margin of safety.
- Risks wise, SCHD has no exposure to Microsoft, Apple or NVIDIA and positive earnings surprises in these companies can hinder SCHD's alpha vs S&P500.
Performance Review
In last coverage of the Schwab U.S. Dividend Equity ETF ( SCHD ), I had a neutral/hold rating on the ETF. I also believed the JPMorgan Equity Premium Income ETF ( JEPI ) would outperform SCHD . As usual, let's see how these assessments have played out:
SCHD Performance Snapshot since Hunting Alpha's Last Standalone Coverage of SCHD (Seeking Alpha)
SCHD has returned +9.6% on a total shareholder return basis compared to the S&P500 ( SPY )'s 18.13%; a negative alpha of 8.53%. I would call this a meaningful alpha variation and hence a bit of a miss in my assessment. I could have been bolder about my assessment and issued a sell, especially since I correctly believed that SCHD's Alpha Party was over .
Learning from such opportunities for a bolder call, and having drawn confidence in my assessments playing out , in more recent articles such as the one on Ares Capital ( ARCC ) and Berkshire Hathaway ( BRK.B ) ( BRK.A ), I have been a bit bolder in my ratings (which always focus on my relative performance outlook vs the S&P500; the defined benchmark/opportunity cost).
Using article publication dates to measure performance, the JEPI outperformance thesis over SCHD has not really played out either favorably nor unfavorably:
JEPI Performance Snapshot since Hunting Alpha's Last Article on JEPI (Seeking Alpha)
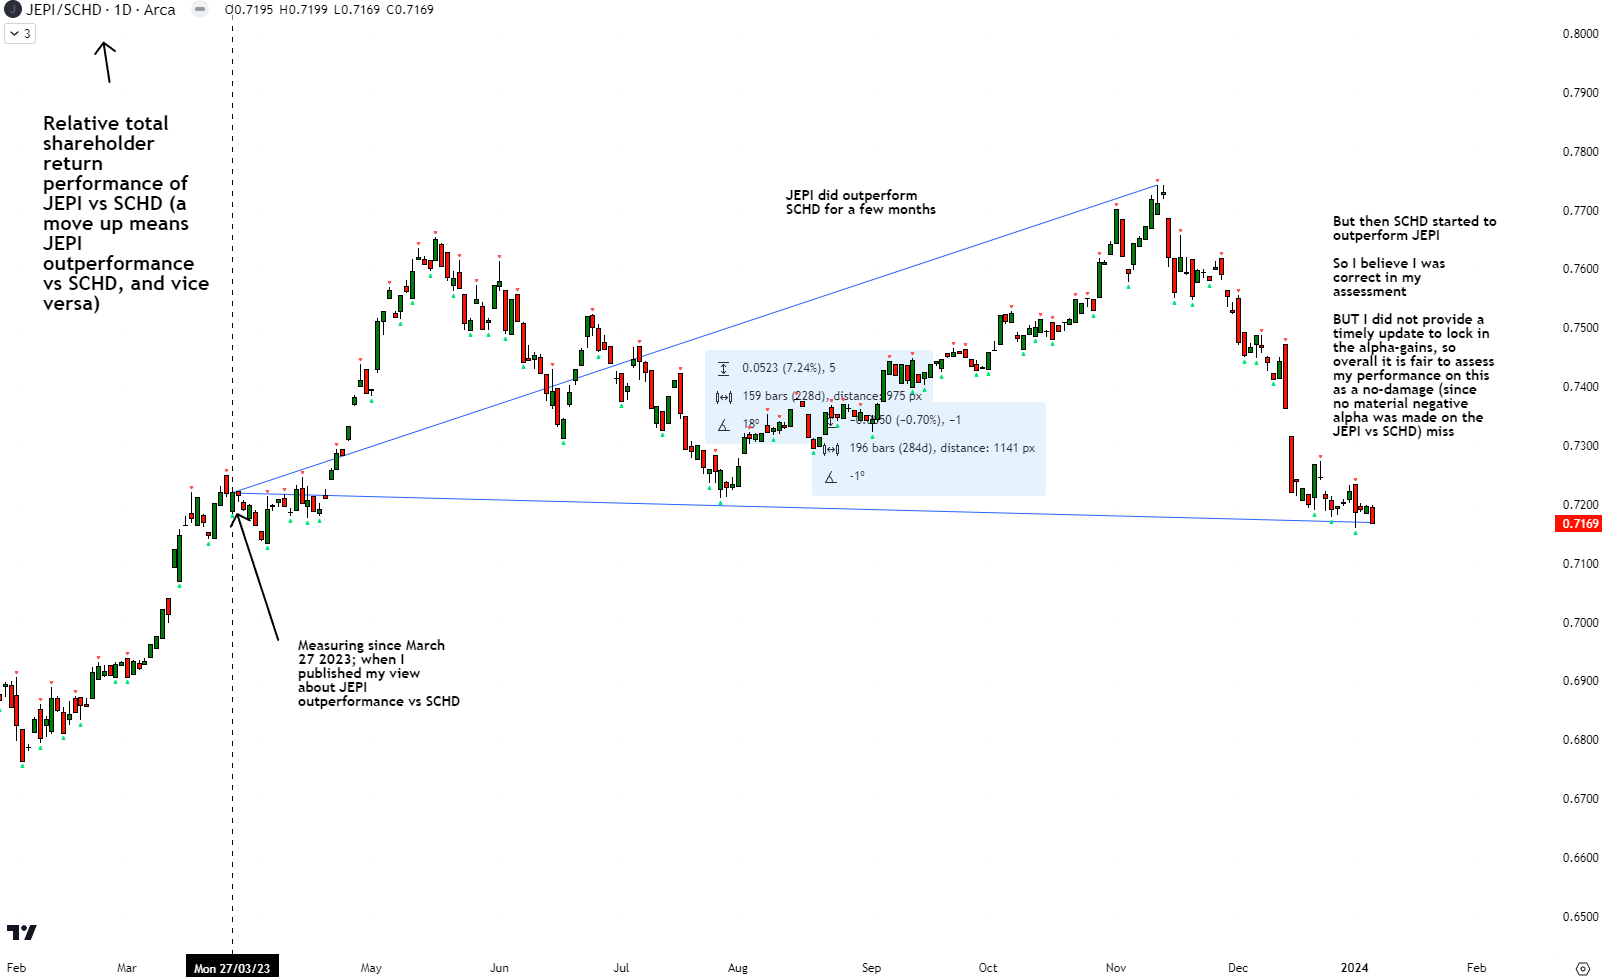
JEPI returned +9.61% compared to SCHD's +9.60% as we saw in the earlier performance snapshot. However, looking at the relative performance profile of JEPI vs SCHD more granularly, it is clear that my thesis did play out rather quickly:
Performance Assessment of Hunting Alpha's JEPI vs SCHD Call (TradingView, Author's Analysis)
However, over the last 2 months and a bit, the alpha generated by JEPI vs SCHD has been mostly nullified to 0. And as I did not provide a timely update on any changed view, I think it is fair to assess my performance here as a no-damage miss (no damage since no material negative alpha was made on the JEPI vs SCHD view).
Upgrading SCHD to a 'Strong Buy'
I am changing my stance on SCHD from the previous 'Neutral/Hold' to a 'Strong Buy' . I believe it will outperform the S&P500 ( SPY ). To justify why, the focus of my analysis will be on comparing the net exposure profile of SCHD vs SPY:
Analyzing net exposures of SCHD vs SPY
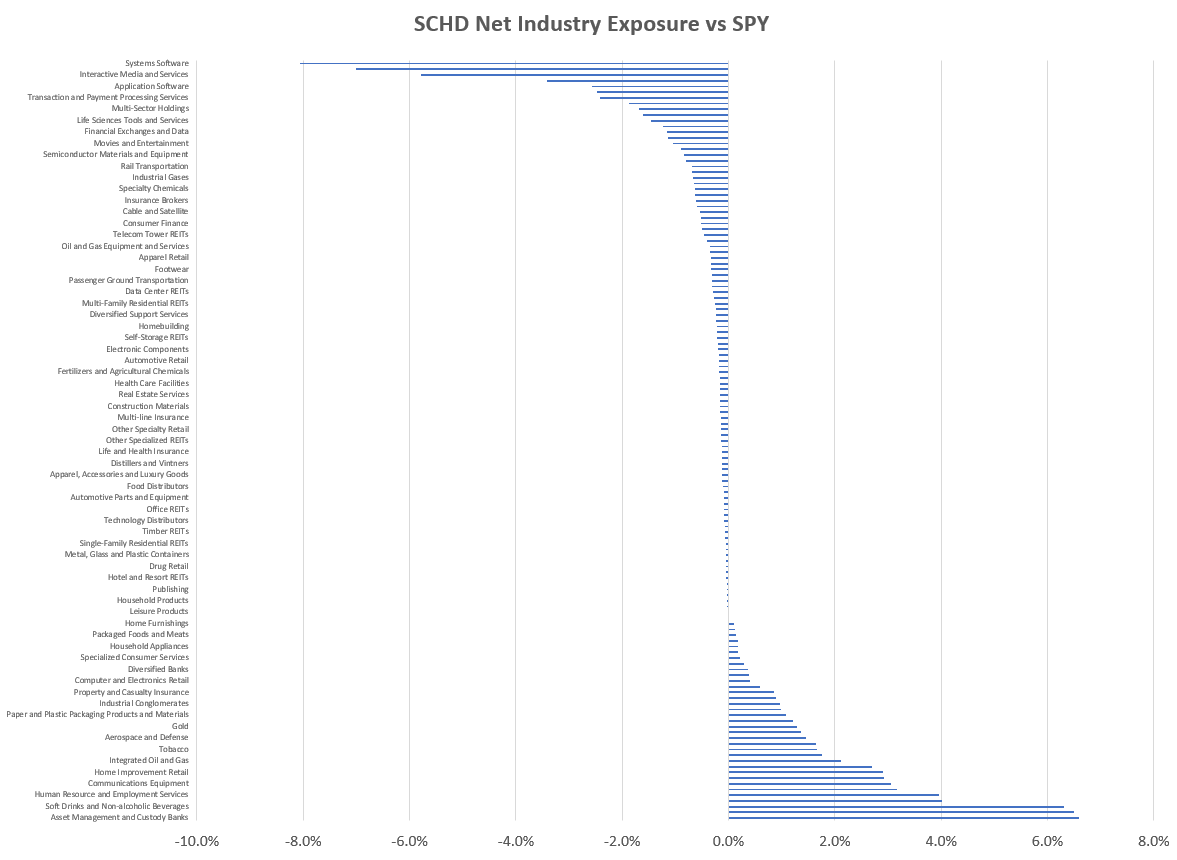
SCHD Net Industry Exposure vs SPY - Chart Form (SCHD, SPY ETF Websites, Author's Analysis)
The chart above shows a graphical summary of the net industry-level overweight and underweight exposures of SCHD vs SPY. The table below shows the values more clearly, with highlights on the key industries that I will discuss, for I believe that particular net exposure is favorable:
SCHD Net Industry Exposure vs SPY - Table Form (SCHD, SPY ETF Websites, Author's Analysis)
Let's also take a step back and look at the net sector-level exposures:
SCHD Net Sector Exposure vs SPY (SCHD, SPY ETF Websites, Author's Analysis)
I draw my thesis for SCHD preference over SPY from this net exposure data. So feel free to refer back to it.
Favorable underweight exposures
Systems and Application Software, Information Technology
SCHD has a 16.0% underweight vs SPY in the Information Technology Sector, with Systems and Application Software making up 10.5% of that overall underweight exposure. I believe this is favorable because the US technology sector is trading at high valuations currently. For example, the iShares U.S. Technology ETF ( IYW ) is trading at a PE of 35.84x compared to the S&P500 SPY's 21.08x. That's a hefty 70% premium, which leaves very little margin of safety.
Transaction and Payment Processing Services
SCHD has a 2.4% underweight vs SPY in the Transaction and Payment Processing Services Industry. I believe this is favorable because there has been a sharp growth moderation in the payment processing businesses, without any sign of a strong rebound yet. For example, I recently analyzed PayPal ( PYPL ), which has seen a sharp growth moderation to sub-10% YoY levels:
PayPal Total Revenue (PayPal Company Filings, Author's Analysis)
I also analyzed Block ( SQ ), which has seen a similar growth deceleration to sub-10% YoY levels:
Block Total Transaction-Based Revenue (Block Company Filings, Author's Analysis)
A key driver of growth moderation and a leading indicator of a rebound is the activity in the retail sector. But my outlook on this sector too is not bright which is why I believe the following industry is also a favorable underweight:
Broadline Retail
SCHD has a 3.4% underweight in Broadline Retail vs SPY. US Retail Sales data is a leading indicator of activity in the retail sector. So far, a rebound in US Retail Sales YoY growth has broadly fallen well short of expectations :
US Retail Sales YoY (MyFXBook, Author's Analysis)
Look the negative surprises in 5 of the last 6 months in the chart above. I think this is an indication that US Retail is not showing any signs of a meaningful rebound yet, which makes lower exposure to this industry favorable.
Favorable overweight exposures
Asset Management and Custody Banks
SCHD has a 6.6% overweight exposure in the Asset Management and Custody Banks industry vs SPY. I anticipate potential rate cuts in 2024 to lead to pick-up in capital markets activity. This would lead to better conditions for asset management and custody bank companies. I've discussed this theme in more depth in my coverage of the SPDR® S&P Capital Markets ETF ( KCE ). The majority (45.38%) of KCE's overall exposure is in Asset Management and Custody Banks.
Soft Drinks and Non-Alcoholic Beverages
SCHD has 6.3% overweight exposure in the Soft Drinks and Beverages industry vs SPY. I view this as favorable as the growth rates in the global soft drink market look rather promising ( 5.6% CAGR over the next 3-4 years), with a healthy mix of both volume growth (2.3%) and pricing growth (3.3%). Penetration into Africa is a key longer-term growth theme.
Global Soft Drink Market Forecast (Statista, Author's Analysis)
Given that this is a mature industry, I think these growth rates are quite healthy. For context, global GDP growth is expected to be only 2.9% YoY in 2024 and the US GDP is projected to be only 1.4% in 2024.
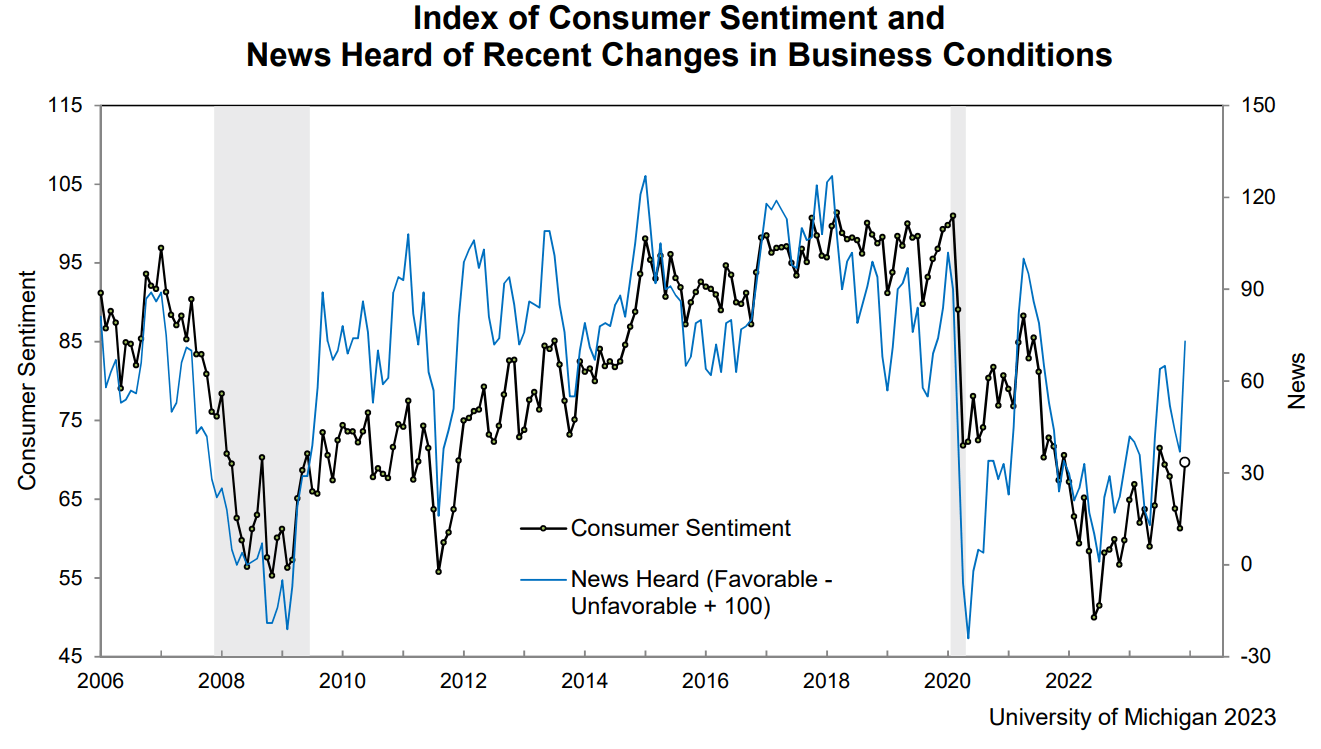
I've looked at the global picture here because Coca-Cola ( KO ) and PepsiCo ( PEP ), which make up SCHD's exposure to this industry together have an estimated global market share of 20% to 30% . Also, North America makes up a decent 37% of Coca-Cola revenues and 61% of PepsiCo's revenues. This makes the rebounding US Consumer Sentiment figures ( 69.7 in December 2023 vs 61.3 in November 2023) another supporting factor for a brighter outlook:
University of Michigan Consumer Sentiment Index (University of Michigan)
For a more complete picture, Mexico is also seeing a rebound in Consumer Confidence . Canada however, is yet to rebound after falling in H2 FY23.
Valuation
SCHD is trading at a PE ratio of 15.14x vs the SPY's 21.08x, implying a 28.2% discount. So in addition to the favorable exposures, I think there is a healthy valuation discount and margin of safety for SCHD compared to SPY.
Key Risks and Monitorables
I believe the biggest risk of SCHD underperforming SPY would be due to the 16% underweight in the Information Technology sector. More specifically, Microsoft ( MSFT ), Apple ( AAPL ) and NVIDIA ( NVDA ) make up 59.4% of the overall technology exposure of SPY (28.1% of SPY's overall exposure). SCHD has 0 exposure to these stocks. Hence, these are the top 3 stocks to watch for positive earnings surprises, which may undermine SCHD's performance vs SPY.
I will be giving updates on my previous coverage of Microsoft , NVIDIA and new initiating coverage of Apple soon.
Takeaway & Positioning
The performance data shows that my earlier assessments last year of SCHD underperformance vs SPY last year was correct as the former has underperformed the latter by 8.53% . Unfortunately, I was not as bold to issue a 'Sell' rating at that time. However, now I am sharing my confident opinion that SCHD will outperform the S&P500 ( SPY ) ( VOO ) as I change my stance to a 'Strong Buy'.
Analyzing the net exposures of SCHD vs SPY, I like the underweights in:
- Technology as that sector is priced highly from a valuations point of view
- Transaction and Payment Processing Services as that is yet to see a growth re-acceleration
- Broadline Retail as leading Retail Sales indicators do not show a rebound yet
I like the overweights in:
- Asset Management and Custody Banks as I anticipate a pickup in Capital Markets activity to be a tailwind
- Soft Drinks and Alcoholic Beverages due to the rosy growth outlook and supporting rebound in Consumer Sentiment
Also, the valuations in SCHD are favorable; it is trading at a 28% discount to the S&P500, thus providing a good margin of safety.
Positive earnings surprises in Microsoft, Apple and NVIDIA would be a key risk to monitor as SCHD's lack of exposure to these 3 big names may work against them.
From a positioning perspective, I usually have the bulk of my non-active alpha picks portfolio in VOO, which tracks the S&P500. However, I plan on changing that to SCHD on Monday. This is a big decision for my portfolio strategy.
How to interpret Hunting Alpha's ratings:
Strong Buy: Expect the company to outperform the S&P500 on a total shareholder return basis, with higher than usual confidence
Buy: Expect the company to outperform the S&P500 on a total shareholder return basis
Neutral/hold: Expect the company to perform in-line with the S&P500 on a total shareholder return basis
Sell: Expect the company to underperform the S&P500 on a total shareholder return basis
Strong Sell: Expect the company to underperform the S&P500 on a total shareholder return basis, with higher than usual confidence
For further details see:
Changing My Stance And Loading Up On SCHD