DLY - Closed-End Funds: A Look At The DoubleLine Trio
2023-06-27 00:36:58 ET
Summary
- DoubleLine closed-end funds, DBL, DSL, and DLY, are popular due to their founder, Jeffrey Gundlach, often referred to as the 'bond king.'
- All three funds experienced significant hits due to rising interest rates, with DBL's distribution coverage taking a substantial hit in the latest report.
- DLY is favored in terms of portfolio positioning and discount, but its narrowing discount and distribution coverage below 100% makes even this fund a hold for now.
Written by Nick Ackerman, co-produced by Stanford Chemist. This article was originally published to members of the CEF/ETF Income Laboratory on June 12th, 2023.
With the latest semi-annual reports being available for all three of the DoubleLine closed-end funds, it seemed appropriate to give a fresh update. While I didn't plan for this, it has also been almost a year since the last time I gave a quick refresh on this trio of funds in one piece.
Those funds include DoubleLine Opportunistic Credit Fund ( DBL ), DoubleLine Income Solutions Fund ( DSL ) and DoubleLine Yield Opportunities Fund ( DLY ). These funds are often popular due to being DoubleLine funds, which Jeffrey Gundlach founded. Gundlach has often been referred to as the 'bond king.'
The Basics Of DBL
- 1-Year Z-score: 0.89
- Premium: 1.81%
- Distribution Yield: 9.03%
- Expense Ratio: 2.46% (including interest expense)
- Leverage: 16.99%
- Managed Assets: $287.69 million
- Structure: Perpetual
DBL's investment objective is "to seek high total investment return by providing a high level of current income and the potential for capital appreciation."
To potentially achieve this objective, the fund will invest "in debt securities and income-producing investments of any kind, including, without limitation, residential and commercial mortgage-backed securities, asset-backed securities, U.S. Government securities, corporate debt, international sovereign debt, and short-term investments."
The Basics Of DSL
- 1-Year Z-score: 1.59
- Premium: 1.28%
- Distribution Yield: 11.09%
- Expense Ratio: 3.20% (including interest expense)
- Leverage: 24.17%
- Managed Assets: $1.585 billion
- Structure: Perpetual
DSL has an investment objective to "provide a high level of current income, and its secondary objective is to seek capital appreciation." The fund is invested "in a portfolio of investments selected for their potential to provide high current income, growth of capital, or both. The fund may invest in debt securities and other income-producing investments anywhere in the world, including in emerging markets."
The Basics Of DLY
- 1-Year Z-score: 2.08
- Discount: -4.83%
- Distribution Yield: 9.75%
- Expense Ratio: 3.38% (including interest expense)
- Leverage: 20.641%
- Managed Assets: $908.981 million
- Structure: Term (anticipated liquidation date February 25th, 2032)
DLY's investment objective is quite simple: "seek a high level of total return, with an emphasis on current income." To achieve this, the fund will "invest in a portfolio of investments selected for its potential to provide a high level of total return, with an emphasis on current income. The Fund may invest in debt securities or other income-producing investments of issuers anywhere in the world, including in emerging markets, and may invest in investments of any credit quality."
DLY is the only fund with a term structure, which has to do with the fund launching in 2020. DBL is the oldest, as it launched in 2012, and they quickly followed up DBL with DSL launching in 2013.
The DoubleLine funds also aren't as aggressive in terms of utilizing leverage. This seems to be by design, as the funds have actually been deleveraging to remain mildly leveraged.
Performance And Valuation
Even the bond king is finding it more difficult to operate in a rising rate environment; the 2022 pace of interest rate increases was one we haven't seen in decades. This has certainly been a testing period for the bond king that's been vastly different than the environments he has been used to operating in.
YCharts
This led to significant hits in 2022 for fixed-income. However, with rates stabilizing a bit for now, or at least the pace of increases slowing, we are starting to make some returns again.
Still, the DoubleLine trio of funds did not escape the brutal hit of the higher interest rates. Being leveraged instruments that would have only caused more pain, with relatively larger hits.
This chart is a comparison of the performances between these funds going back to the start of 2022 to today. I've also included the iShares Core U.S. Aggregate Bond ETF ( AGG ) to give some overall color to the situation. I've also included the iShares iBoxx $ High Yield Corporate Bond ETF ( HYG ), as the DoubleLine funds invest heavily in below-investment-grade debt too.
YCharts
While AGG and HYG held up better on both a total share price and NAV basis - presumably due to not being leveraged, lower expense ratio and positioning - it still wasn't anything to brag about. Interest rates killed bond (and equity) results in 2022.
One of the biggest critiques I see of fixed-income CEFs is how they've only delivered flat results for years now. Well, that isn't too much different from what we've been seeing from bonds overall. So it really isn't surprising. AGG has barely delivered any positive results in the last ten years now due to such a substantial hit in 2022. That decline wiped out years of gains.
Here's a look at the AGG results.
AGG Annualized Results (BlackRock)
High yield has delivered something, but even then, it isn't anything to boast about. Here's a look at HYG's annualized results.
HYG Annualized Results (BlackRock)
Most fixed-income assets have only begun to recover more so this year and bounced off similar lows that the equity market did in October. HYG outperformed AGG even during this time as high-yield is often less interest rate sensitive. It does come with higher credit risks, though, so there is always a trade-off.
The largest detractor by far was DSL in terms of its total NAV return. Yet, the fund's total share price results had been met with a much more muted response - providing performance that wasn't too far off from its sister funds. The portfolio positioning here would have a lot to do with it. The fund is most heavily invested in emerging market debt relative to the others.
That said, for the most part, all three funds would be considered multi-asset bond funds, as they have a ton of flexibility in where they can invest. Basically, the door is wide open on each fund, and they've just chosen to emphasize certain areas in each fund over others - while still being relatively diverse at the same time.
Here's a look at the YTD returns of each of the funds. DSL and DLY have really taken off and left their NAV returns in the dust.
YCharts
The divergences we see here for DSL and DLY have seen the valuations in these two really tighten up. It has taken DSL to a premium and narrowed DLY's discount materially. While the shift in DBL hasn't been dramatic, the fund has also climbed to a premium but is regularly traded at a premium already. In fact, DBL is the only fund of the three currently trading below its longer-term average.
YCharts
That could mean that DBL is potentially the best fund to consider if one is adding at this time.
A Look At The Latest Distribution Coverage
DBL
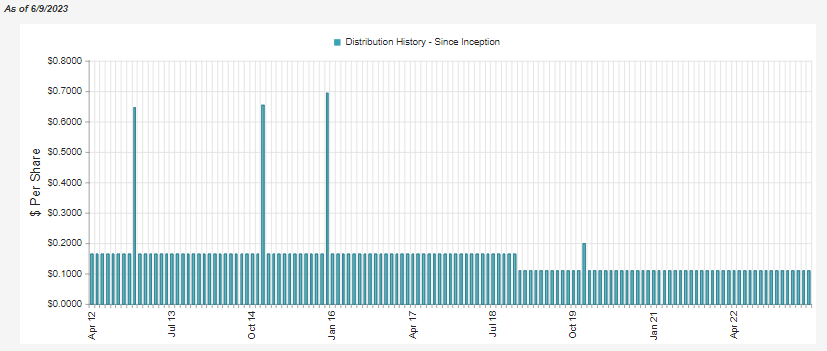
DBL has had one distribution cut since its inception.
The fund's latest semi-annual report put the net investment income per share at just $0.13.
DBL Semi-Annual Report (DoubleLine)
That was a significant hit compared to the previous period. It would show a big lack of distribution coverage if this were to continue, as NII coverage is only at 19.7%.
Besides rising interest expenses from $305,914 to $1.289 million, the fund's total investment income also substantially declined. In this latest six-month report, we've seen TII come in at $5.084 million. That was less than half of what TII came in a year ago of $11.819 million. Some of this can be explained with some deleveraging, but otherwise, the drop here is quite material. It will be interesting to see if this was a timing issue or if coverage can improve going forward.
Given these numbers, a cut in the distribution wouldn't be overly surprising.
DSL
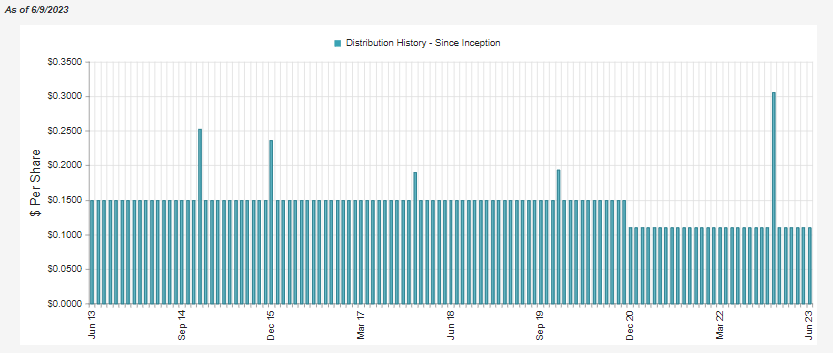
For DSL, we also only see one cut since its inception.
The coverage figures are a little bit prettier for DSL, but they, too, have been ravaged by higher interest rates pushing up their borrowing costs. DSL was also experiencing deleveraging.
I had noted previously that if we adjusted for the special year-end distribution, that coverage for DSL would have been over 100%. However, I also mentioned that coverage was trending lower due to the higher borrowing costs and deleveraging. We have now seen that play out. So what we see here was anticipated; it isn't a shock like seeing DBL's coverage drop as sharply as it did.
Adjusting once again for the special year-end distribution of $0.196 (as it's still reflected in this period,) we would see NII coverage of 85.8%. Again, a cut in the distribution for DSL wouldn't be too surprising as interest rates have only headed higher since this report.
DLY
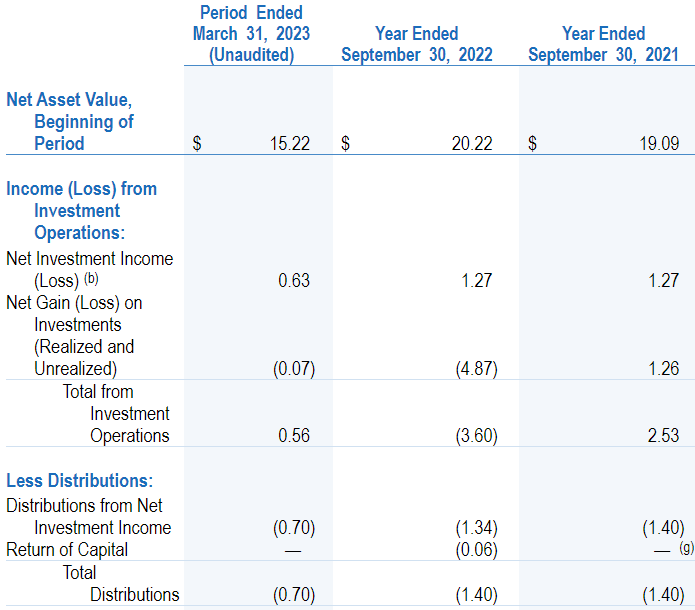
DLY has a much shorter history, so they've maintained the same monthly distribution of $0.1167.
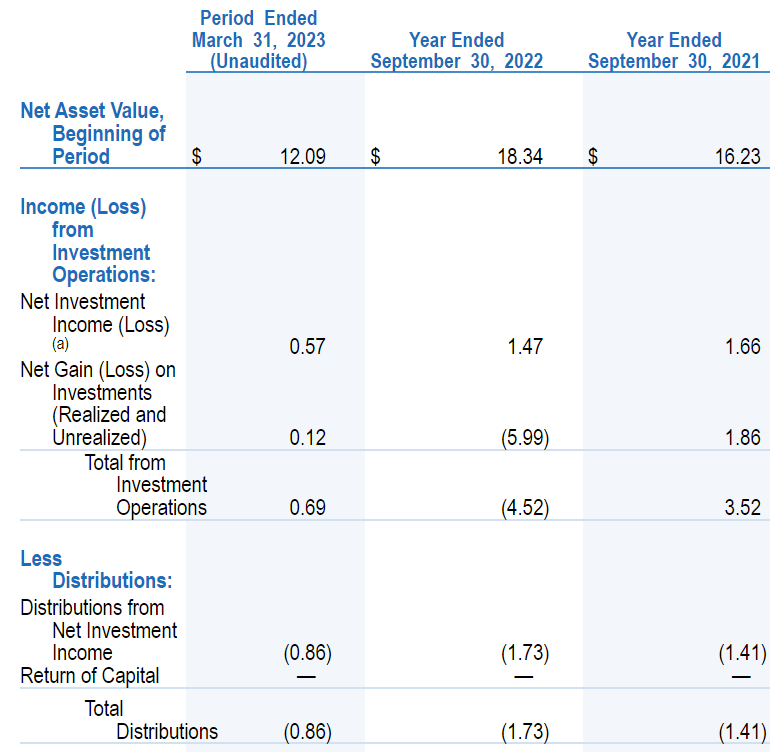
This drop is similar to DSL in that it was within expectations. NII coverage here comes in at the highest of 90%. Of course, that's still not ideal, as we'd want to see fixed-income-oriented funds produce distribution coverage at over 100% from NII.
A Look At The DoubleLine Portfolios
DBL
DBL has chosen to focus primarily on collateralized loan obligations. However, they also have a meaningful weighting in non-agency CMBS, and interestingly, a healthy portion of their portfolio is invested in agency RMBS. The agency debt can be quite attractive, given the reduced credit risk.
DBL Portfolio Exposure (DoubleLine)
This fund overall is skewed most heavily to a higher quality portfolio over its sisters.
DBL Portfolio Quality (DoubleLine)
Between agency, government, and investment grade, we arrive at a that consuming 54% of the portfolio.
The duration of the portfolio is at 3.74 years. That is fairly low, considering the portfolio's overall quality is somewhat higher. The CLO and bank loans would seemingly be the biggest factor keeping the portfolio's duration in check. Their portfolio holdings' underlying average market price comes in at $97.94. That puts the underlying portfolio at a fairly shallow discount - this could presumably be due to its higher quality, in general.
DBL Stats (DoubleLine)
DSL
When looking at DSL, we see a clear emphasis on emerging market debt. However, high-yield corporates are also a meaningful allocation for the portfolio.
DSL Portfolio Exposure (DoubleLine)
This portfolio is overwhelming in the junk category, with very limited exposure to safer assets. Only around 12% is classified as agency, government, or investment grade.
DSL Portfolio Quality (DoubleLine)
In this case, the fund's duration is higher than DBL's at 4.99 years. Given the skew towards lower quality, this is surprising to me. We can see that the weighted average life of the holdings is also longer - which is a main (but not only) driving factor when calculating duration.
DSL Stats (DoubleLine)
For DSL, a big potential benefit here is the average market price of the underlying portfolio. This really took a whacking and is down to an average price of $67.55. This reflects the credit risks in their portfolio. Should they hold some of these positions to maturity and they are able to pay back face value, that could potentially lead to some upside.
DLY
DLY puts the heaviest emphasis on MBS in general. With non-agency CMBS as the largest part of its pie, non-agency RMBS is also a meaningful portion of its portfolio. Non-agency MBS is obviously an area of the market that is under incredible stress right now, as the anticipation is for a weakening economy going forward. Since they are non-agency, there are no government guarantees backing this debt. This means when the defaults start rolling in, DLY is the one to feel the pain.
DLY also carries material exposure to high-yield corporates, CLOs, and emerging markets. With relatively less exposure to CLOs and emerging markets compared to DBL and DSL, in which those funds have chosen to put overweight allocations to those areas.
DLY Portfolio Exposure (DoubleLine)
Similar to DSL, the fund is invested mostly in junk-rated quality. It just isn't as junky, with around 20.33% allocated to agency, government or investment-grade debt categories.
DLY Portfolio Quality (DoubleLine)
The duration for DLY is at 3.12 years, making it the lowest of the three funds. Yet, the portfolio's weighted average life is a bit higher than DBL's. It also is a bit more balanced in terms of the average market price of the underlying portfolio.
DLY Stats (DoubleLine)
At $83.46, there is a substantial discount, and that price in some of the credit risks going forward. However, it's still meaningful, and if they can collect face value should they hold onto these positions, that could mean some potential upside in the future. Of course, that isn't something that should be relied upon. As an actively managed fund, they are always buying and selling positions.
Conclusion
I tend to favor DLY in terms of its portfolio positioning and discount. Though the discount has narrowed recently, meaning I'd hold off from adding to my position. The distribution coverage isn't great, but it is the best of the three funds. Still, anything under 100%, and I believe the chance for a cut in the distribution is always possible.
DBL's distribution coverage has taken a substantial hit in the latest report. I'd look forward to the next report to see if this reverses. Combining that with the fund's premium, I believe that DBL isn't too attractive for now. Although, DBL also carries the relatively safer portfolio of the trio. That could present a comparably better balance as we venture forth into these uncertain times.
Similarly, DSL would be outside of being appealing for adding at this time due to the fund's premium. The lack of distribution coverage is also concerning, but it isn't nearly as bad as DBL. Where the argument could be made in DSL is just how discounted the actual underlying portfolio is. However, that discount is presumably there for a reason due to the credit risks that are inherent in its junkier portfolio.
For further details see:
Closed-End Funds: A Look At The DoubleLine Trio