TIP - Core Services Inflation Is Too Hot For Fed To Cut Rates
2023-12-12 10:55:22 ET
Summary
- The Consumer Price Index, or CPI, report for November 2023 was roughly in line with expectations. However, close analysis reveals important details.
- Core services ex-housing CPI, a metric closely watched by the Fed, remains stubbornly very high. By contrast, core goods reflect deflation.
- The Fed may need to remain cautious, keeping interest rates high and liquidity tight due to stubbornly high inflation in core services ex-housing.
The Consumer Price Index ("CPI") Summary was published on December 12, 2023, at 8:30 AM. The report contains information about changes in the prices (inflation/deflation) of a wide array of goods and services purchased by consumers in the US during the month of November 2023.
In this report, we will walk readers through a detailed analysis of the CPI report . We will also discuss the likely implications of the reported data for the U.S. economy and financial markets.
Summary Data and Analysis
A summary of key data and analysis for this month's CPI report is provided in Figure 1.
Figure 1: Change, Acceleration, Expectations, and Surprise
Core & All Items CPI (BLS & Investor Acumen)
All Items CPI accelerated slightly and surprised to the upside. Core CPI also accelerated, but was essentially in line with expectations (surprised very slightly to the downside).
Price Changes in Major CPI Components Over Various Time Frames
In this section we focus on the growth rates of major CPI components over various time frames. Readers should observe the acceleration and/or deceleration of growth rates over time, the relative growth rates between components, and the growth rates of each component compared to its own history (percent rank).
Figure 2: Percent Change, Annualized Change and Percent Rank: 1, 3 and 12 months
Annualized Inflation Over the Past 12 Months (BLS & Investor Acumen)
In the table above, there are some major divergences. First, focus on core services ex-housing -- the metric the Fed is watching most closely - you will see that this metric is running well above the Fed's 2.0% target, and stubbornly so. On a 1-month and 3-month basis, this metric is running at 6.23% and 5.37% annualized rate - figures the Fed will be uncomfortable with.
By contrast, if you focus on core goods, there has been a pretty dramatic trend towards deflation, with price changes in this category at the extreme lower end of historical averages.
Decomposition Analysis of Monthly Change: Major CPI Components
In Figure 3, we perform a decomposition analysis of change and acceleration, breaking CPI down into Non-Core and Core components. We further decompose the growth of non-core CPI into two subcomponents and decompose the growth of core CPI into three subcomponents. Although all five columns in the table provide important information, we recommend that readers pay special attention to the rightmost column (Cumulative Contribution to Acceleration) as it reveals exactly what drove the MoM acceleration/deceleration in CPI during the current month compared to the prior month.
Figure 3: Analysis of Key Aggregate Components of CPI
Aggregate CPI Component Analysis (BLS & Investor Acumen)
As can be seen in the table, Core Services was by far the largest contributor to the acceleration of All Items CPI. While Core Goods decelerated slightly.
Core Services except Housing - the indicator the Fed is currently paying most attention to - accelerated significantly in November, and remains well above levels that the Fed can be comfortable with. Housing services (which lag current market trends by roughly 12 months) also accelerated.
We now proceed to analyze the CPI report in even greater depth. For more detailed information on how to read and interpret the tables and graphs in this article, please see the following Seeking Alpha blog post .
Contributions to Monthly Change in Core CPI
In Figure 4, we dig deeper down into the data and present a bar chart that highlights notable positive and negative contributors to the MoM percent change in Core CPI. These contributions take into account both the magnitude of the MoM change in each component as well as the weight of each component in CPI.
Figure 4: Top Contributors to MoM Percent Change
Top CPI Contributors (BLS & Investor Acumen)
Once again, Owner's Equivalent Rent was the most important positive contributor to the monthly change in CPI. Used Cars & Trucks -- a highly volatile item - contributed positively to the monthly change in CPI. The Used Cars and Trucks component had been a drag on CPI for many consecutive months.
Housing components have the largest weight in the CPI (accounting for about 40% of core CPI) and it's very important to note that real-time indicators suggest that there will continue to be significant disinflation in the housing components of CPI for the remainder of 2023 and much of 2024. Declines in CPI that are driven by this severely lagged component are not relevant for understanding what is presently going on in the housing markets or in the economy.
Contributions to Monthly Acceleration in Core CPI
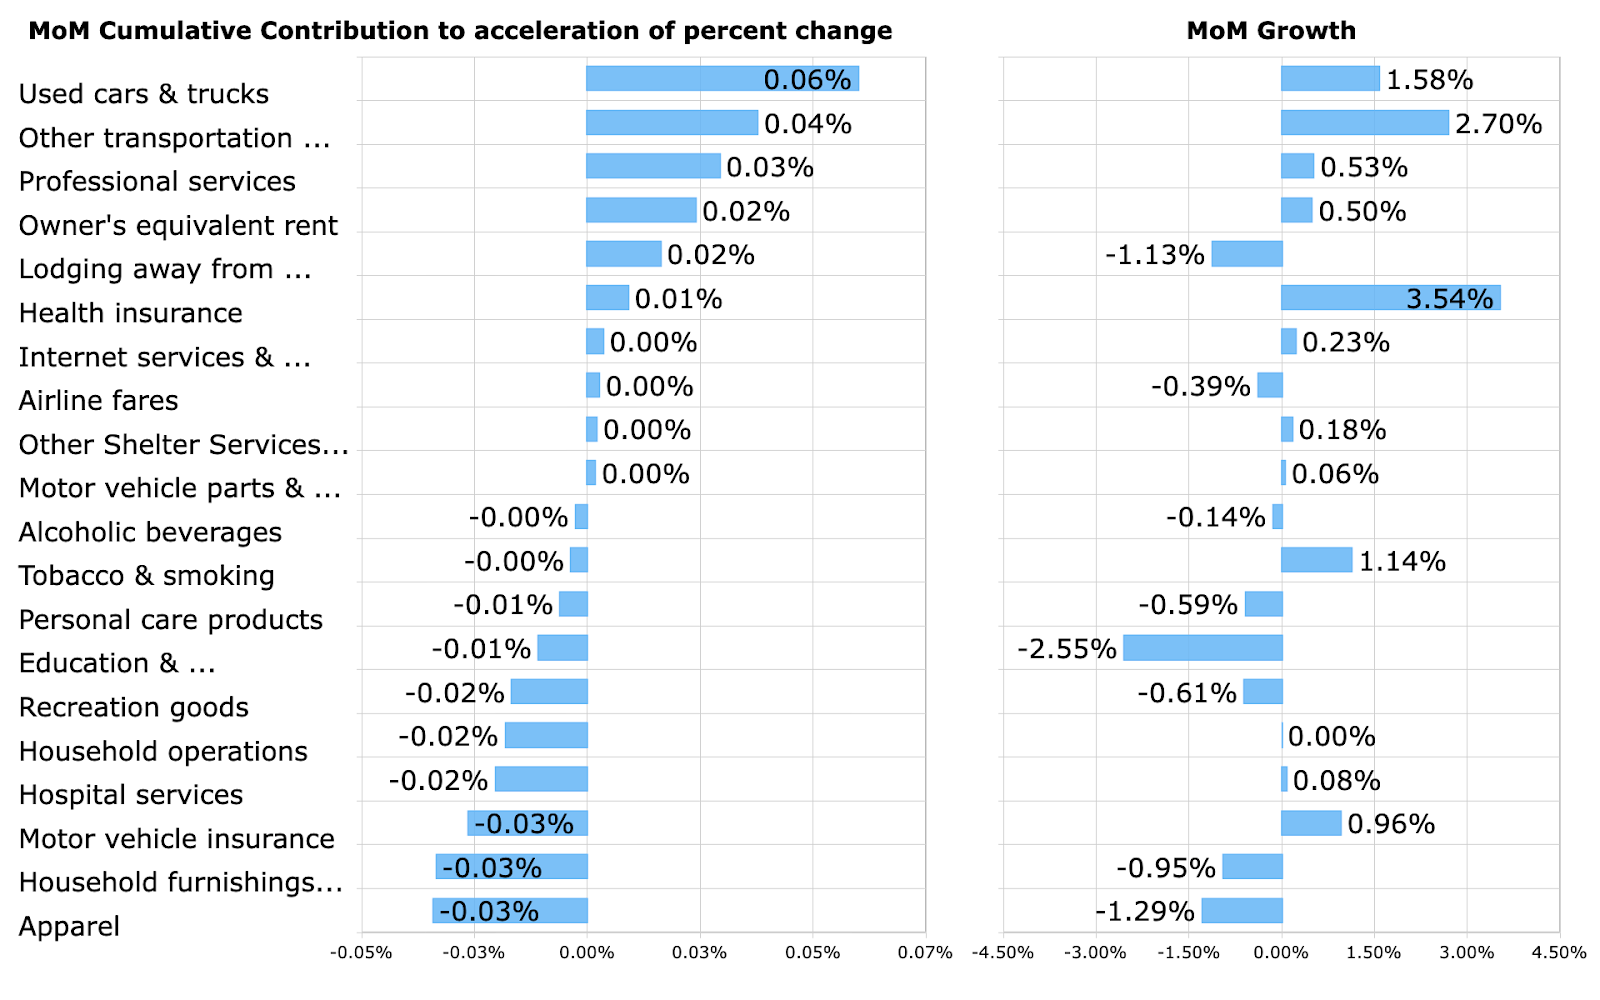
In Figure 5, we shift the focus from a decomposition of the rate of change, to a decomposition of the rate of acceleration. The bar chart highlights notable positive and negative contributors to the MoM acceleration in Core CPI. These contributions take into account both the magnitude of the MoM accelerations in the components as well as the weight of each component in CPI.
Figure 5: Top Contributors to MoM Acceleration of Core CPI
Top CPI Acceleration Contributors (BLS & Investor Acumen)
We recommend that readers examine this table carefully, as it is likely to include most or all of the items that caused deviations from forecasters' expectations of Core CPI.
Used Cars & Trucks was notably the largest individual contributor to the acceleration in Core CPI. Professional medical services also made a significant contribution to core services acceleration. On the side of deceleration, Apparel and Household furnishings were notable drags on the Core CPI inflation this month.
Top Movers
In Figure 6, for general interest purposes, we highlight a few CPI components (out of over 200) that exhibited the largest positive and negative change during the month. The YoY change in these particular components is displayed to the right.
Figure 6: Top Movers MoM Percent Change
Top CPI Movers (BLS & Investor Acumen)
Declining gasoline prices and motor fuels exhibited notable declines in this report. Potatoes and Butter and margarine exhibited the largest price increases this month.
Implications for the Economy
On the surface the report was in-line with expectations. However, there are some areas of concern that readers should be aware of.
In particular, core services ex-housing - the metric most closely watched by the Fed - is running at a 3-month annualized rate of 5.37% (with the figure having been 6.23% for the past month), with little signs of deceleration for the past 6 months. Inflation in this critical category of core services ex-housing seems to be "stuck" running at well above a 4.0% annualized rate - and the Fed cannot be happy or complacent about this.
Energy prices fell again in November, contributing to deceleration in All-Items CPI, and indirectly exerting downward pressure on some of the core components. However, WTI crude oil is likely near an intermediate-term bottom. As such, energy prices currently represent much more upside risk than downside risk for CPI going forward.
On the positive side, prices for core goods are deflating, and this trend is likely to continue going forward, placing continued downward pressure on core CPI. The housing categories can also be expected to continue to exert downward pressure on core CPI for many months going forward (although this data is lagged by about 12 months and bears no relation to what is going on in real-time).
Putting all of the above together, our view is that the details of this report do not support current market expectations of Fed rate cuts. Until stubbornly high inflation in core services ex housing - the category most closely watched by the Fed - is reduced substantially, we believe that the Fed is going to have to remain very cautious, keeping interest rates high and liquidity tight in the economy. Furthermore, we saw nothing in this report that would suggest that the Fed can afford to soften the generally hawkish tone of its communications.
Implications for Financial Markets
Common stock and interest rate markets initially reacted bullishly to the CPI report as it appeared to be in line with expectations. However, the S&P 500 (SP500) later turned red and the 10Y Treasury bond yield (US10Y) turned upward. This is probably at least partly a result of what we have pointed out in this report: The stubbornly high inflation in core services ex-housing is rather troubling.
Going forward, the market will probably have to continue to deal with hawkish rhetoric from the Fed. Market expectations for rate cuts currently appear to us to be far too early and far too numerous, based on the data seen in this report.
Conclusion
Since last year, we have been telling investors that 2023 would be a year of disinflation - and it has been. However, we think that the economy is currently at an inflection point where the disinflationary process may have "paused." Core inflation ex housing appears to be "stuck" at unacceptably high levels. In this context, there is risk of a re-acceleration of overall inflation, particularly if oil prices start to rise. If such a re-acceleration occurs - particularly in the context of a slowing economy, the implications for equity markets would be very negative.
Our portfolios will be looking to capitalize on possibilities of market downside action in coming months as a result of a severely slowing economy combined with a continuation of tight monetary policy.
For further details see:
Core Services Inflation Is Too Hot For Fed To Cut Rates