TIP - CPI December 2023: Fed Likely Will Become Hawkish
2024-01-11 10:55:50 ET
Summary
- The Consumer Price Index, or CPI, report for December 2023 showed a modest acceleration in overall CPI, while core CPI held steady.
- Core services ex-housing, a metric closely watched by the Fed, is running well above the 2.0% target and shows no signs of deceleration.
- Based on this CPI report, the Fed needs to start to tamper market expectations regarding the extent and timing of rate cuts.
The Consumer Price Index (CPI) Report was published on January 11, 2024, at 8:30 AM. The report contains information about changes in the prices (inflation/deflation) of a wide array of goods and services purchased by consumers in the U.S. during the month of December 2023.
In this report, we will walk readers through a detailed analysis of the CPI report. We will also discuss the likely implications of the reported data for the U.S. economy and financial markets.
Summary Data and Analysis
A summary of key data and analysis for this month's CPI report is provided in Figure 1.
Figure 1: Change, Acceleration, Expectations, and Surprise
Core & All Items CPI (BLS & Investor Acumen)
All Items CPI accelerated and surprised to the upside. Core CPI (+0.31%) essentially held steady and was in line with expectations, although it both accelerated and beat expectations slightly.
Price Changes in Major CPI Components Over Various Time Frames
In this section, we focus on the growth rates of major CPI components over various time frames. Readers should observe the acceleration and/or deceleration of growth rates over time, the relative growth rates between components, and the growth rates of each component compared to its own history (percent rank).
Figure 2: Percent Change, Annualized Change and Percent Rank: 1, 3 and 12 months
Annualized Inflation Over the Past 12 Months (BLS & Investor Acumen)
In the table above, there are some major divergences. First, if you focus on core services ex-housing -- the metric the Fed is watching most closely - you will see that this metric is running well above the Fed's 2.0% target, and stubbornly so. On a 1-month and 3-month basis, this metric is running at 4.98% and 5.14% annualized rate, respectively. These are figures that the Fed will be very uncomfortable with.
By contrast, if you focus on core goods, there has been a pretty dramatic trend towards deflation, with price changes in this category actually deflating and at the extreme lower end of historical averages.
Decomposition Analysis of Monthly Change: Major CPI Components
In Figure 3, we perform a decomposition analysis of change and acceleration, breaking CPI down into Non-Core and Core components. We further decompose the growth of non-core CPI into two subcomponents and decompose the growth of core CPI into three subcomponents. Although all five columns in the table provide important information, we recommend that readers pay special attention to the rightmost column (Cumulative Contribution to Acceleration) as it reveals exactly what drove the month over month, or MoM, acceleration/deceleration in CPI during the current month compared to the prior month.
Figure 3: Analysis of Key Aggregate Components of CPI
Aggregate CPI Component Analysis (BLS & Investor Acumen)
As can be seen in the table, Energy was by far the largest contributor to the acceleration of All Items CPI. Core Goods accelerated while Core Services decelerated.
Core Services except Housing - the indicator the Fed is currently paying most attention to - decelerated in December. However this key indicator is well above what is acceptable to the Fed.
We now proceed to analyze the CPI report in even greater depth. For more detailed information on how to read and interpret the tables and graphs in this article, please see the following Seeking Alpha blog post .
Contributions to Monthly Change in Core CPI
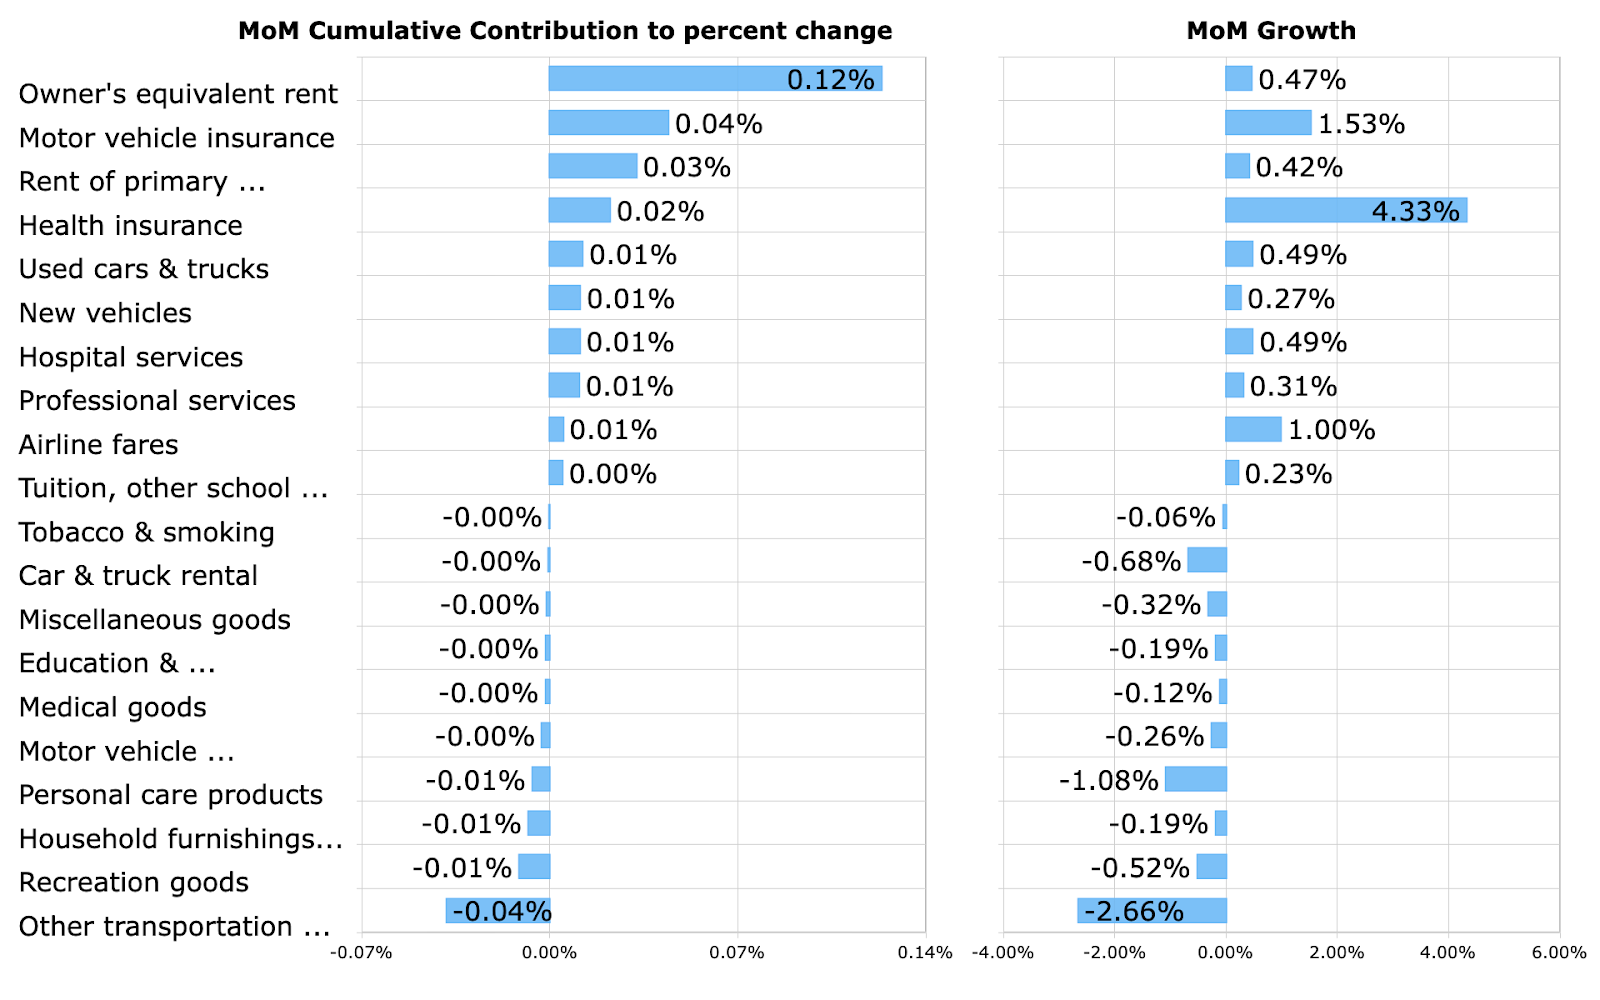
In Figure 4, we dig deeper down into the data and present a bar chart that highlights notable positive and negative contributors to the MoM percent change in Core CPI. These contributions take into account both the magnitude of the MoM change in each component as well as the weight of each component in CPI.
Figure 4: Top Contributors to MoM Percent Change
Top CPI Contributors (BLS & Investor Acumen)
Once again, Owner's Equivalent Rent was the most important positive contributor to the monthly change in CPI. Motor Vehicle Insurance also contributed positively to the monthly change in CPI.
Housing components have the largest weight in the CPI (accounting for about 40% of core CPI). In this regard, it is very important to note that real-time indicators suggest that there will continue to be significant disinflation in the housing components of CPI for the second half of 2024. Therefore, throughout the first half of 2024 there will be significant downward pressure on both All-Items and Core CPI from the housing component. However, declines in CPI that are driven by this severely lagged component are not relevant for understanding what is presently going on in the housing markets or in the economy.
Contributions to Monthly Acceleration in Core CPI
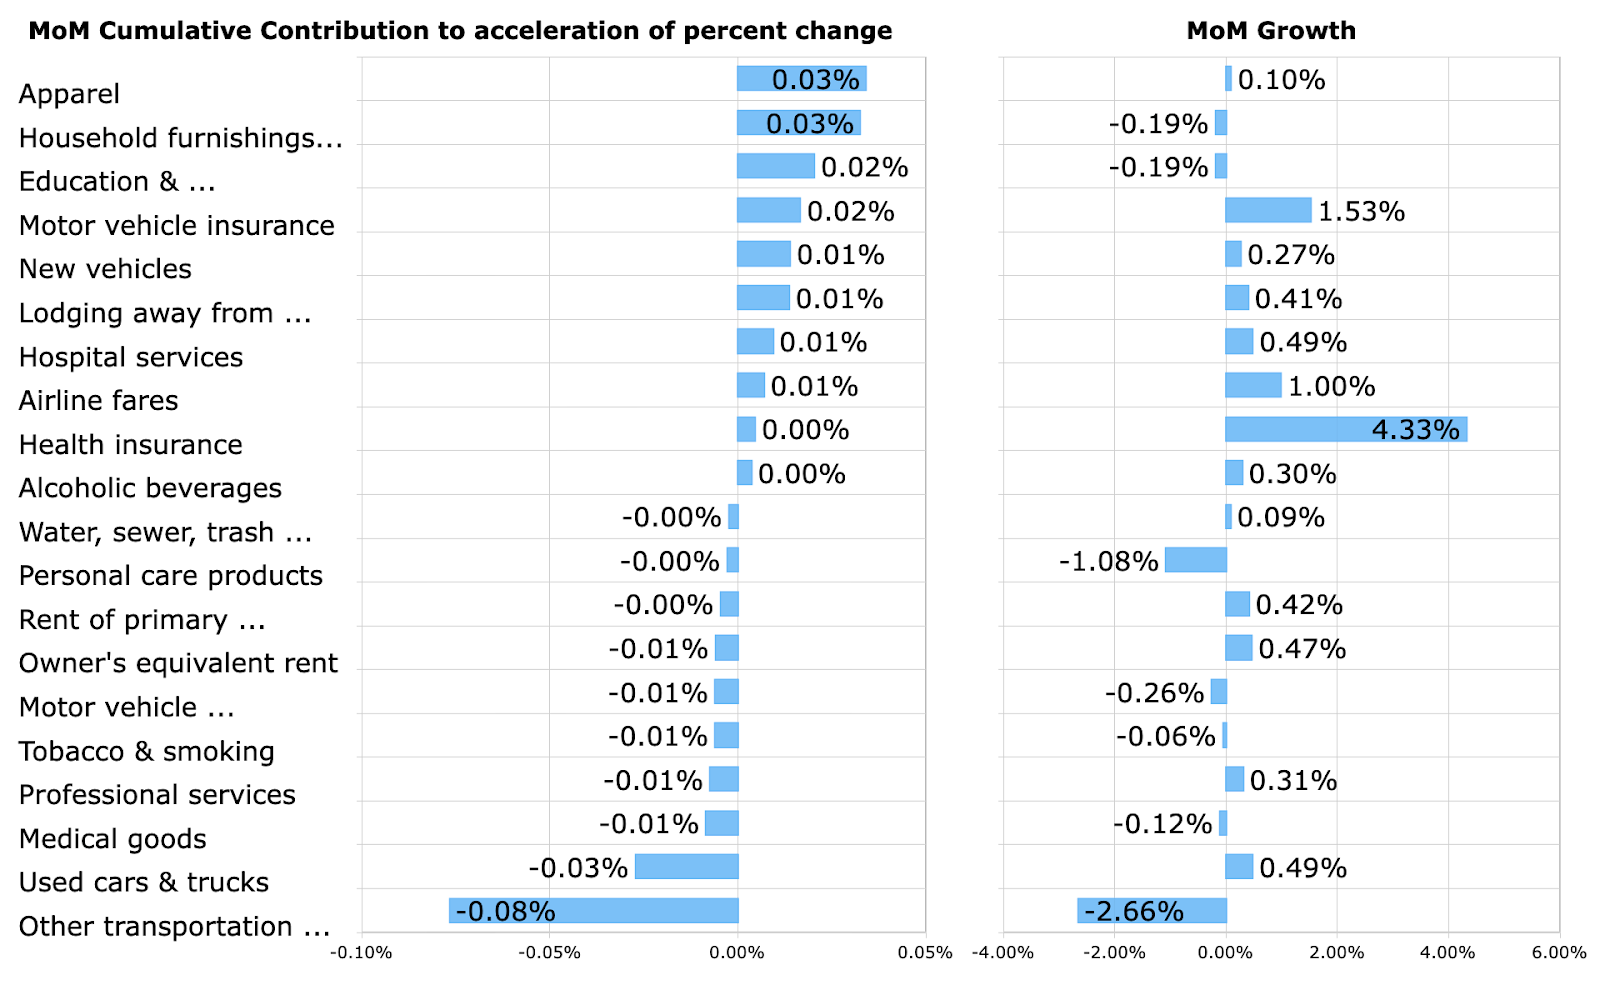
In Figure 5, we shift the focus from a decomposition of the rate of change, to a decomposition of the rate of acceleration. The bar chart highlights notable positive and negative contributors to the MoM acceleration in Core CPI. These contributions take into account both the magnitude of the MoM accelerations in the components as well as the weight of each component in CPI.
Figure 5: Top Contributors to MoM Acceleration of Core CPI
Top CPI Acceleration Contributors (BLS & Investor Acumen)
We recommend that readers examine this table carefully as it is likely to include most or all of the items that caused deviations from forecasters' expectations of Core CPI.
Among items that contributed to acceleration of Core CPI, Apparel and Household Furnishings were the largest contributors. Interestingly, both of these items imparted major drags on Core CPI last month.
Among items that contributed to deceleration of CPI, Other Transportation Services stands out.
Top Movers
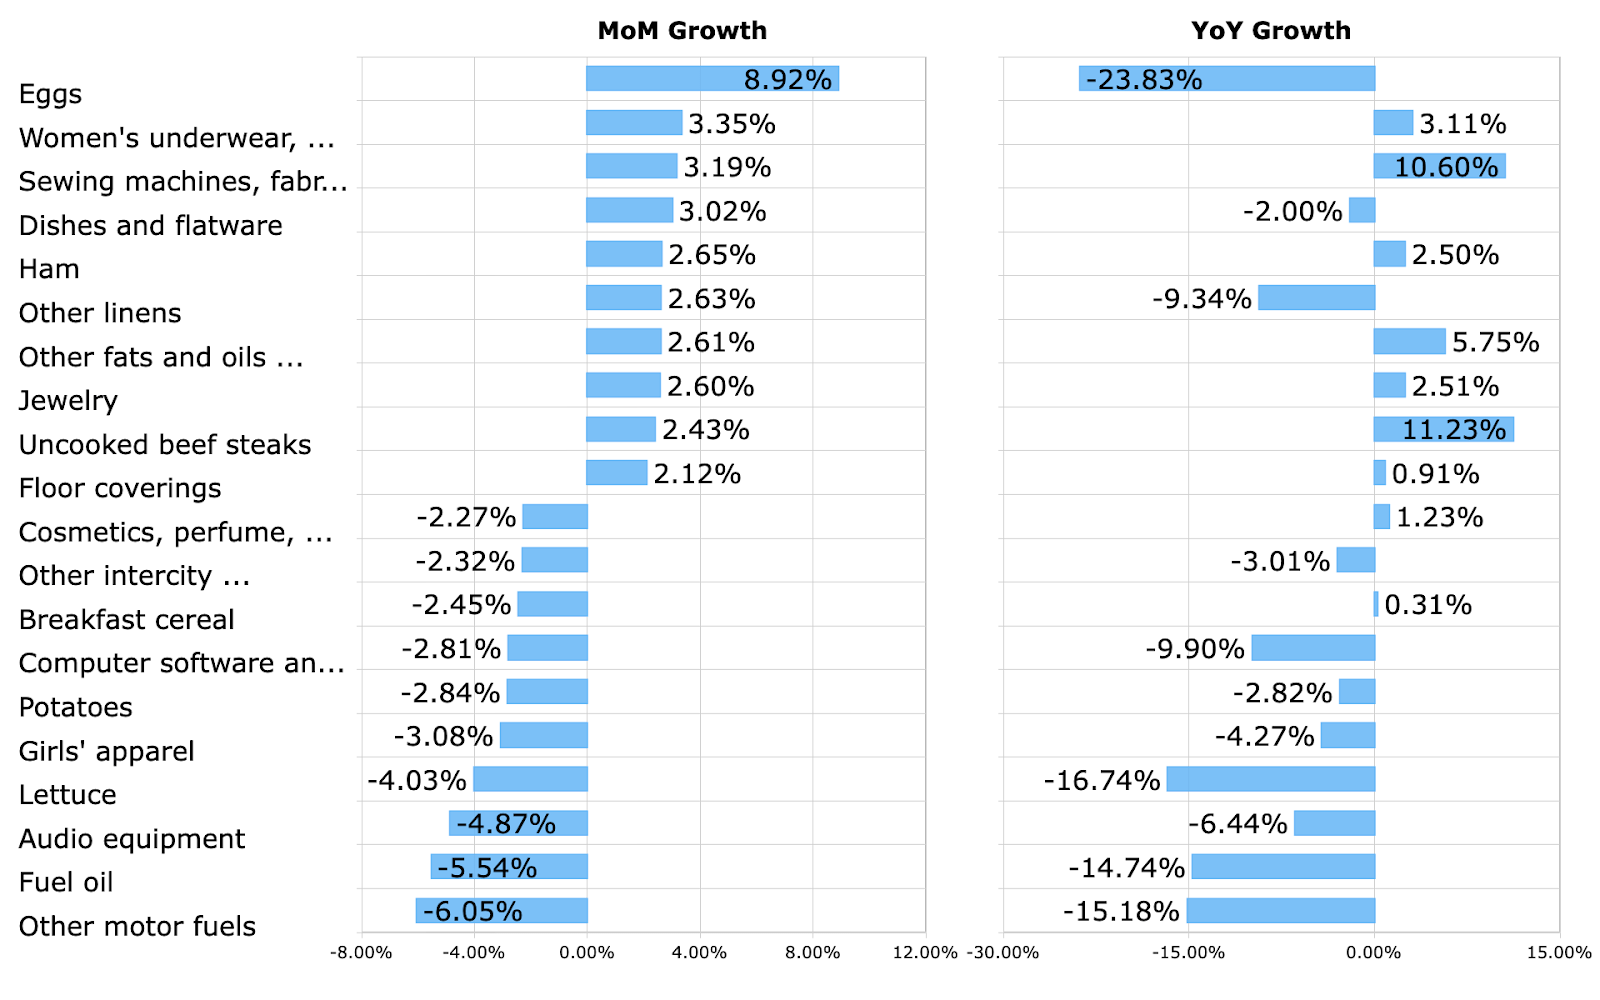
In Figure 6, for general interest purposes, we highlight a few CPI components (out of over 200) that exhibited the largest positive and negative change during the month. The YoY change in these particular components is displayed to the right.
Figure 6: Top Movers MoM Percent Change
Top CPI Movers (BLS & Investor Acumen)
Fuel oil and Other motor fuels exhibited notable declines in this report. Eggs have returned to being the largest MoM increase, although on a YoY basis it has deflated -23.83%.
Implications for the Economy
Overall, today's CPI report did not supply any major surprises. However, there were some problematic aspects of this report that readers should be aware of.
First and foremost, core services ex-housing - the metric most closely watched by the Fed - is running at a 3-month annualized rate of 5.14% (with the figure having been 4.98% for the past month), with little signs of deceleration for the past 6 months. Inflation in this critical category of core services ex-housing seems to be "stuck" at or near a 5.0% annualized rate - and the Fed should be very concerned about this.
Second, in our view, WTI crude oil (CL1:COM) is likely near an intermediate-term bottom. As such, energy prices currently represent much more upside risk than downside risk for CPI, going forward.
Third, core goods prices have been deflating due to normalization of supply chains. However, this normalization effect can be expected to fade (or even reverse) in 2024. At that point, core goods prices will stop representing a drag on CPI.
Fourth, housing CPI components are disinflating and will likely continue throughout most or all of 2024. As such, the housing categories should be expected to continue to exert downward pressure on core CPI for most of 2024. However, housing CPI data is severely lagged by around 12-months relative to real-time trends. In this context, there is a risk that the real-time disinflation trend will reverse during 2024, while the lagged data is dragging down the CPI, creating a false illusion.
Putting all of the above together, our view is that the details of this report do not at all support current market expectations of Fed rate cuts - approximately 125 basis points of cuts, starting in March. Until stubbornly high inflation in core services ex housing - the category most closely watched by the Fed - is reduced substantially, we believe that the Fed is going to have to remain very cautious, keeping interest rates high and liquidity tight in the economy. Indeed, based on this report, we think that the Fed may increase the hawkish tone of its communications in order to dampen expectations regarding the timing and extent of Fed rate cuts in 2024..
Implications for Financial Markets
Common stock and interest rate markets have reacted mildly to this report, as Core CPI appeared to be in line with expectations and the upside surprise in All-Items CPI was only mild.
However, the stubbornly high inflation in core services ex-housing is very troubling, and this is likely to have consequences in the intermediate term.
Going forward, it is our view that the market may be confronted with increasingly hawkish rhetoric from the Fed. Market expectations for Fed rate cuts currently appear to be out of line with what the Fed is likely to deliver, based on the information contained in this CPI report.
Conclusion
Since the third quarter of 2022, we emphasized that 2023 would be a year of disinflation - and it was. But, outside of the housing components (which are lagged by 12 months), we think that the economy is currently at an inflection point where the disinflationary process may have "paused." Core inflation ex housing appears to be "stuck" at unacceptably high levels. In this context, there is major risk of a re-acceleration of overall inflation, particularly if oil prices start to rise.
Although we expect CPI to continue decelerate in the next few months, we think that the risk of a reacceleration of inflation in the U.S. is very much on the table, starting in the second half of 2024. At our Investing Group, we will be actively managing this potential transition from a bullish to bearish inflation environment later this year.
For further details see:
CPI December 2023: Fed Likely Will Become Hawkish