SPYX - CPI: Disinflation Is Now A Clear Trend Which Will Dominate Markets
Summary
- We summarize key data and provide in-depth analysis of the monthly Consumer Price Index report released by the U.S. Bureau of Labor Statistics.
- All Items and Core CPI inflation were in line with expectations.
- Deceleration in energy accounted for most of the deceleration in All-Items CPI. There was relatively little change in acceleration/deceleration within non-energy items this month.
Summary Data and Analysis
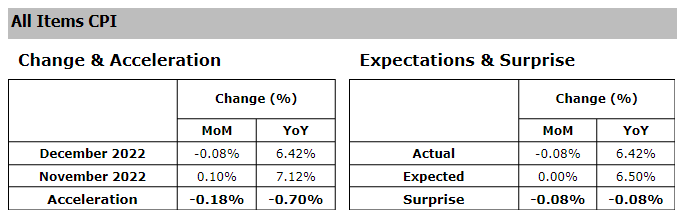
Figure 1 below highlights key summary data and analysis for this month’s All Items CPI.
Figure 1: All Items: Change, Acceleration, Expectations and Surprise
All Items CPI (BLS, Investor Acumen)
As can be seen above, All-Items CPI decelerated significantly on both a MoM and YoY basis -- a slight downside surprise relative to expectations.
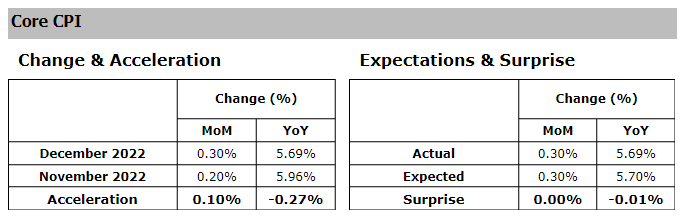
Figure 2 below highlights key summary data and analysis for this month’s Core CPI.
Figure 2: Core: Change, Acceleration, Expectations & Surprise
Core CPI (BLS, Investor Acumen)
As can be seen above, Core CPI accelerated relative to the prior month, but continued to decelerate on a YoY basis and was in line with expectations.
Analysis of Contributions of Key Aggregate Components of CPI
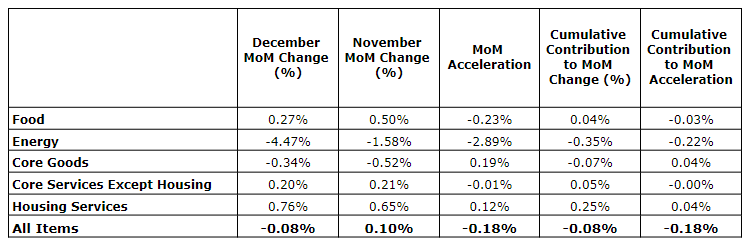
In Figure 3, we display the contributions to CPI inflation of five major aggregate components to the MoM (month-over-month) change in CPI and the MoM acceleration of CPI.
Figure 3: Analysis of Key Aggregate Components of CPI
Aggregate CPI Component Analysis (BLS, Investor Acumen)
We will briefly review how to interpret the table above (as well as other tables in this report), describing each column from left to right. The first column contains the MoM percent change for the current month. The second column contains the MoM percent change in the prior month. The third column contains the MoM acceleration – i.e., the difference between the percent change this month minus the percent change last month. The fourth column contains the Cumulative Contribution to the percent MoM change of CPI. This describes exactly how much each component contributed to the cumulative All Items MoM percent change in CPI. The sum of the values in this column will yield the MoM percent change of All Items CPI (with minor discrepancy due to rounding). Finally, the rightmost column contains the Cumulative Contribution to MoM Acceleration of All Items CPI. The sum of the contributions in this column adds up to the MoM Acceleration of All Items CPI. Although all five columns provide important information, we recommend that readers pay special attention to the rightmost column (Cumulative Contribution to Acceleration) as it reveals exactly what drove the MoM acceleration/deceleration in CPI during the current month compared to the prior month.
As can be seen in the table above, Energy decelerated significantly, accounting for most of the overall deceleration in All Items CPI. There was very little acceleration/deceleration in the other major components. More details will be provided below.
Analysis of CPI Components that Contributed Most to Change and Acceleration of CPI
In the following section, we perform the same contribution analysis as above, but at a more granular level of detail. In Figure 4 below, we list the top 10 CPI components (most granular level) that contributed negatively and positively to the MoM percent change in All Items CPI. These contributions take into account both the magnitude of the MoM change in each component as well as the weight of each component in All Items CPI.
Figure 4: Top Contributors to MoM Percent Change
Top CPI Contributors (BLS, Investor Acumen)
Housing continues to dominate the positive contributions to CPI, with no let up. However, it should be noted that real-time indicators of housing inflation are indicating strong deflationary trends in apartment rents, which will become reflected in CPI data within a few months.
Energy goods were the major negative contributors this month. Another notable negative contribution came from new and used cars. Based on real-time data, it's expected that new and used cars will continue to be negative (deflationary) contributors to CPI in coming months.
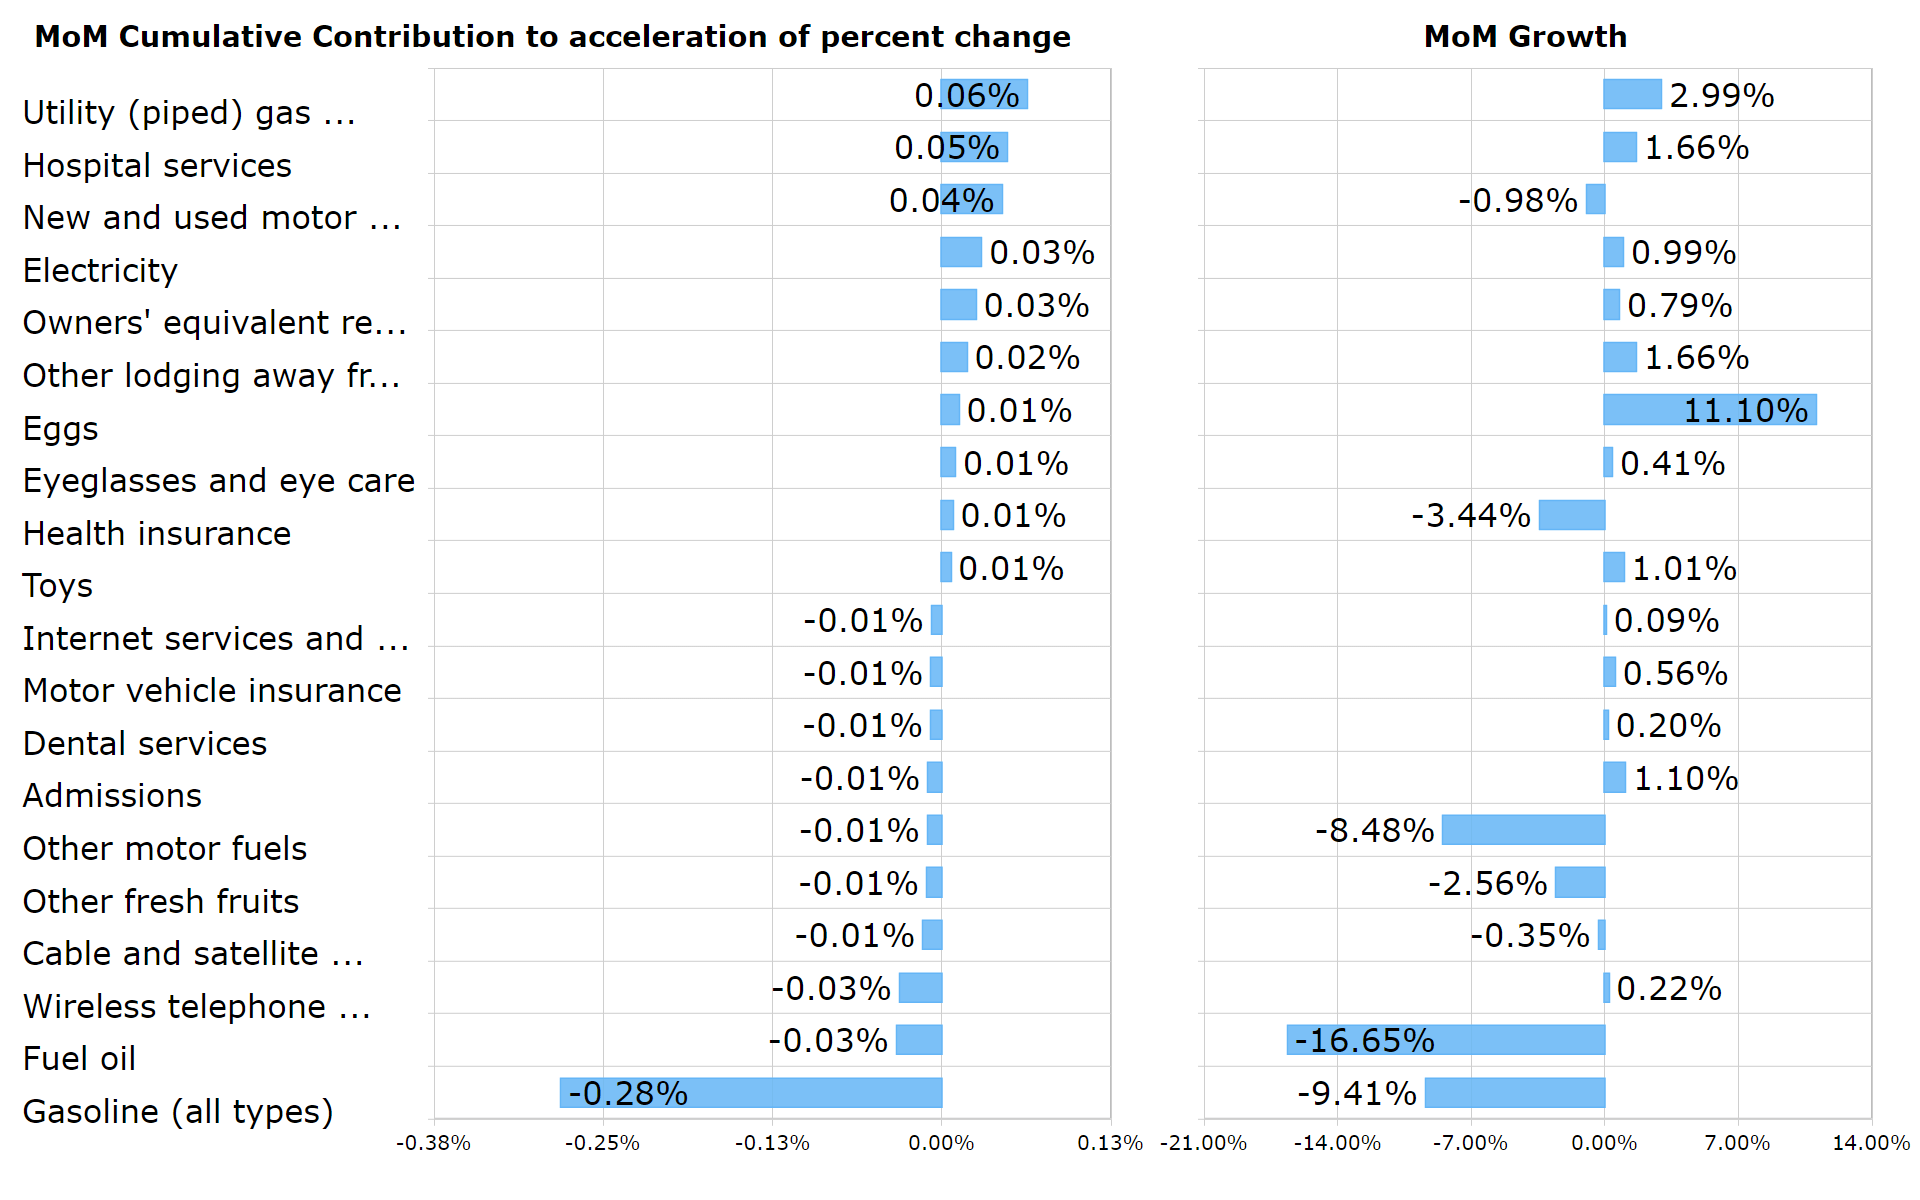
In Figure 5 below, we list the top 10 CPI components, at the most granular level, that contributed negatively and positively to the MoM acceleration (expressed in percent change) of All Items CPI. These contributions take into account both the magnitude of the MoM accelerations in the components as well as the weight of each component All Items CPI.
Figure 5: Top Contributors to MoM Acceleration
Top CPI Acceleration Contributors (Top CPI Acceleration Contributors)
It's worthwhile to examine tables 4 and 5 above carefully as they're likely to include most or all of the items which surprised forecasters during the month.
As can be seen this month, the only items that contributed significantly to deceleration of CPI were energy items. Utilities and hospital services contributed to acceleration.
Some analysts had been hoping from some relief from primary rents and owner's equivalent rent. Although this did not occur this month, it will occur within a few months.
Top Movers
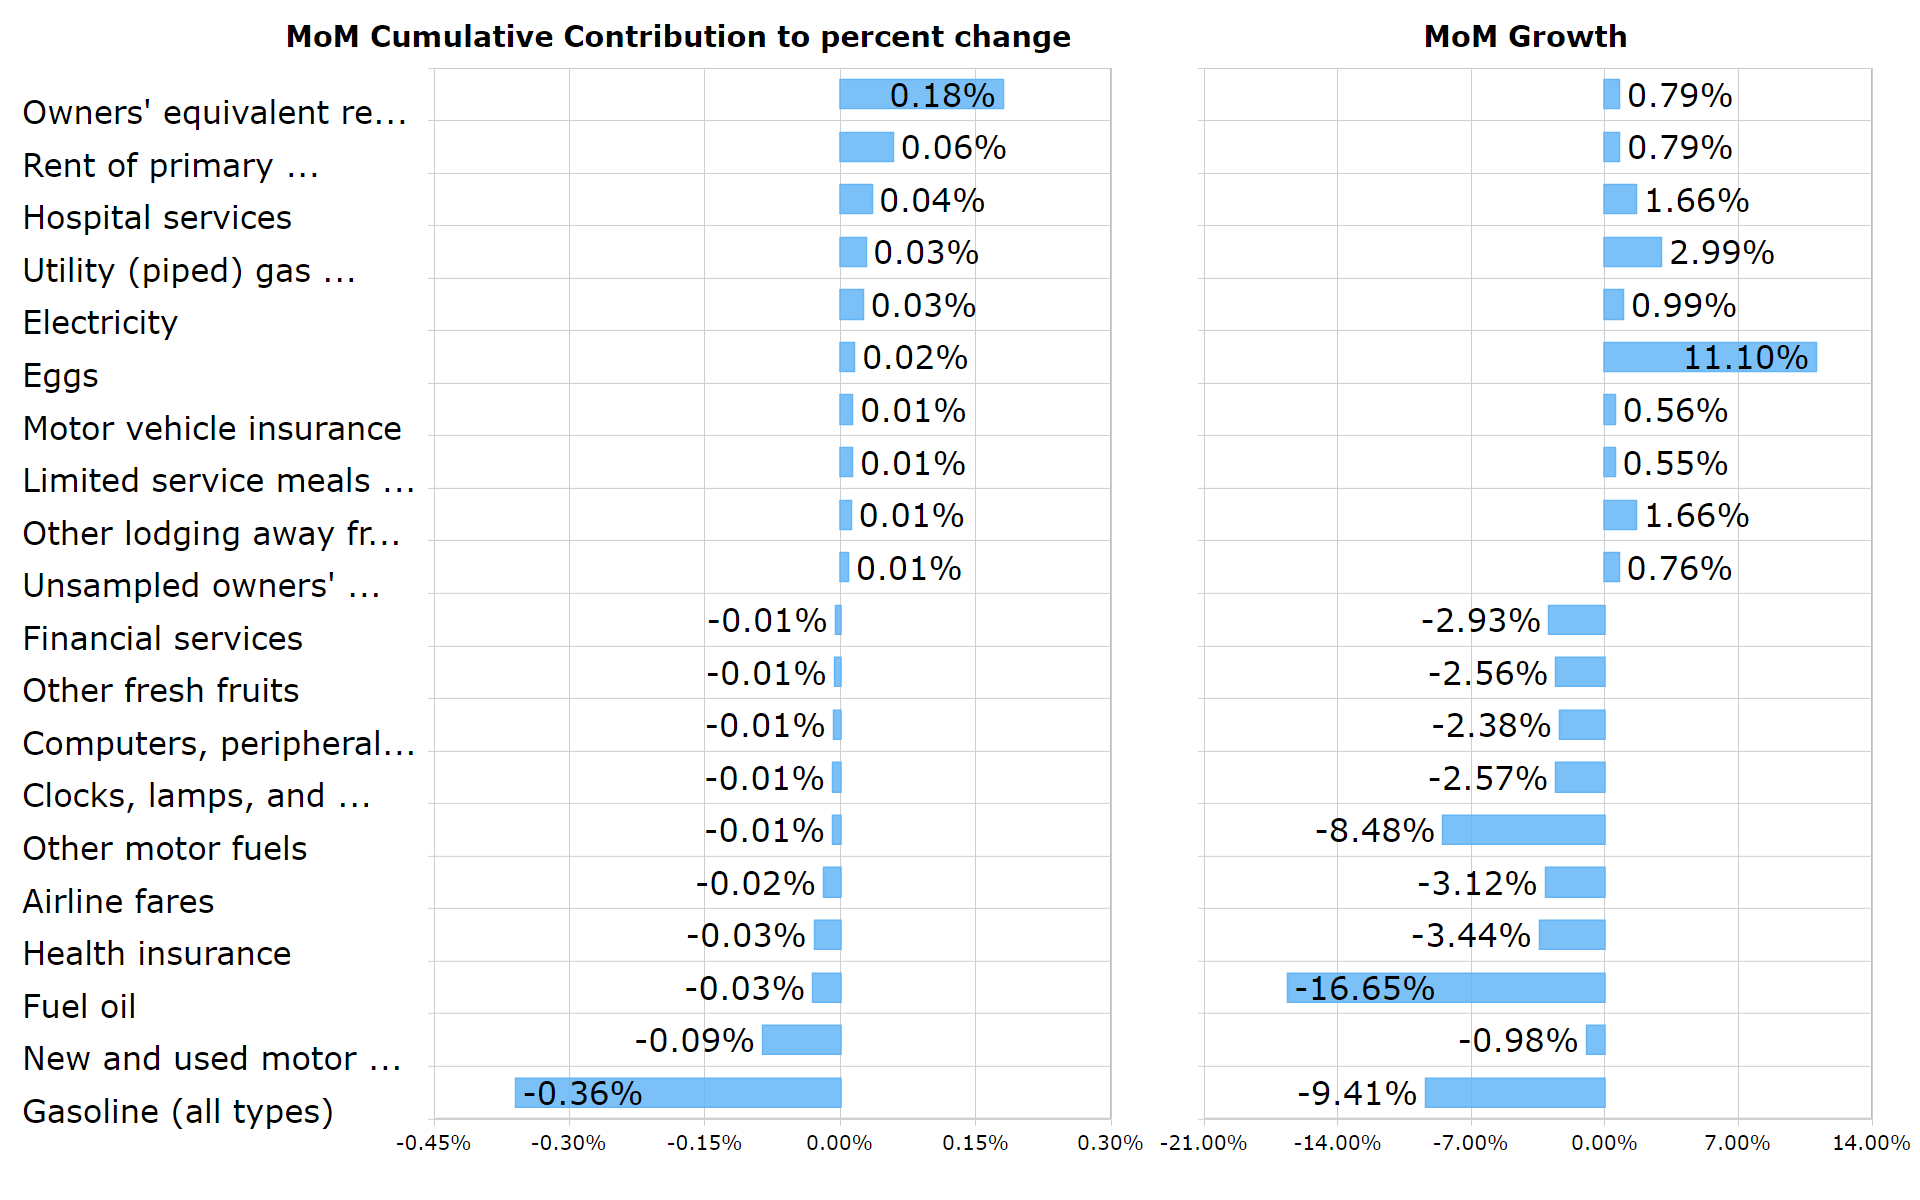
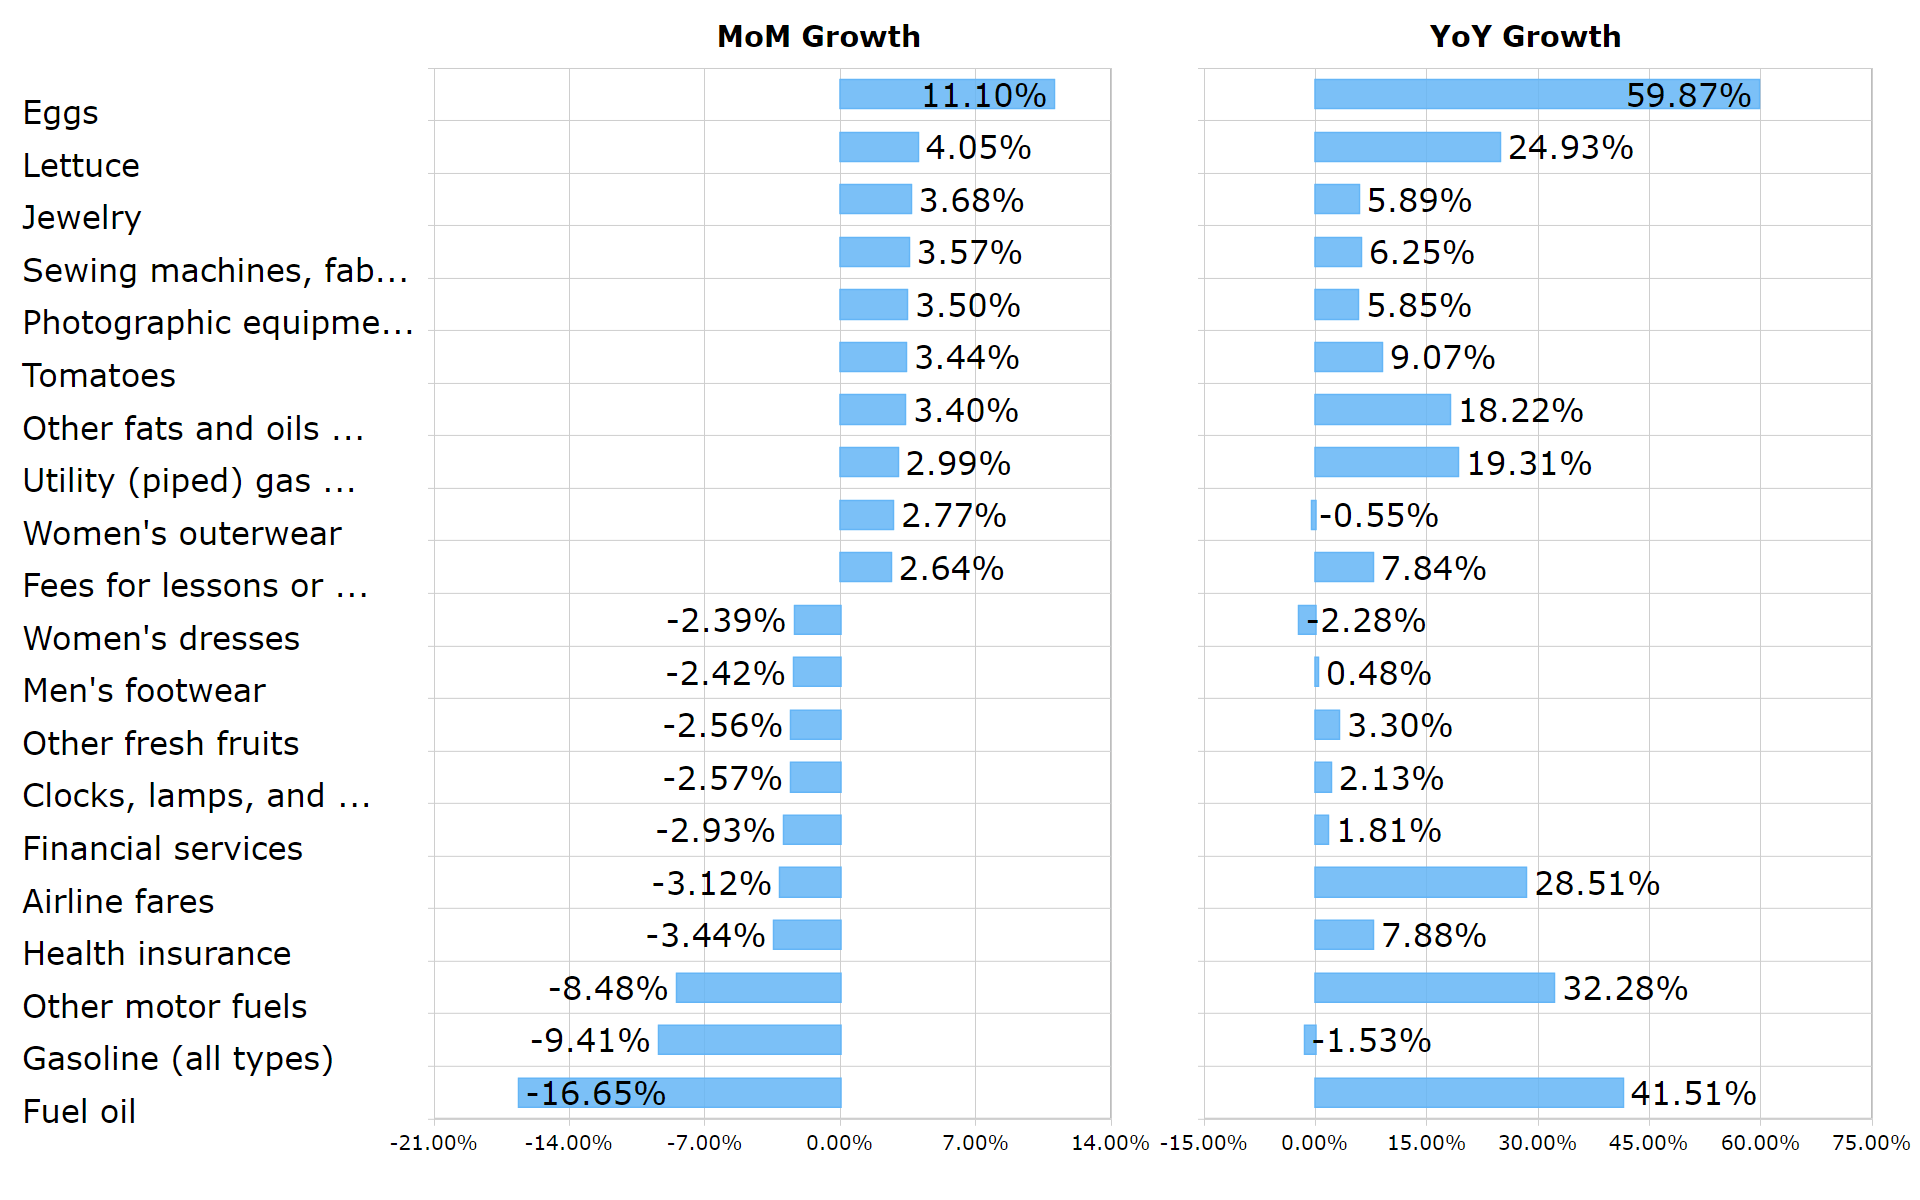
In Figure 6 below, for general interest purposes, we show the components with the largest positive and negative MoM change (%). The YoY change in these particular components is to the right.
Figure 6: Top Movers MoM Percent Change
Top CPI Movers (BLS, Investor Acumen)
Eggs experienced a very notable MoM increase of 11.10% in December. YoY the price of eggs has increased by almost 60%.
Implications for Policy and Economic Performance
In this section, we review the potential implications of this month’s CPI report on policy (monetary and or fiscal) and the overall outlook for the US economy.
Implications for the economy. The sharp deceleration of inflation in the past three months is increasing the probability of a "soft landing" for the US economy. First, data strongly suggest that inflation has peaked and is heading rapidly downward toward the Fed's 2.0% target. This is lowering risk premia related to inflation and is allowing interest rates to fall across the economy, including mortgage rates. A combination of interest rate relief, combined with less uncertainty about the inflation outlook, could boost both consumer and business spending above expectations.
Second, the Fed is likely to see this report as evidence that inflation is falling decisively towards its 2.0% target. This will allow the Fed to raise rates at slower increments (e.g. 25 bp vs 50 bp) and may lower the expected "terminal" rate at which the Fed will stop raising rates. Expectations of a "softening" of Fed policy along these lines can cause an easing of financial conditions and provide a boost for the economy.
Implications for financial markets. For financial markets, the implications of the disinflationary trends seen in recent data - including the current month - are clearly bullish. Risk premia in bond markets related to uncertainty about inflation and uncertainty about Fed Funds should continue to abate. Equity markets should also benefit from an easing in financial conditions.
For equities, there is one "hitch" in this otherwise bullish disinflationary environment. Falling inflation means companies are having more difficulty raising prices. However, wages are sticky, meaning that during much of 2023 wages may be rising faster than the ability of companies to raise their prices. This would put downward pressure on corporate profit margins - at least in some sectors of the economy.
Some analysts believe that corporate profit margins will be under severe pressure in 2023. Rapid disinflation, if it were to continue, would tend to support for this view.
Final Thoughts
Outside of housing, the CPI data are clearly reflecting strong disinflationary trends. Core goods have actually been in a deflationary trend for several months. While core services inflation has remained sticky, this has mainly been a function of lagging data on housing. The 3-month annualized trend of services CPI ex-housing is only 1.2%
Real-time data are clearly showing that rental prices are deflating. Within the next few months, CPI housing data will begin to reflect this deflationary trend in housing on a sequential basis.
Based on the fact that housing items represent over 40% of core CPI, the soon-to-be reflected deflationary housing data will start to exert a very strong downward influence on Core CPI, going forward.
Based on current trends, CPI is well on its way toward the Fed's 2% target by the end of 2023, or early 2024. Based on the Fed's own projections, this would represent a major surprise.
While disinflation is clearly a positive development for the US economy overall, it will bring its own set of unique challenges to financial markets, such as profit margin pressures and potentially higher real (as opposed to nominal) interest rates.
For further details see:
CPI: Disinflation Is Now A Clear Trend Which Will Dominate Markets