CEQP - Crestwood Equity Partners: Chronic Underperformer With Poor Distribution Coverage
2023-05-10 11:53:05 ET
Summary
- Investors should be aware that distribution coverage is a non-GAAP metric and reported values often do not tell the whole story.
- There is no standard definition for distributable cash flow, but a general and somewhat rigorous definition is: DCF = cash from operations - total Capex.
- CEQP's distribution coverage ratio fell well below the sustainable threshold of 1.3 after common units almost doubled from 63M to 105M in 2022.
- Given CEQP's poorly supported distribution, disappointing earnings history, and stubborn debt, I do not expect shares to offer a reasonable return or a safe distribution going forward.
- I recommend investors sell CEQP stock at current market prices.
Background
On May 2nd, Crestwood Equity Partners LP ( CEQP ) reported FQ1 23; GAAP EPS of $0.15 beating estimates by $0.05 while revenue of $1.26B (-20.3% Y/Y) missed by $40M. CEQP's press release included the following highlights:
First Quarter 2023 Financial Highlights 1
- First quarter 2023 net income of $41.6 million, compared to net income of $22.2 million in first quarter 2022, an increase of 87% year-over-year
- First quarter 2023 Adjusted EBITDA of $192.6 million, compared to $172.8 million in the first quarter 2022, an increase of 11% year-over-year
- First quarter 2023 distributable cash flow (“DCF”) to common unitholders of $103.6 million and a coverage ratio of 1.5x
The last bullet point notes a distribution coverage ratio of 1.5x . The " 1 " following the highlights heading references a note advising readers to see non-GAAP reconciliation tables included at the end of the press release. The tables reference the following caution regarding distributable cash flow:
(b) …Distributable cash flow should not be considered an alternative to cash flows from operating activities or any other measure of financial performance calculated in accordance with U.S. GAAP as those items are used to measure operating performance, liquidity, or the ability to service debt obligations. We believe that distributable cash flow provides additional information for evaluating our ability to declare and pay distributions to unitholders. Distributable cash flow, as we define it, may not be comparable to distributable cash flow or similarly titled measures used by other companies.
CEQP Distribution Coverage
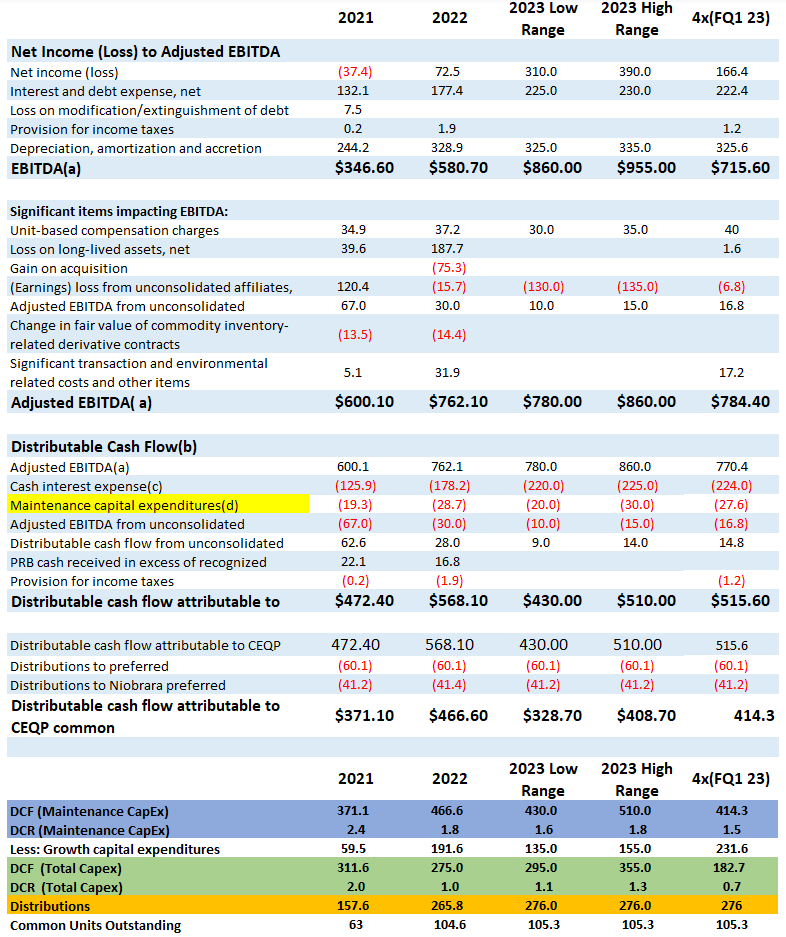
Although there is no standard definition distributable cash flow ((DCF)), a general and somewhat rigorous definition is: DCF = cash from operations - total Capex. A value of 1.3 is often considered a safe value when DCF is reduced by total Capex. CEQP provides a couple different tables detailing how the company defines DCF; both account for only maintenance Capex. The following table was assembled from several Reconciliation of Non-GAAP Financial Measures tables from CEQP's FQ1 23 press release and FQ4 22 press release .
CEQP Reconciliation of Non-GAAP Financial Measures ((M))
CEQP Press Releases
CEQP
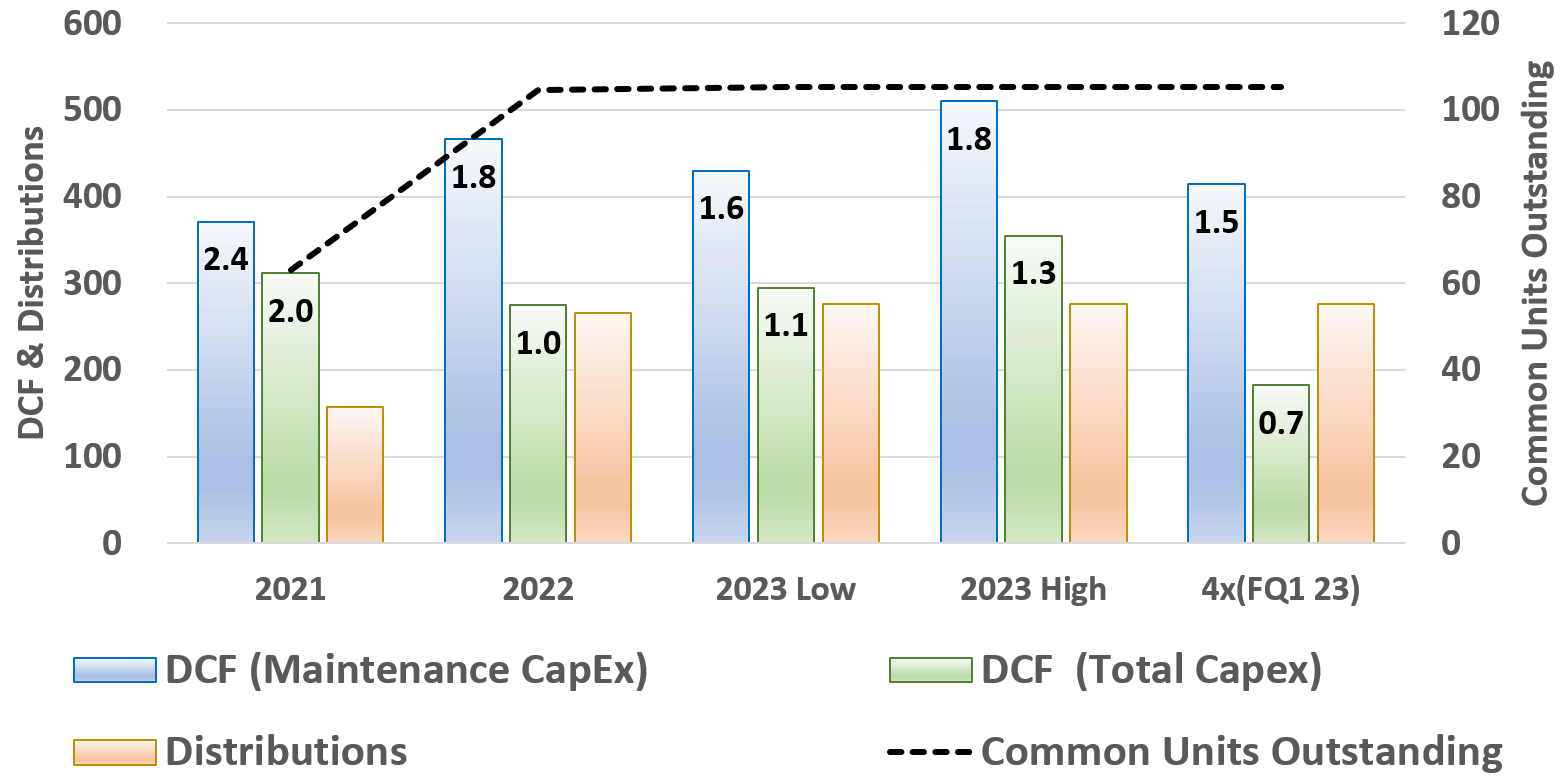
Adventurous readers are invited to make a fresh pot of coffee and dig through CEQP's non-GAAP reconciliation tables for non-stop fun. For everyone else, I have summarized the key points in the seven lower-most lines. DCF (Maintenance Capex) is DCF as CEQP defines it. DCF (Maintenance Capex) and its corresponding distribution coverage ratio, DCR (Maintenance Capex), are highlighted in dark blue. DCF (Total Capex) and its corresponding distribution coverage ratio, DCR (Total Capex) are highlighted in green. Distributions are highlighted in orange followed by common units outstanding. The summarized data are plotted below.
CEQP Distribution Coverage
Author, CEQP Data
Note, each DCF column is annotated with its corresponding coverage ratio. In 2021, distributions were solidly supported by both DCR (Maintenance Capex) and DCR (Total Capex) at 2.4 and 2.0 respectively. However, outstanding common units increased from 63M in 2021 to almost 105M in 2022. Subsequently, DCR (Total Capex) fell below the generally accepted 1.3 sustainable threshold. Despite guidance indicating sufficient 2023 distribution coverage, FQ1 23 results are concerning. Annualized DCR (Maintenance Capex) at 1.5 is exactly as promised. However, when accounting for total Capex, DCR is 0.7. If distributions are not fully supported, the ramifications include further dilution, added debt, or a distribution cut.
A Wider View of CEQP's Execution
Three years of disappointing distribution coverage is concerning but GAAP metrics are likely to provide a wider view of CEQP.
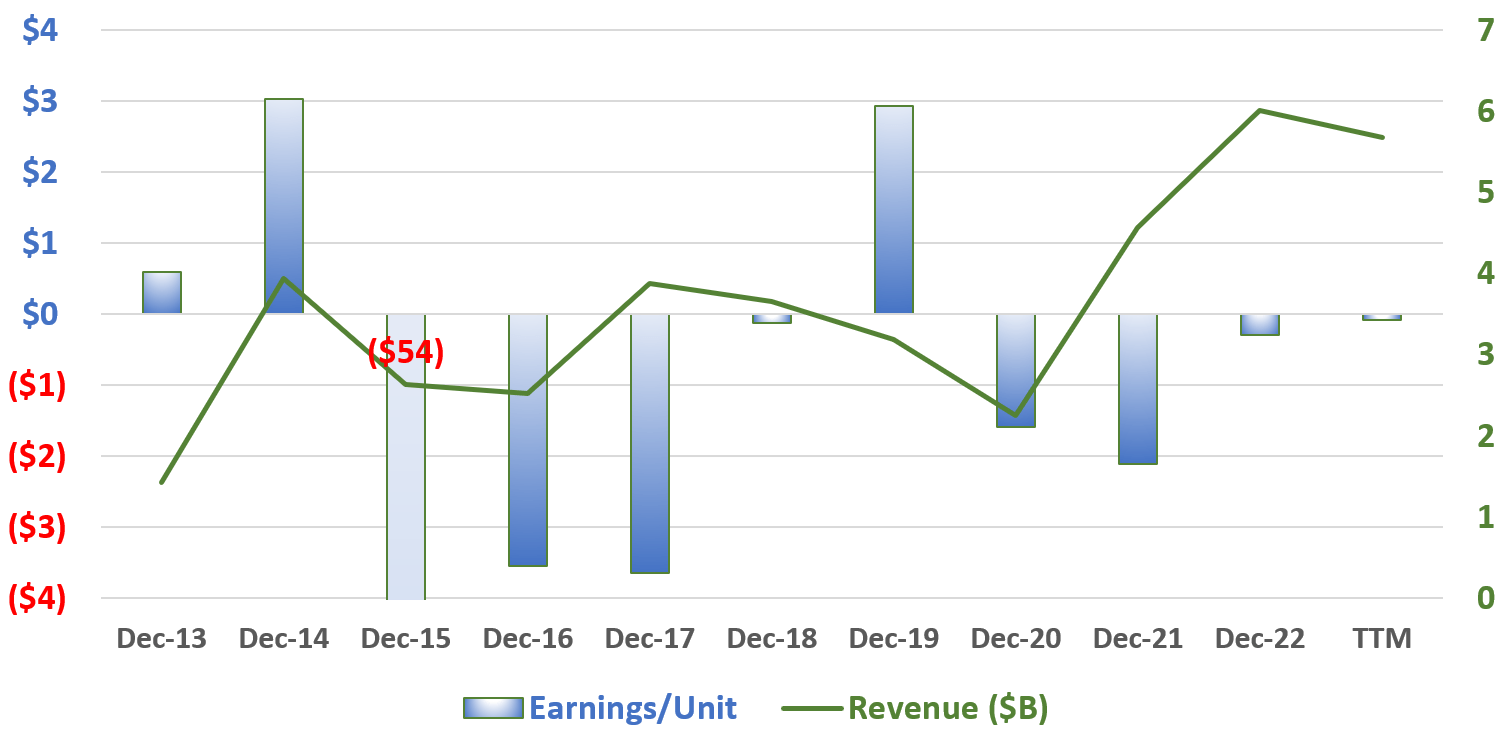
Earnings and Revenue: 2013 Forward
Author, SA Data
By GAAP measures, CEQP has only been profitable in two of the last 10 years. Although revenues have recently increased, earnings for the last 12 month are a loss of $0.09/unit.
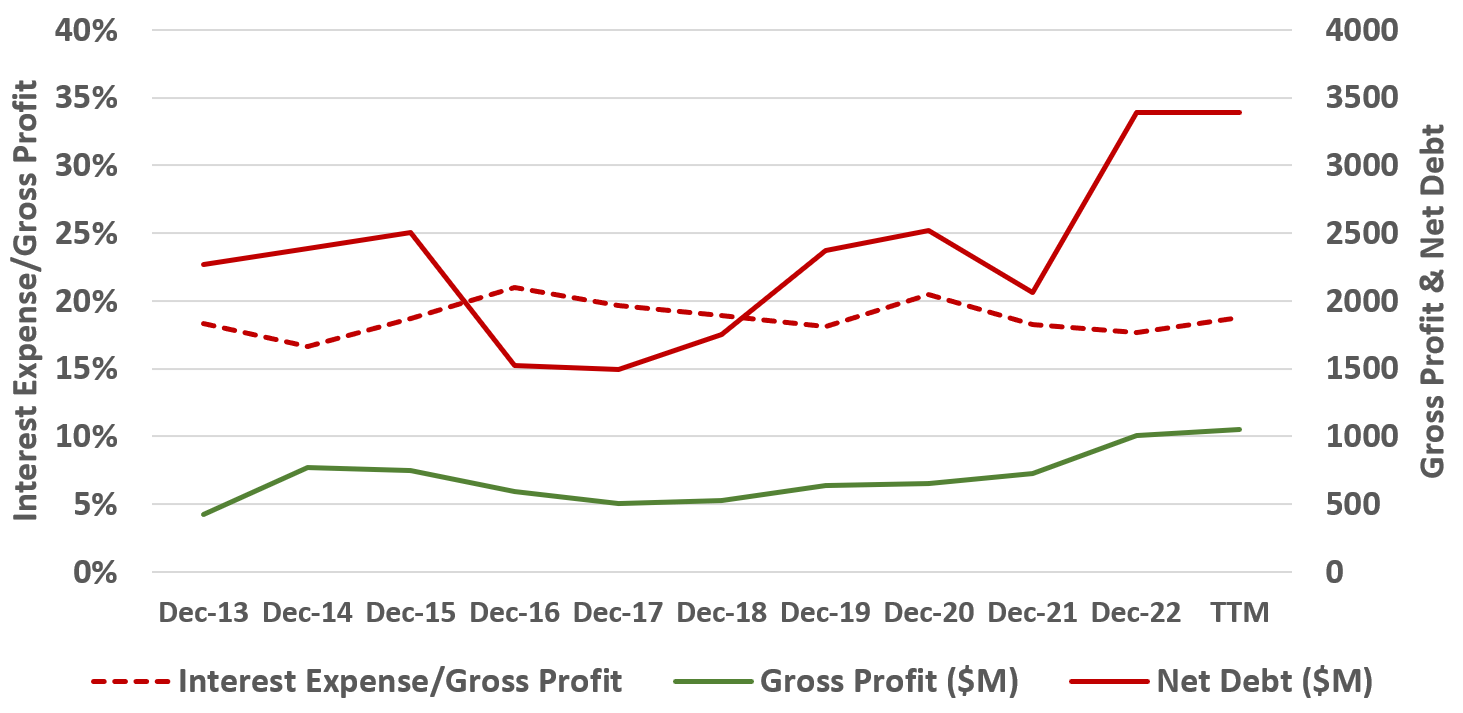
Debt Expenses vs Gross Profit
Author, SA Data
Since 2013, gross profits (green line) have increased almost 150% while net debt has increased about 50% . However, interest expense/gross profit has remained stubborn at just under 20%.
10Yr Total Return
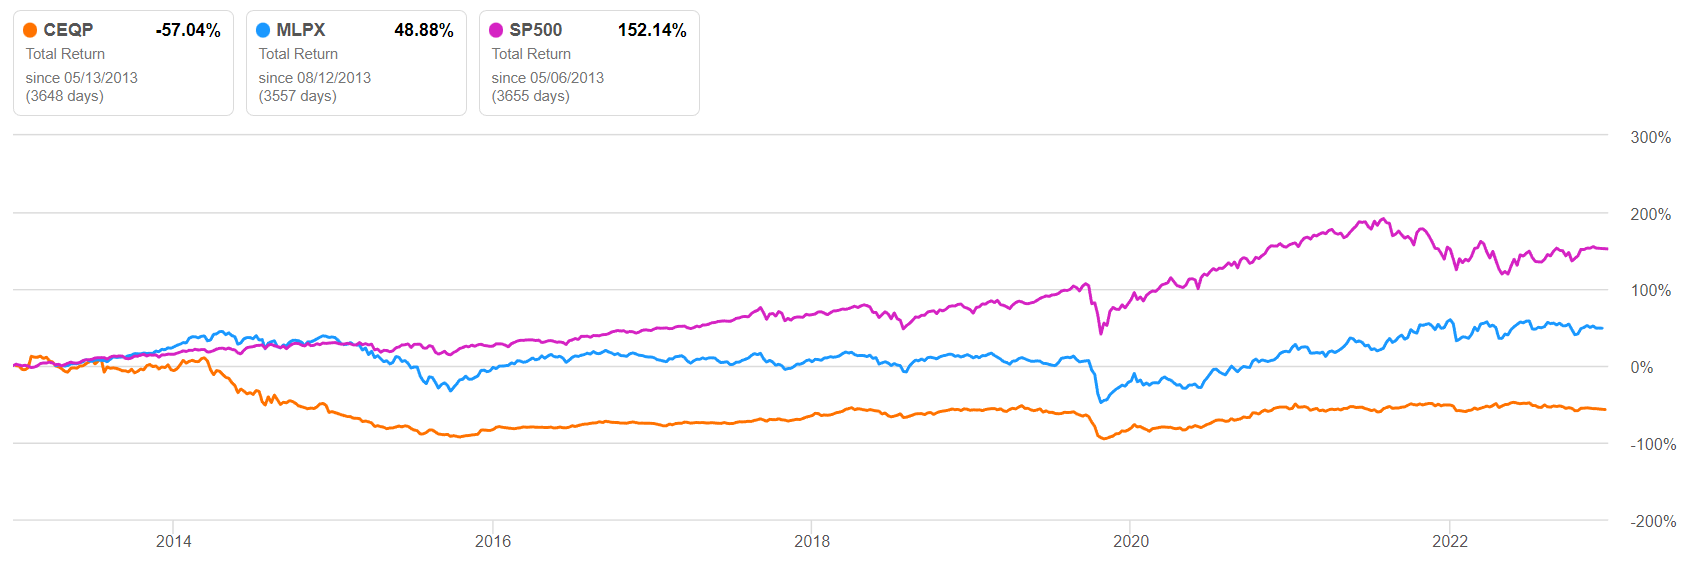
Seeking Alpha
Over 10 years CEQP total return was -57%. Over the same period, the Global X MLP & Energy Infrastructure ETF ( MLPX ) total return was almost 50% while the S&P 500 total return was over 150%.
Conclusions and Recommendations
Investors should be aware that distribution coverage is a non-GAAP metric and reported values often do not tell the whole story. There is no standard definition for distributable cash flow, but a general and somewhat rigorous definition is: DCF = cash from operations - total CaPex. A value of 1.3 is often considered safe when DCF is reduced by total Capex. CEQP's distribution coverage ratio fell well below 1.3 after common units almost doubled from 63M to 105M in 2022. Lastly, CEQP has only reported a profit in two of the last ten years.
Given CEQP's poorly supported distribution and stubborn debt, I do not expect shares to offer a reasonable return or a safe distribution going forward. I recommend investors sell CEQP at current market prices.
Information is a source of learning. But unless it is organized, processed, and available to the right people in a format for decision making, it is a burden, not a benefit. - William Pollard (Physicist and Theologian).
For further details see:
Crestwood Equity Partners: Chronic Underperformer With Poor Distribution Coverage