CEQP - Crestwood Equity Partners Preferreds: Sell On Limited Upside
2023-03-28 00:56:21 ET
Summary
- Over the last five years, CEQP.P total return has been dismal, underperforming S&P 500 by 11% and even the common shares, CEQP, by 9%.
- Since June 2020, Crestwood Equity Partners LP reported total losses of $3.39 per weighted share while paying common dividends of $7.05.
- Over the same period, total liabilities increased from $3.1B to $4.2B or 25.5%, while outstanding shares increased from 73.2 to 109.2 million or 33%.
- Although CEQP.P is currently trading below its par value of $9.15, I recommend investors sell CEQP.P at current market prices.
Background
Crestwood Equity Partners LP - Unit - Pfd Unit 9.25% ( CEQP.P ) are the preferred shares of Crestwood Equity Partners LP (CEQP ), an energy midstream company. I recently completed a survey of midstream energy companies entitled Midstream Energy Stocks Ranked By Quality . In that analysis, Crestwood Equity Partners LP compared poorly to 36 midstream peers ranking 31st for relative quality.
Preferred shares offer consistent dividends and enhanced bankruptcy protections. However when the underlying business is weak, preferred shares can be a poor investment with limited upside and considerable downside risk.
Chronic Underperformance
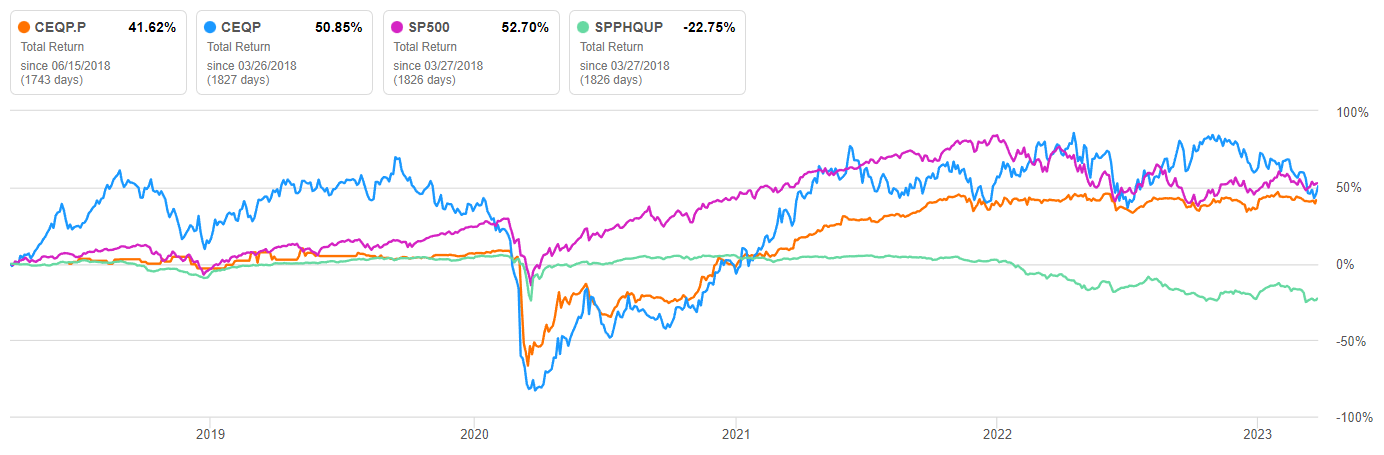
CEQP.P: 5YR Total Return
Seeking Alpha
CEQP.P, CEQP, S&P 500, and S&P U.S. High Quality Preferred Stock Index ( SPPHQUP ) total returns are plotted over 5 years. Over that period, CEQP.P return including dividends underperformed S&P 500 by 11% and even the common shares by 9%.
Over five years, SPPHQUP has underperformed S&P 500 by an alarming 75%. The performance of SPPHQUP may indicate chronic underperformance of preferred shares in general. Preferred shares are sometimes issued when a struggling company cannot raise capital by selling common shares or corporate bonds. Therefore, SPPHQUP under performance is likely to reflect, in part, the continued poor performance of struggling companies who issued preferred shares as a last resort. In short, preferred shares offer no guarantee of superior performance.
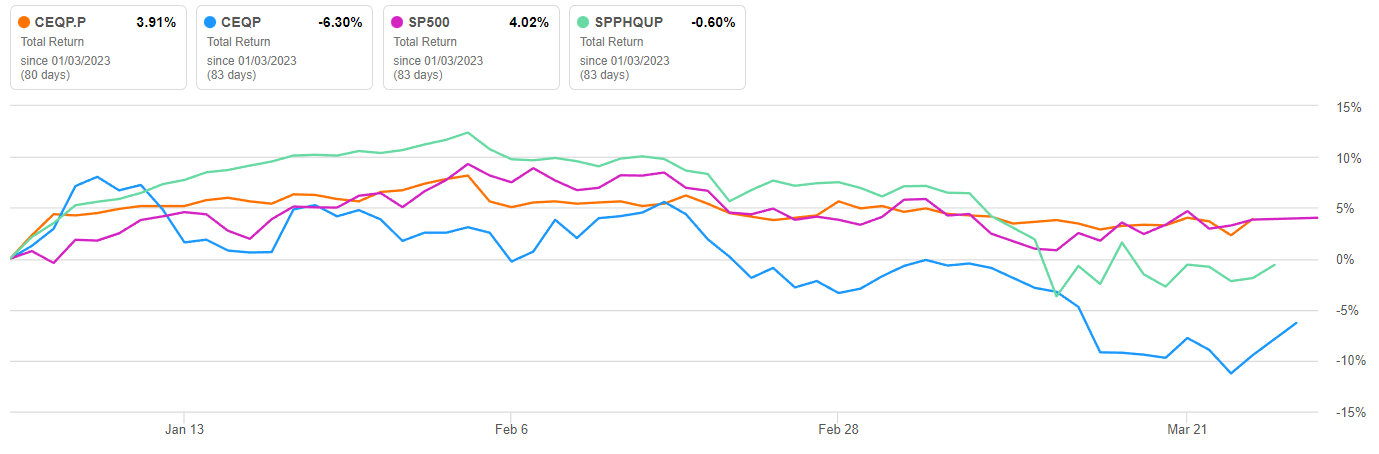
CEQP.P: YTD Total Return
Seeking alpha
YTD CEQP.P total returns are plotted against those of CEQP and S&P 500. YTD, CEQP.P total return has underperformed S&P 500 by less than 1% while outperforming the falling common shares by 10%.
Limited Upside and Downside Risk
In my recently completed survey of midstream energy companies , Crestwood Equity Partners LP not only compared poorly to its midstream peers, it also ranked dead last for dividend payout ratio indicating the dividend is likely unsupported by earnings.
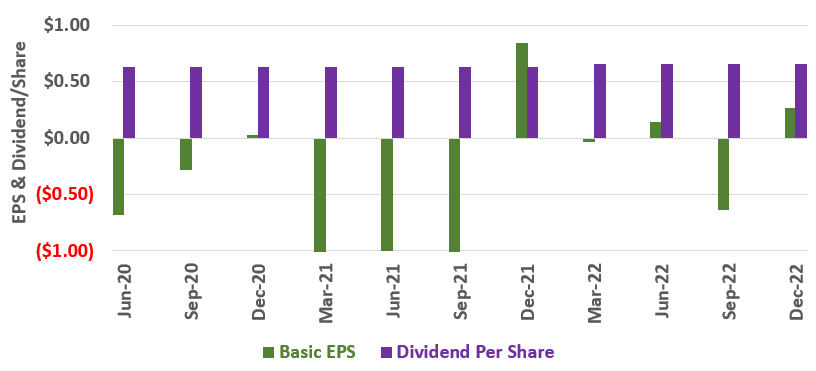
Crestwood Equity Partners LP: EPS and Dividend/Weighted Share
Author, SA Data
Since June 2020, Crestwood Equity Partners LP: has reported negative EPS for 6 quarters while paying an average dividend of $0.64/weighted share each quarter. From June 2020 forward, total dividends were $7.05 while total earnings were a loss of $3.39. This would be impossible without the shareholder dilution and increased liabilities shown below.
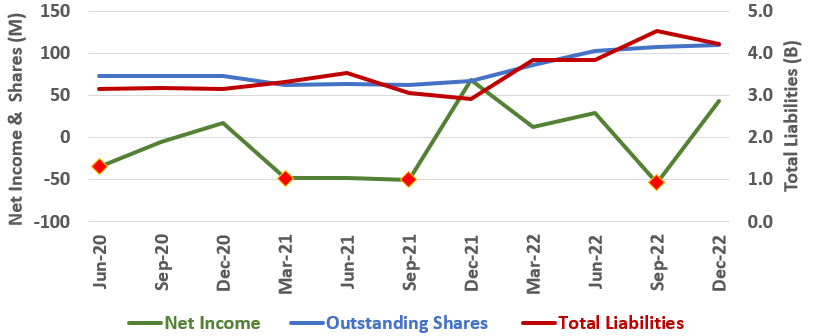
Crestwood Equity Partners LP: Net Income, Shares, & Liabilities
Author, SA Data
Net Income, Outstanding shares, and Total Liabilities are plotted from June of 2020 forward. Over the period Crestwood Equity Partners LP reported total losses of $70M while increasing total liabilities from $3.1B to $4.2B or 25.5%. Over the same period, outstanding shares increased from 73.2 to 109.2 million or 33%.
Consensus 2023 EPS estimate is $1.25/weighted share. On January 19th 2023, the company declared a quarterly distribution of $0.655/common share ($2.620 annually) and a quarterly distribution of $0.2111/preferred share ($0.8444 annually). Clearly, these dividends are not supported by expected earnings in 2023.
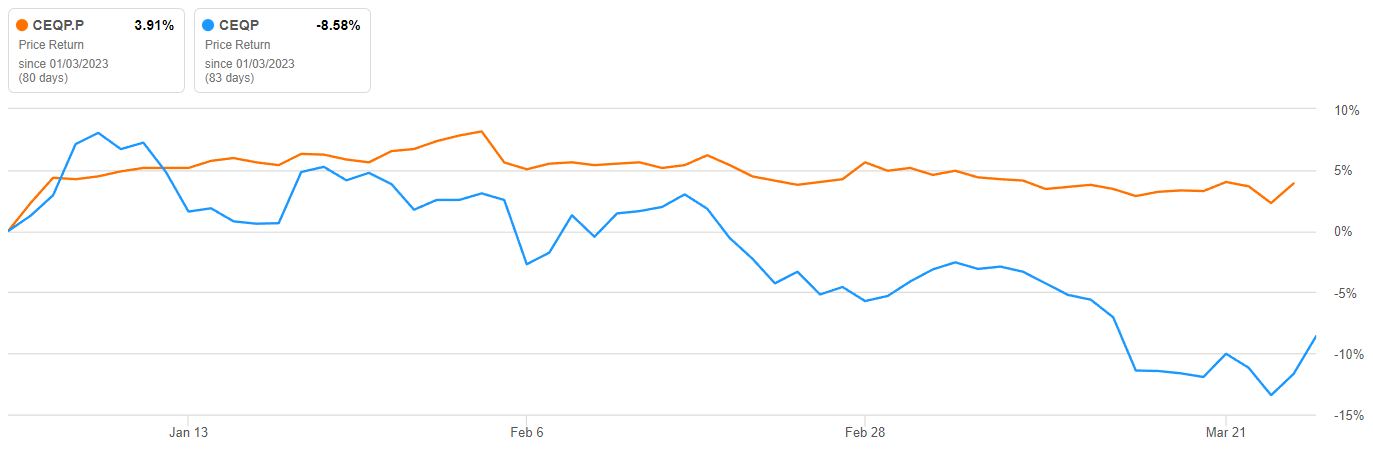
CEQP.P: YTD Performance vs CEQP
Seeking Alpha
YTD, CEQP.P has remained elevated with relation to CEQP and is currently trading at around $8.90, lightly below its par value of $9.15 . General market sentiment or further disappointing results from Crestwood Equity Partners LP could push CEQP.P lower. In fact, CEQP.P traded below $3.00 at its low point in 2020.
Conclusions and Recommendations
Over 5 years, Crestwood Equity Partners LP preferred shares total return underperformed S&P 500 by 11% and common shares by 9%. Year to date, preferred shares total return has underperformed S&P 500 by 1.54% while outperforming the common shares by 11.8%. I do not expect the preferred shares to continue to outperform the common shares unless the common shares dip sharply.
From June 2020 forward, Crestwood Equity Partners LP's dividends have not been supported by earnings. Over the period, the company has continued to pay dividends despite reporting net losses over the period. Furthermore, 2023 dividends are unsupported by estimated earnings. Although the preferred shares' dividends are relatively safe, I expect the common share dividend to be cut going forward with a resulting steep decline in common share price. I expect the preferred shares to also decline if the common share dividend is cut.
While CEQP.P downside may be limited, upside is also limited; I recommend investors sell CEQP.P at current market prices . Those investors who remain interested in midstream energy exposure may find my recent an alysis Midstream Energy Stocks Ranked By Quality helpful.
Chance has little effect upon the wise man, for his greatest and highest interests are directed by reason throughout the course of life. - Epicurus, The Principal Doctrines
For further details see:
Crestwood Equity Partners Preferreds: Sell On Limited Upside