BSJT - Despite More 'Defensive' Qualities Why Did Canadian Investment Grade Underperform Their U.S. Peers During The Banking Crisis?
2023-04-28 04:30:00 ET
Summary
- Canadian corporates succumbed to heightened risk aversion in March, following the banking turmoil, before the swift US and Swiss central bank market interventions calmed markets.
- Both Canadian and US credit spreads widened during the risk-off episode in March and they remain wider than their pre-banking crisis levels.
- There are industry, duration, and credit quality differences between Canadian and US IG markets.
By Sandrine Soubeyran, Global Investment Research, FTSE Russell
Canadian corporates succumbed to heightened risk aversion in March, following the banking turmoil, before the swift US and Swiss central bank market interventions calmed markets. While Canada IG has shown initial resilience during the financial instability in March, it has underperformed US IG during the recovery. Why?
The extent of the fear of contagion can be seen in the shape of the 10/2s Canadian government yield curve in Chart 1. As Canadian investors reached for the safety of short-dated government bonds, this caused the 10/2s curve to become less inverted as a result, as banking frailties developed. But, although the move in the Canadian yield curve was less pronounced than the US, partly because US banks took centre stage in the crisis, both US and Canadian curves subsequently 're-inverted' to similar, less negative, levels than prior to the banking crisis. Also, it is worth noting that contrary to perception, Canadian government bonds and the yield curve do not always track closely US Treasuries, as illustrated by the differing reactions in March.
FTSE Russell
Different stages in central bank policy
One explanation for the more modest Canadian curve reaction is the Bank of Canada's policy pause, whereby a bigger decline occurred in US 1-3-year yields. Unlike the Fed, the BoC has already paused policy and is, therefore, projected to be among the first G7 countries to ease. In the US, Fed futures show approximately 25bp of further tightening in May, before 50bp of easing by end-2023, while the Fed's dot plots show rates peaking at 5.1% on the median, with no rate cuts until 2024.
Canadian IG yield spreads stay high vs US IG?
Both Canadian and US credit spreads widened during the risk-off episode in March and they remain wider than their pre-banking crisis levels. However, as Chart 2 shows, although US and Canadian HY spreads re-tightened markedly after central bank market intervention, Canadian IG spreads narrowed much less.
FTSE Russell
A closer inspection of the Canadian and US HY and IG spreads in Charts 3 shows US IG spreads re-tightened through early April, while Canadian IG spreads remained flat, as the modest rebound in government bond yields was mostly offset by a rise in Canadian IG corporate yields. This meant Canadian and US corporate spreads decoupled after briefly converging in March (Chart 3A). Chart 3B also shows how much more volatile US sub-IG spreads were during the recovery phase and how much more they tightened compared to Canadian HY spreads.
FTSE Russell
Another reason for the decoupling of US and Canadian IG spreads can be found in the absolute yields of both Canadian and US IG bonds and their respective benchmark 7-10-year government bond yields.
As Chart 4 shows, during the initial risk-off period in March, Canadian government bond yields fell more than US Treasury yields. But, during the subsequent recovery phase, Canadian 7-10-year government yields remained flat, while Canadian IG yields rose. For the US, both the IG corporate and 7-10-year Treasury yields declined.
FTSE Russell
Another key factor is that there are industry, duration, and credit quality differences between Canadian and US IG markets. Canadian IG bonds, represented by the FTSE Canada All Corporate Bond Index, and US IG corporates, by the FTSE US Broad-Investment Grade - Corporate Index, are used for the purpose of this analysis.
From Table 1, Canadian IG has a higher Financials weighting than US IG and Chart 5 clearly shows the sharp spike in Canadian spreads during the banking crisis led by Financials (dark blue line), as a result.
FTSE Russell
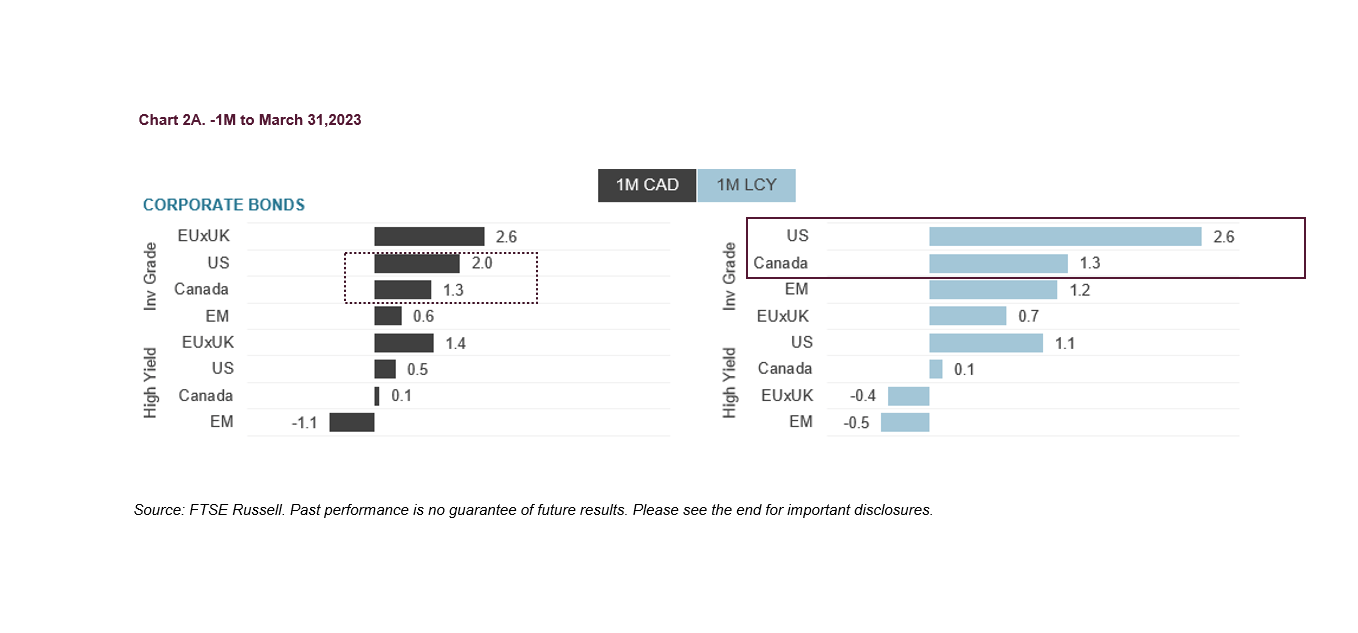
Examination of the IG indices, for Canada and the US, also suggests the shorter duration (by about 1.5 years) of the Canadian IG index might explain its underperformance during the recovery phase (Chart 4), when Canadian IG returned 1.3% versus 2.0% (2.6% in LC) by US IG bonds, in Canadian dollar terms. The returns in Table 2 capture both the banking crisis and recovery periods during March.
© 2023 London Stock Exchange Group plc and its applicable group undertakings (the "LSE Group"). The LSE Group includes (1) FTSE International Limited ("FTSE"), (2) Frank Russell Company ("Russell"), (3) FTSE Global Debt Capital Markets Inc. and FTSE Global Debt Capital Markets Limited (together, "FTSE Canada"), (4) FTSE Fixed Income Europe Limited ("FTSE FI Europe"), (5) FTSE Fixed Income LLC ("FTSE FI"), (6) The Yield Book Inc ("YB") and (7) Beyond Ratings S.A.S. ("BR"). All rights reserved.
FTSE Russell® is a trading name of FTSE, Russell, FTSE Canada, FTSE FI, FTSE FI Europe, YB, and BR. "FTSE®", "Russell®", "FTSE Russell®", "FTSE4Good®", "ICB®", "The Yield Book®", "Beyond Ratings®" and all other trademarks and service marks used herein (whether registered or unregistered) are trademarks and/or service marks owned or licensed by the applicable member of the LSE Group or their respective licensors and are owned, or used under licence, by FTSE, Russell, FTSE Canada, FTSE FI, FTSE FI Europe, YB or BR. FTSE International Limited is authorised and regulated by the Financial Conduct Authority as a benchmark administrator.
All information is provided for information purposes only. All information and data contained in this publication is obtained by the LSE Group, from sources believed by it to be accurate and reliable. Because of the possibility of human and mechanical error as well as other factors, however, such information and data is provided "as is" without warranty of any kind. No member of the LSE Group nor their respective directors, officers, employees, partners, or licensors make any claim, prediction, warranty, or representation whatsoever, expressly or impliedly, either as to the accuracy, timeliness, completeness, merchantability of any information or of results to be obtained from the use of FTSE Russell products, including but not limited to indexes, data, and analytics, or the fitness or suitability of the FTSE Russell products for any particular purpose to which they might be put. Any representation of historical data accessible through FTSE Russell products is provided for information purposes only and is not a reliable indicator of future performance.
No responsibility or liability can be accepted by any member of the LSE Group nor their respective directors, officers, employees, partners, or licensors for ((A)) any loss or damage in whole or in part caused by, resulting from, or relating to any error (negligent or otherwise) or other circumstance involved in procuring, collecting, compiling, interpreting, analysing, editing, transcribing, transmitting, communicating or delivering any such information or data or from use of this document or links to this document or ((B)) any direct, indirect, special, consequential or incidental damages whatsoever, even if any member of the LSE Group is advised in advance of the possibility of such damages, resulting from the use of, or inability to use, such information.
No member of the LSE Group nor their respective directors, officers, employees, partners, or licensors provide investment advice and nothing in this document should be taken as constituting financial or investment advice. No member of the LSE Group nor their respective directors, officers, employees, partners, or licensors make any representation regarding the advisability of investing in any asset or whether such investment creates any legal or compliance risks for the investor. A decision to invest in any such asset should not be made in reliance on any information herein. Indexes cannot be invested in directly. Inclusion of an asset in an index is not a recommendation to buy, sell or hold that asset nor confirmation that any particular investor may lawfully buy, sell or hold the asset or an index containing the asset. The general information contained in this publication should not be acted upon without obtaining specific legal, tax, and investment advice from a licensed professional.
Past performance is no guarantee of future results. Charts and graphs are provided for illustrative purposes only. Index returns shown may not represent the results of the actual trading of investable assets. Certain returns shown may reflect back-tested performance. All performance presented prior to the index inception date is back-tested performance. Back-tested performance is not actual performance but is hypothetical. The back-test calculations are based on the same methodology that was in effect when the index was officially launched. However, back-tested data may reflect the application of the index methodology with the benefit of hindsight, and the historic calculations of an index may change from month to month based on revisions to the underlying economic data used in the calculation of the index.
This document may contain forward-looking assessments. These are based upon a number of assumptions concerning future conditions that ultimately may prove to be inaccurate. Such forward-looking assessments are subject to risks and uncertainties and may be affected by various factors that may cause actual results to differ materially. No member of the LSE Group nor their licensors assume any duty to and do not undertake to update forward-looking assessments.
No part of this information may be reproduced, stored in a retrieval system, or transmitted in any form or by any means, electronic, mechanical, photocopying, recording, or otherwise, without prior written permission of the applicable member of the LSE Group. Use and distribution of the LSE Group data requires a licence from FTSE, Russell, FTSE Canada, FTSE FI, FTSE FI Europe, YB, BR, and/or their respective licensors.
Editor's Note: The summary bullets for this article were chosen by Seeking Alpha editors.
For further details see:
Despite More 'Defensive' Qualities, Why Did Canadian Investment Grade Underperform Their U.S. Peers During The Banking Crisis?