AGCO - DFAT: Best Of Breed Small Cap Fund
2023-08-14 07:01:39 ET
Summary
- Dimensional U.S. Targeted Value ETF (DFAT) is an actively managed fund that focuses on small cap companies with value characteristics.
- DFAT has a solid $8.7 billion in assets and a healthy average daily volume, making it suitable for long-term investment and trading strategies.
- DFAT has outperformed its benchmark, the Russell 2000 Value Index, and its competitors in the last 12 months, showing strong performance relative to peers.
This article series aims at evaluating ETFs (exchange-traded funds) regarding past performance and portfolio metrics. Reviews with updated data are posted when necessary.
DFAT strategy and portfolio
Dimensional U.S. Targeted Value ETF ( DFAT ) invests in small cap companies with value characteristics. It was launched as a mutual fund on 12/11/1998 and listed as an ETF on 06/14/2021. Therefore, historical data series for the ticker DFAT start in June 2021. The fund has a solid $8.7B in assets and a healthy average daily volume of $13.71M, which makes it suitable not only as a long-term investment, but also as a trading instrument for swing trading and tactical allocation strategies (for example, switching between value and growth styles, or between small and large caps). DFAT has 1606 holdings, a dividend yield of 1.34% and a total expense ratio of 0.28%. As an actively managed fund, it doesn't track any index. The portfolio turnover rate in the most recent fiscal year was 8%, which is quite low in this fund category (it is a good point).
As described in the prospectus by Dimensional , "the Advisor implements an integrated investment approach that combines research, portfolio design, portfolio management, and trading functions (…) The Portfolio may emphasize certain stocks, including smaller capitalization companies, lower relative price stocks, and/or higher profitability stocks (…) The criteria the Advisor uses for assessing relative price and profitability are subject to change from time to time". In other words, it looks more like a discretionary approach than a strictly rules-based one. This description offers a lot of flexibility to managers: it may be a source of uniqueness, and possibly of outperformance. On the downside, unlike index-based ETFs, the strategy is a blackbox impossible to duplicate or backtest.
The fund invests exclusively in U.S. companies. Based on Fidelity classification, about 81% of asset value is in small and micro-caps, the rest is in mid-caps. In this article, DFAT will be compared to the benchmark chosen by Dimensional: the Russell 2000 Value Index, represented hereafter by iShares Russell 2000 Value ETF ( IWN ).
Based on aggregate ratios reported in the next table, DFAT is close to IWN regarding valuation, and significantly cheaper than the broader small cap benchmark Russell 2000 ( IWM ).
| DFAT |
| IWN |
| IWM |
| Price / Earnings TTM |
| 9.26 |
| 9.23 |
| 12.29 |
| Price / Book |
| 1.36 |
| 1.28 |
| 1.92 |
| Price / Sales |
| 0.71 |
| 0.89 |
| 1.18 |
| Price / Cash Flow |
| 6.69 |
| 6.16 |
| 8.83 |
Source: Fidelity
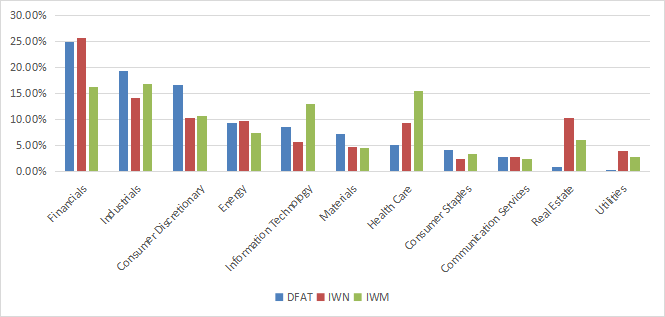
The next chart compares sector weights in the three funds. For the two value funds DFAT and IWN, financials come first and industrials are in second position. Both DFAT and IWN overweight financials and underweight healthcare relative to the Russell 2000. Compared to IWN, DFAT overweights mostly industrials, consumer discretionary, technology and materials. It drastically underweights healthcare, real estate and utilities. Banks are the heaviest industry in DFAT portfolio (about 15% of assets), which is a factor of risk, especially after the recent distress signals in regional banks.
Sector Breakdown (Chart: author; data: Dimensional, iShares)
The top 10 holdings, listed below with valuation ratios, represent 6.5% of asset value. No holding weighs more than 1%, so the portfolio is well-diversified and risks related to individual companies are very low.
| Ticker |
| Name |
| Weight |
| P/E ttm |
| P/E fwd |
| P/Sales |
| P/Book |
| P/FCF |
| Yield% |
| PulteGroup, Inc. |
| 0.83% |
| 6.85 |
| 7.06 |
| 1.10 |
| 1.91 |
| 10.27 |
| 0.77 |
| Penske Automotive Group, Inc. |
| 0.71% |
| 9.90 |
| 10.49 |
| 0.41 |
| 2.70 |
| 56.73 |
| 1.66 |
| Arrow Electronics, Inc. |
| 0.69% |
| 6.51 |
| 7.89 |
| 0.20 |
| 1.31 |
| 27.50 |
| 0 |
| Builders FirstSource, Inc. |
| 0.64% |
| 11.46 |
| 11.31 |
| 1.02 |
| 4.36 |
| 6.18 |
| 0 |
| Knight-Swift Transportation Holdings, Inc. |
| 0.64% |
| 18.87 |
| 27.60 |
| 1.41 |
| 1.37 |
| 25.69 |
| 0.94 |
| HF Sinclair Corp |
| 0.63% |
| 5.04 |
| 6.82 |
| 0.33 |
| 1.18 |
| 6.57 |
| 3.03 |
| Toll Brothers, Inc. |
| 0.62% |
| 6.34 |
| 7.45 |
| 0.85 |
| 1.39 |
| 7.59 |
| 1.06 |
| Owens Corning |
| 0.61% |
| 10.01 |
| 10.36 |
| 1.33 |
| 2.57 |
| 16.30 |
| 1.47 |
| AGCO Corp. |
| 0.57% |
| 8.61 |
| 8.31 |
| 0.68 |
| 2.31 |
| 92.59 |
| 4.83 |
| BorgWarner, Inc. |
| 0.54% |
| 10.08 |
| 10.48 |
| 0.57 |
| 1.27 |
| 21.96 |
| 1.08 |
Ratios: Portfolio123
Performance
Dimensional claims an annualized return since inception ( 12/11/1998 ) of 9.96% vs. 8.73% for the Russell 2000 Value Index.
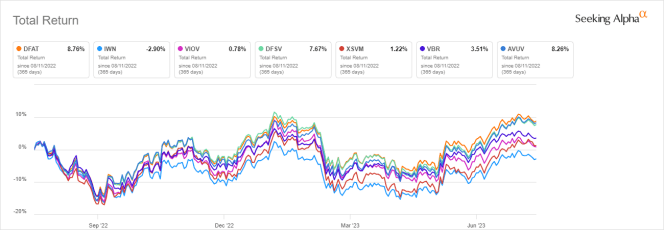
The next chart compares 12-month total returns of DFAT, IWN and five other small cap value ETFs:
- Vanguard S&P SmallCap 600 Value ETF ( VIOV ). reviewed here ,
- Dimensional US Small Cap Value ETF ( DFSV ), reviewed here ,
- Invesco S&P SmallCap Value with Momentum ETF ( XSVM ), reviewed here ,
- Vanguard Small Cap Value ETF ( VBR ),
- Avantis U.S. Small Cap Value ETF ( AVUV ).
DFAT is the best performer, shortly ahead of two other actively managed funds: DFSV, its sibling by Dimensional, and AVUV, by Avantis.
Comparing DFAT with a simple, but efficient, quantitative value strategy
The next table compares DFAT since 6/21/2021 with a "Russell 2000 Value set", composed of Russell 2000 stocks whose price/earnings, price/sales and price/net free cash flow ratios are below industry medians. The subset is reconstituted in equal weights every quarter.
| Total Return |
| Annual Return |
| Drawdown |
| Sharpe ratio |
| Volatility |
| DFAT |
| 12.84% |
| 5.79% |
| -20.07% |
| 0.28 |
| 22.41% |
| Value set |
| 4.63% |
| 2.13% |
| -24.85% |
| 0.1 |
| 22.48% |
| IWM |
| -13.53% |
| -6.55% |
| -31.91% |
| -0.27 |
| 21.65% |
| IWN |
| -7.61% |
| -3.62% |
| -25.68% |
| -0.12 |
| 22.00% |
Past performance is not a guarantee of future returns. Data Source: Portfolio123
The value set does much better than IWM and IWN, but DFAT beats it by a significant margin. Moreover, the maximum drawdown is shallower.
Past performance suggests the strategy is smarter than passively managed value ETFs, which generally rely too much on the price/book ratio and don't take into account industry classification.
Takeaway
Dimensional U.S. Targeted Value ETF is an actively managed fund combining size and value, two of the three original factors of the Fama-French model. It also takes profitability into account. DFAT is an old mutual fund dating back from 1998, listed as an ETF in June 2021. The heaviest sectors in the portfolio are financials and industrials. The fund is close to the Russell 2000 Value Index regarding valuation ratios, but it has outperformed it by over 11 percentage points in the last 12 months. It has also beaten its competitors in the same time frame. Another actively managed fund is coming close: Avantis U.S. Small Cap Value Fund. DFAT shows an excellent performance relative to peers, healthy AUM and volume, quite a low expense ratio, and very few downsides. Among them, a significant exposure to banks and a lack of transparency in the strategy. The latter is also a strength when it comes to keep a competitive edge.
For further details see:
DFAT: Best Of Breed Small Cap Fund