DFIV - DFIV: Japan-Heavy Low-P/E Mix Worth Shortlisting
2023-12-14 21:57:40 ET
Summary
- Listed in 2021, DFIV has an investment strategy focused on developed-world equities (outside the U.S.) with value characteristics.
- For an active strategy, DFIV has a reasonable expense ratio of just 27 bps. Its AUM of $6.1 billion is one of the largest in the sub class.
- The fund offers a mostly interesting value story with an overall strong performance since September 2021.
- For investors seeking value and FX exposures, I believe it is worth shortlisting DFIV.
Continuing my series of articles on international exchange-traded funds, today I would like to provide a review of the Dimensional International Value ETF ( DFIV ). I suppose the moment is rather opportune, as a few investors might suggest that the recent Fed's decision to keep interest rates steady opened the door for USD depreciation vs. the basket of developed world currencies, including the yen and the euro. Regarding the JPY, since the end of November, traders have already been betting on the paths of the Bank of Japan and the Fed diverging, thus allowing it to stage a massive recovery, as shown by the performance of the Invesco CurrencyShares Japanese Yen Trust ETF ( FXY ).
For DFIV, which has an about 21.3% allocation to Japan, this might be especially beneficial. There are other reasons why I believe it is worth shortlisting the fund, to be detailed shortly.
A brief strategy discussion
DFIV leverages an active strategy revolving around non-U.S.-developed world equities with value characteristics. To be precise, as mentioned on its website , the investment objective
is to achieve long-term capital appreciation while minimizing federal income taxes on returns.
The most recent prospectus says that the ETF
is designed to generally purchase securities of large non-U.S. companies in countries with developed markets that the Advisor determines to be lower relative price stocks.
It seems there is a profitability ingredient in the strategy as well, since:
The Advisor may overweight certain stocks, including smaller companies, lower relative price stocks, and/or higher profitability stocks within the large-cap value segment of developed ex U.S. markets.
Regarding the metrics considered, the following clarification is provided on page 32:
An equity issuer is considered to have a low relative price (i.e., a value stock) primarily because it has a low price in relation to its book value. In assessing relative price, the Advisor may consider additional factors such as price to cash flow or price to earnings ratios. An equity issuer is considered to have high profitability because it has high earnings or profits from operations in relation to its book value or assets.
Please pay attention to the fact that, even though the fund was incepted in April 1999, it was listed as an ETF in September 2021 .
Portfolio: a Japan-heavy low-P/E mix
As of December 11, DFIV had a portfolio of 541 equities, including different share classes, like in the case of Volvo AB (A and B shares) and Volkswagen AG ( VWAGY ) (VOW and VOW3 tickers in the holdings dataset, representing ordinary and preference shares, respectively).
As I can deduce from the country codes shown in the 'ticker' column in the DFIV holdings dataset, which can be found on its website, the portfolio represents 22 countries, from Australia and Austria to Switzerland and the UK. The top countries are Japan (21.3%), the UK (13.6%), and France (11.5%), which I would say is rather standard for developed world-centered strategies. New Zealand, Portugal, and Austria have the smallest weights, ranging from 21 bps to 11 bps.
The principal currency exposures are the JPY, GBP, and EUR. Its exposures to the Israeli shekel and the Kiwi dollar, which is how the NZD is sometimes addressed informally, are the smallest.
It is worth noting that I have not found any South Korean companies among holdings, which might be explained by the fact that the debate on whether South Korea is a developed or an emerging market is still far from over, which I briefly touched upon in the August article on the Pacer Developed Markets International Cash Cows 100 ETF ( ICOW ). Unlike DFIV, ICOW has exposure to Korean equities, though rather small, of about 5.4% as of December 12.
Delving deeper, it is somewhat confusing that DFIV has 21 holdings with a 'US' code both in the 'ticker' and 'ISIN' columns. Nevertheless, these are not U.S. companies, with examples being NYSE-listed (via ADRs) Shell plc ( SHEL ) and BP plc ( BP ), London-based energy supermajors, and Novartis AG ( NVS ), a Basel-based healthcare sector heavyweight, etc.
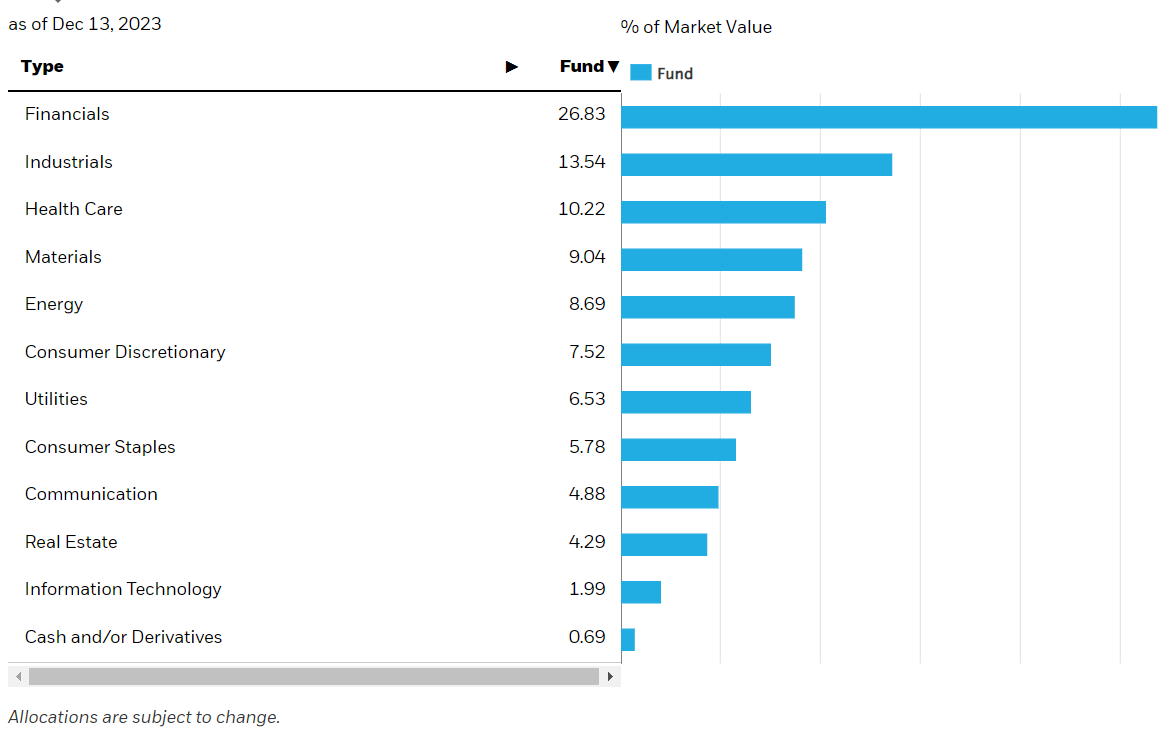
Next, the fund's website shows financials as the key sector in the portfolio, with a 28.1% weight, followed by energy (14.5%) and materials (13.9%). This is in contrast to the sector mix of the iShares MSCI EAFE Value ETF ( EFV ), which also has a meaningful footprint in old-economy sectors, yet its allocation to energy and materials is notably lower.
iShares; the screenshot taken on December 14
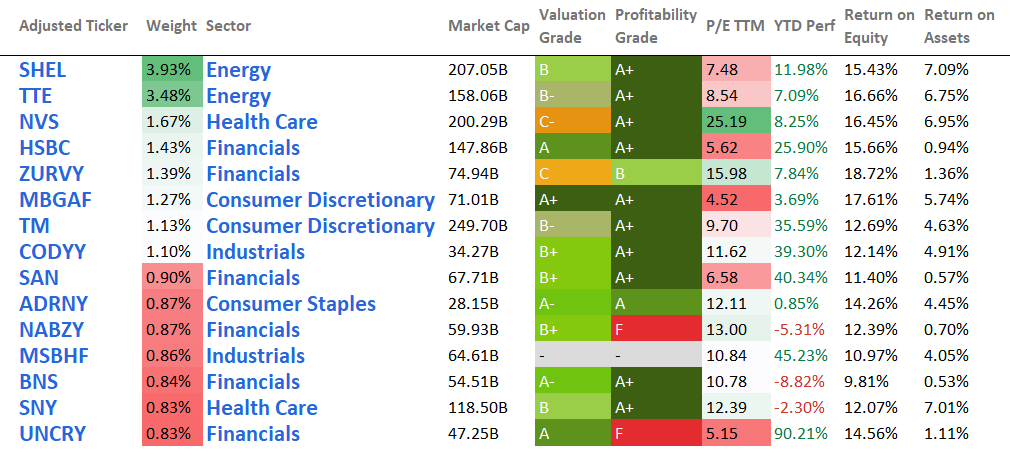
Below, I have compiled the major financial metrics for the top 15 holdings of the fund (a 21.4% weight), excluding cash and cash equivalents, that were in 13th place with an 86 bps weight; a few tickers were adjusted.
| Adjusted Ticker |
| Original Ticker |
| Company |
| ( SHEL ) |
| SHEL US |
| SHELL PLC |
| ( TTE ) |
| TTE FP |
| TOTALENERGIES SE |
| ( NVS ) |
| NVS US |
| NOVARTIS AG ADR |
| ( HSBC ) |
| HSBC US |
| HSBC HOLDINGS PLC |
| ( ZURVY ) |
| ZURN SW |
| ZURICH INSURANCE GROUP AG |
| ( MBGAF ) |
| MBG GR |
| Mercedes-Benz Group AG |
| ( TM ) |
| 7203 JP |
| TOYOTA MOTOR CORP |
| ( CODYY ) |
| SGO FP |
| CIE DE SAINT-GOBAIN |
| ( SAN ) |
| SAN SM |
| BANCO SANTANDER SA |
| ( ADRNY ) |
| AD NA |
| KONINKLIJKE AHOLD DELHAIZE |
| ( NABZY ) |
| NAB AU |
| NATIONAL AUSTRALIA BANK |
| ( MSBHF ) |
| 8058 JP |
| MITSUBISHI CORP |
| N/A |
| N/A |
| CASH AND CASH EQUIVALENTS |
| ( BNS ) |
| BNS US |
| BANK OF NOVA SCOTIA/THE |
| ( SNY ) |
| SAN FP |
| SANOFI |
| ( UNCRY ) |
| UCG IM |
| UNICREDIT SPA |
Holdings as of December 11; created using data from Seeking Alpha and the fund
Regarding SHEL, I should also note that the fund holds both the NYSE-quoted ADRs and the London Stock Exchange-quoted shares.
| Ticker |
| Company |
| Weight |
| ISIN |
| SHEL LN |
| SHELL PLC |
| 0.56% |
| GB00BP6MXD84 |
| SHEL US |
| SHELL PLC |
| 3.93% |
| US7802593050 |
Created using data from Seeking Alpha and the fund; financial data as of December 12
From the sample above, I suppose it is crystal clear that the fund delivers a rather interesting value story, even with the heaviest components having appealing Quant Valuation grades. P/Es also look supportive of a value thesis, as most names selected sport a single-digit or a low double-digit ratio, with the median standing at just 10.8x.
For a better context, the table below compares the fund's Price/Earnings to a few peers that focus on developed world equities (excluding the U.S.):
| Ticker |
| Price/Earnings TTM |
| DFIV |
| 8.56 |
| iShares MSCI EAFE ETF ( EFA ) |
| 13.33 |
| iShares MSCI EAFE Value ETF ( EFV ) |
| 9.52 |
| Vanguard FTSE Developed Markets ETF ( VEA ) |
| 12.49 |
| Pacer Developed Markets International Cash Cows 100 ETF ( ICOW ) |
| 7.25 |
| Cambria Foreign Shareholder Yield ETF ( FYLD ) |
| 7.97 |
Data from Portfolio Visualizer
DFIV scores excellently here, demonstrating a much more attractive multiple than EFA and EFV. Still, ICOW and FYLD look even cheaper. Please take notice that the Pacer fund has a markedly different sector mix, with no exposure to financials owing to the index methodology, and energy (32%) and industrials (25%) being its principal allocations.
Paceretfs.com; the screenshot taken on December 14
Performance discussion: mostly solid, for now
Launched in September 2021, with just two full trading years in the books for now, the ETF's strategy has already demonstrated its potency. To corroborate, below is the comparison of its total returns delivered over the October 2021–November 2023 period to EFV, EFA, ICOW, VEA, and the iShares Core S&P 500 ETF ( IVV ).
| Portfolio |
| DFIV |
| EFA |
| EFV |
| VEA |
| ICOW |
| IVV |
| Initial Balance |
| $10,000 |
| $10,000 |
| $10,000 |
| $10,000 |
| $10,000 |
| $10,000 |
| Final Balance |
| $11,070 |
| $9,898 |
| $10,862 |
| $9,710 |
| $10,562 |
| $10,976 |
| CAGR |
| 4.80% |
| -0.47% |
| 3.89% |
| -1.35% |
| 2.56% |
| 4.39% |
| Stdev |
| 20.10% |
| 19.82% |
| 19.06% |
| 20.01% |
| 21.08% |
| 19.71% |
| Best Year |
| 12.62% |
| 12.37% |
| 13.13% |
| 11.70% |
| 14.16% |
| 20.75% |
| Worst Year |
| -3.67% |
| -14.35% |
| -5.18% |
| -15.36% |
| -7.95% |
| -18.16% |
| Max. Drawdown |
| -21.81% |
| -27.44% |
| -22.89% |
| -27.89% |
| -23.98% |
| -23.93% |
| Sharpe Ratio |
| 0.18 |
| -0.08 |
| 0.14 |
| -0.12 |
| 0.08 |
| 0.16 |
| Sortino Ratio |
| 0.27 |
| -0.12 |
| 0.21 |
| -0.18 |
| 0.12 |
| 0.24 |
| Market Correlation |
| 0.78 |
| 0.88 |
| 0.77 |
| 0.9 |
| 0.78 |
| 1 |
Data from Portfolio Visualizer
DFIV has the highest CAGR, with the primary reason being its relatively strong performance amid the 2022 bear market, as it declined by just 3.67% while the rest of the group lost much more. Additionally, DFIV delivered a maximum drawdown of just 21.8%, while all the selected ETFs suffered steeper losses amid peak market stress last year.
Investor takeaway
DFIV has an investment strategy focused on developed-world stocks with value characteristics. For an actively managed vehicle, DFIV has a reasonable expense ratio of just 27 bps. Its AUM of $6.1 billion is one of the largest in the Foreign Large Value sub-class.
As illustrated by the Valuation grades of the main 15 holdings and the P/E ratio compared to DFIV's counterparts, this Japan-heavy fund offers a mostly interesting value story. Importantly, it has already demonstrated a rather strong performance, beating a few peers and even IVV since September 2021. So in sum, for investors seeking value and FX exposures, I believe it is worth shortlisting DFIV.
For further details see:
DFIV: Japan-Heavy Low-P/E Mix Worth Shortlisting