DFSV - DFSV: Actively Managed ETFs Lead The Small Cap Value Style (Rating Downgrade)
2024-01-11 09:34:53 ET
Summary
- Dimensional US Small Cap Value ETF is an actively managed fund holding over 1000 small caps.
- The DFSV ETF selects stocks based on valuation and profitability. It is well-diversified across holdings, but quite heavy in the financial sector.
- DFSV has outperformed the Russell 2000 benchmark and passively managed small-cap value ETFs since its inception, but faces competition from Avantis U.S. Small Cap Value ETF.
This article series aims at evaluating ETFs (exchange-traded funds) regarding past performance and portfolio metrics. Reviews with updated data are posted when necessary.
DFSV strategy
Dimensional US Small Cap Value ETF ( DFSV ) is an actively managed ETF launched on 02/23/2022. It has a portfolio of 1023 stocks, a trailing 12-month distribution yield of 1.32% and an expense ratio of 0.31%. Distributions are paid quarterly.
As described in the prospectus by Dimensional , the fund managers select stocks based on price to book, price to cash flow and price to earnings ratios. Profitability is also taken into account, with a preference for companies with high earnings or profits from operations in relation to book value or assets. However, “ the criteria the Advisor uses for assessing relative price and profitability are subject to change from time to time. ” Such a strategy description allows a lot of flexibility. On the downside, it also lacks of transparency, like for most actively managed funds. The portfolio turnover rate was 11% for the most recent fiscal year and 4% the prior year, which is very low.
DFSV portfolio
The portfolio is almost exclusively invested in U.S. based companies (over 99% of asset value). The heaviest sectors are financials (27%), industrials (18.8%) and consumer discretionary (15.7%). Other sectors are below 11%. Compared to the small-cap benchmark Russell 2000 Index, represented hereafter by iShares Russell 2000 ETF ( IWM ), the fund overweights mostly financials, consumer discretionary, energy and materials. It massively underweights technology, healthcare, real estate, and almost ignores utilities.
DFSV sector breakdown (chart: author; data: Dimensional, iShares)
As expected from a value fund, DFSV is significantly cheaper than the Russell 2000 (RTY) regarding aggregate valuation ratios, as reported in the next table.
| DFSV |
| IWM |
| Price/Earnings TTM |
| 8.84 |
| 13.01 |
| Price/Book |
| 1.07 |
| 1.74 |
| Price/Sales |
| 0.67 |
| 1.07 |
| Price/Cash Flow |
| 5.6 |
| 7.91 |
Source: Fidelity.
The portfolio is well-diversified: the top 10 holdings, listed in the next table with valuation ratios, represent only 6.1% of asset value. The largest position is below 1%, so risks related to individual companies are very low.
| Ticker |
| Name |
| Weight% |
| P/E ttm |
| P/E fwd |
| P/Sales |
| P/Book |
| P/FCF |
| Yield |
| PVH Corp. |
| 0.71% |
| 14.26 |
| 11.55 |
| 0.80 |
| 1.45 |
| 20.50 |
| 0.12 |
| United States Steel Corp. |
| 0.71% |
| 10.63 |
| 11.37 |
| 0.67 |
| 1.11 |
| N/A |
| 0.41 |
| Amkor Technology, Inc. |
| 0.65% |
| 18.67 |
| 22.09 |
| 1.14 |
| 1.97 |
| 22.95 |
| 1.02 |
| Murphy Oil Corp. |
| 0.60% |
| 8.53 |
| 8.21 |
| 1.76 |
| 1.19 |
| 15.26 |
| 2.72 |
| Mohawk Industries, Inc. |
| 0.60% |
| N/A |
| 11.59 |
| 0.60 |
| 0.92 |
| 8.94 |
| 0 |
| Thor Industries, Inc. |
| 0.59% |
| 20.94 |
| 16.91 |
| 0.58 |
| 1.56 |
| 9.24 |
| 1.69 |
| Elanco Animal Health, Inc. |
| 0.59% |
| N/A |
| 16.96 |
| 1.74 |
| 1.24 |
| N/A |
| 0 |
| Taylor Morrison Home Corp. |
| 0.55% |
| 6.52 |
| 7.16 |
| 0.72 |
| 1.11 |
| 4.86 |
| 0 |
| Bank OZK |
| 0.55% |
| 8.49 |
| 8.32 |
| 2.72 |
| 1.21 |
| 8.48 |
| 3.13 |
| Commercial Metals Co. |
| 0.54% |
| 7.55 |
| 9.34 |
| 0.68 |
| 1.38 |
| 9.46 |
| 1.30 |
Ratios: Portfolio123.
DFSV against competitors
The next table compares characteristics of DFSV and four small cap value ETFs:
- iShares Russell 2000 Value ETF ( IWN ), reviewed here
- Vanguard S&P Small-Cap 600 Value ETF ( VIOV )
- Vanguard Small-Cap Value ETF ( VBR )
- Avantis U.S. Small Cap Value ETF ( AVUV ).
| DFSV |
| IWN |
| VIOV |
| VBR |
| AVUV |
| Inception |
| 2/23/2022 |
| 7/24/2000 |
| 9/7/2010 |
| 1/26/2004 |
| 9/24/2019 |
| Expense Ratio |
| 0.31% |
| 0.24% |
| 0.15% |
| 0.07% |
| 0.25% |
| AUM |
| $2.47B |
| $12.11B |
| $1.47B |
| $52.13B |
| $8.88B |
| Avg Daily Volume |
| $13.79M |
| $236.32M |
| $6.08M |
| $90.54M |
| $61.23M |
DFSV has the highest fee and is second to last regarding liquidity measured in dollar volume.
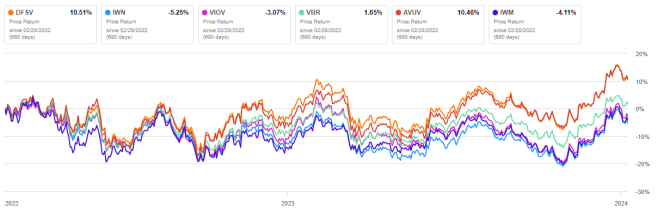
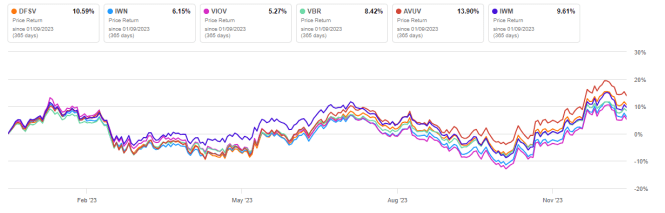
The next chart plots total returns since inception, including the small cap benchmark IWM. The two actively managed ETFs DFSV and AVUV are on par, ahead of competitors and the benchmark. AVUV was the best performer over the last 12 months.
DFSV vs benchmark and competitors, since DFSV inception (Seeking Alpha)
DFSV vs benchmark and competitors, trailing 12 months (Seeking Alpha)
Why actively managed value ETFs outperform value indexes
Most value indexes have two shortcomings. The first one is to classify all stocks using the same criteria. It means the valuation ratios are considered comparable across sectors. Obviously, they are not: my monthly dashboard here shows how valuation and quality metrics may vary across sectors.
The second weakness is relying too much on the price/book ratio (P/B), which adds some risk in the strategy. Historical data show that a large group of companies with low P/B has a higher volatility and deeper drawdowns than a same-size group with low price/earnings, price/sales or price/free cash flow. The next table shows the return and risk metrics of the cheapest quarter of the S&P 500 (i.e., 125 stocks) measured in price/book, price/earnings, price/sales and price/free cash flow. The sets are reconstituted annually between 1/1/2000 and 1/1/2024 with elements in equal weight. The P/B-based set shows the lowest excess return. It is behind the benchmark (equal-weight S&P 500) in risk-adjusted performance (Sharpe ratio).
| Annual Return |
| Drawdown |
| Sharpe ratio |
| Volatility |
| Cheapest quarter in P/B |
| 9.86% |
| -73.88% |
| 0.47 |
| 23.25% |
| Cheapest quarter in P/E |
| 10.63% |
| -63.06% |
| 0.55 |
| 19.88% |
| Cheapest quarter in P/S |
| 11.60% |
| -68.78% |
| 0.54 |
| 22.70% |
| Cheapest quarter in P/FCF |
| 12.65% |
| -64.24% |
| 0.62 |
| 20.63% |
| Equal Weight S&P 500 ( RSP ) |
| 9.16% |
| -59.92% |
| 0.5 |
| 17.55% |
Data calculated with Portfolio123.
DFSV strategy involves not only valuation, but also profitability, which helps filtering out some value traps. Moreover, the fund managers may also assess stocks relative to their peers at sector or industry level. The strategy is a black box, but these two points probably explain why DFSV and AVUV outperform other small cap value ETFs.
Takeaway
Dimensional US Small Cap Value ETF is an actively managed fund with over 1000 stocks in portfolio. It is well-diversified across holdings, but quite heavy in the financial sector. Valuation is attractive, and the fund has outperformed the Russell 2000 benchmark and passively managed small cap value ETFs since its inception in February 2022. Nonetheless, Avantis U.S. Small Cap Value ETF is a serious competitor. The two actively managed ETFs seem to be fixing the methodological shortcomings of index-based funds.
For further details see:
DFSV: Actively Managed ETFs Lead The Small Cap Value Style (Rating Downgrade)