DIA - DJIA: Likely To Continue Trading Higher (Technical Analysis)
2023-04-22 03:22:56 ET
Summary
- The historical occurrence of a symmetrical broadening wedge, along with the appearance of a wick on the DJI's yearly chart, signifies the buying interest in the market.
- The appearance of an inside bar on the quarterly chart, situated within an upward trend, suggests a potential buying opportunity in DIA.
- The presence of an inverted head and shoulders pattern on the DJIA chart signals a robust bullish perspective, paving the way for potential price increases.
This article delves into the long-term bullish outlook for the Global X Dow 30 Covered Call ETF (DJIA) by examining the historical performance and key technical patterns of SPDR® Dow Jones Industrial Average (DIA) ETF and Dow Jones Industrial Average Index (DJI). This article explores the previous discussion on DJIA ETF by analyzing the chart patterns of DJI and DIA ETF, probing their direct connection, and evaluating the likelihood of an upcoming market rally. Furthermore, the article addresses the advantages and risks linked to investing in the DJIA, along with the influence of the present market condition. By comprehending these diverse aspects, investors can make well-informed choices regarding their investments in the DJIA ETF and seize potential opportunities.
Impact of Higher Interest Rates on the Economy
Inflation became a prominent issue in 2022, breaking a 40-year record high and prompting the Federal Reserve to raise interest rates in an effort to combat inflation. The increased interest rates led to higher borrowing costs, resulting in reduced investments, lower earnings, and weaker stock performance, which in turn affected the valuation of the underlying stocks in the DJIA and subsequently impacted the ETF's performance. However, higher interest rates also contributed to increased options premiums, enhancing the income generated by the covered call strategy.
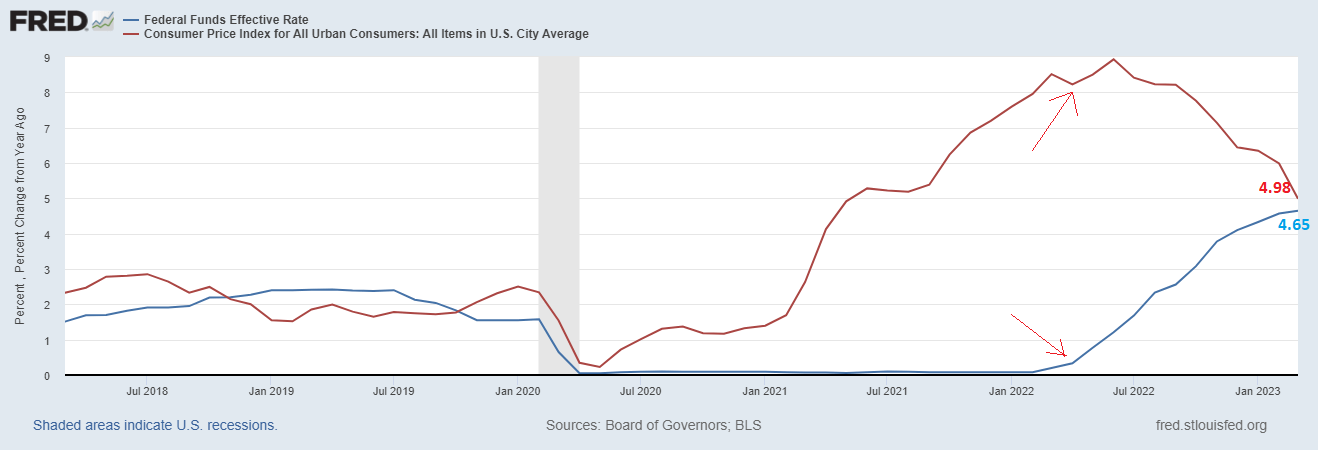
The recent collapse of Silicon Valley Bank exerted pressure on regional banks, leading to an emerging banking crisis. These crises led to a reduction in credit availability, which decreased consumer spending and business investment, leading to lower inflation as seen in the chart below. The decline in inflation could lead the Federal Reserve to make a favorable monetary decision, such as pausing interest rate hikes. The prospect of lower interest rates in the short term due to a reduction in inflation is having an impact on the stock market. The chart depicted below illustrates that as the Federal Reserve began to raise interest rates, inflation gradually decreased from its elevated level.
CPI and Federal Reserve Interest Rates (fred.stlouisfed.org)
The possibility of lower interest rates also affects dividend-paying stocks, such as those held by the DJIA ETF, as they become more attractive to income-seeking investors. Lower interest rates influence the yield on bonds and other fixed-income securities, which can lead to increased demand for dividend-paying stocks. This heightened demand has the potential to drive stock prices higher, ultimately boosting the ETF's performance.
DJIA Poised for a Bullish Surge
Historical Analysis
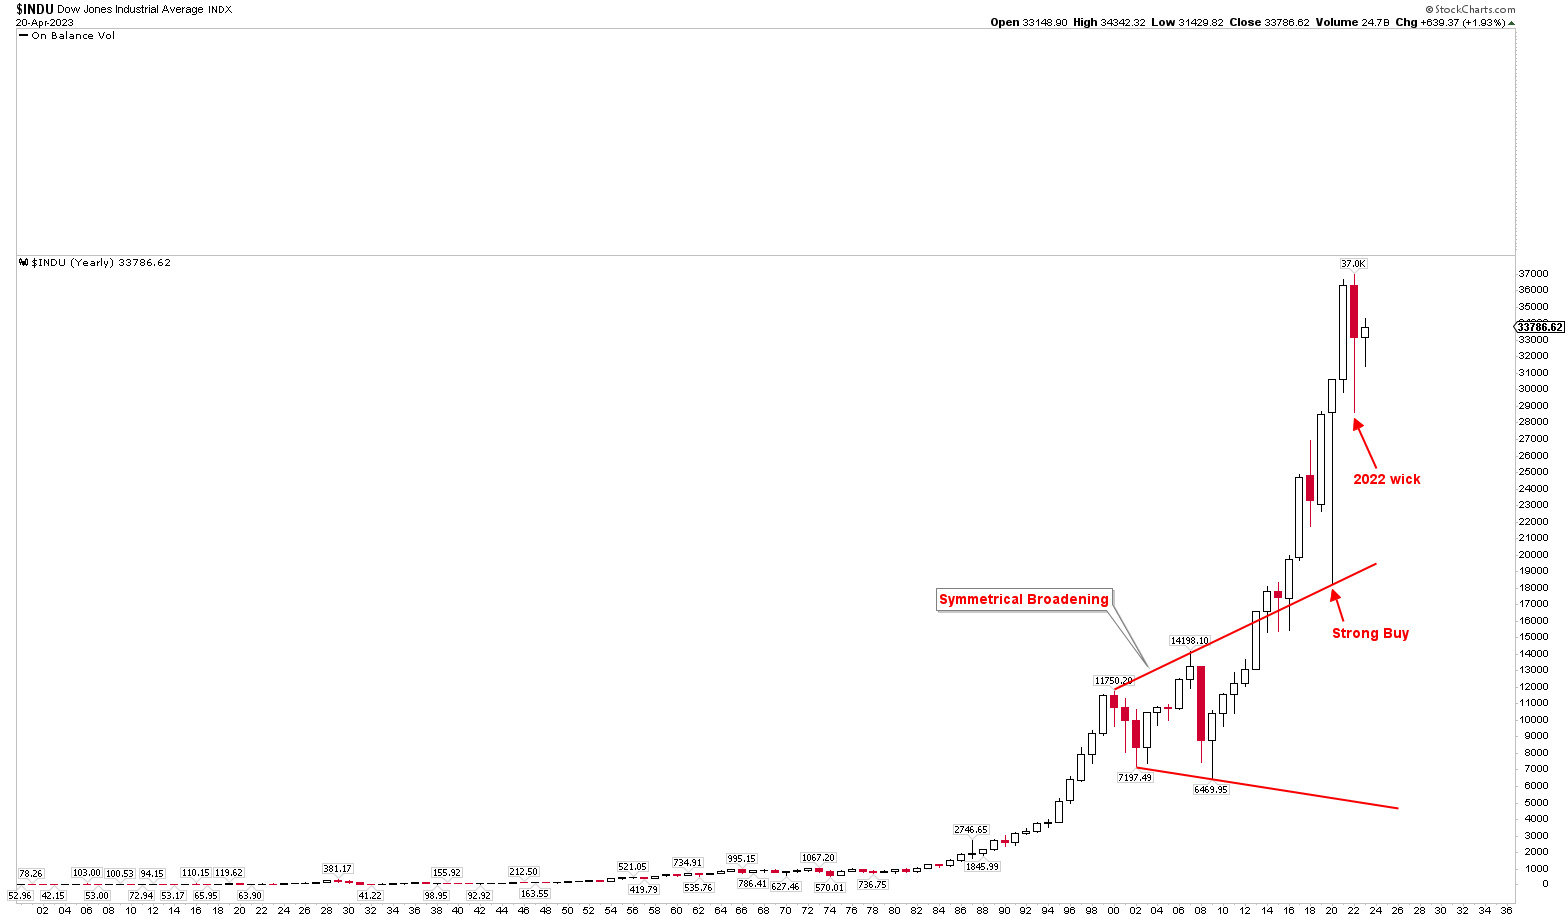
Based on the fundamental outlook, the DJIA is expected to perform well, and the technical analysis further supports a strongly bullish perspective. The long-term bullish outlook for the DJI is evident in the yearly chart displayed below, showcasing a robust bullish run. From 2000 to 2013, a symmetrical broadening wedge pattern emerged, indicative of high volatility. As the price traded within this pattern for 13 years, the increased price swings attracted more market participants, contributing to the DJI's continued rise. A strong yearly close at $16,576.66 in 2013 broke the broadening pattern, marking a powerful breakout and signaling a new uptrend that led to a market high of $37,000 in 2022. However, overbought conditions, coupled with a high inflation environment, prompted higher interest rates, pushing prices onto a lower trajectory. The 2022 decline found support at $28.7k, bouncing higher and forming a wick that signifies strong buying interest and a potentially bullish price in coming years.
DIA Yearly Chart (stockcharts.com)
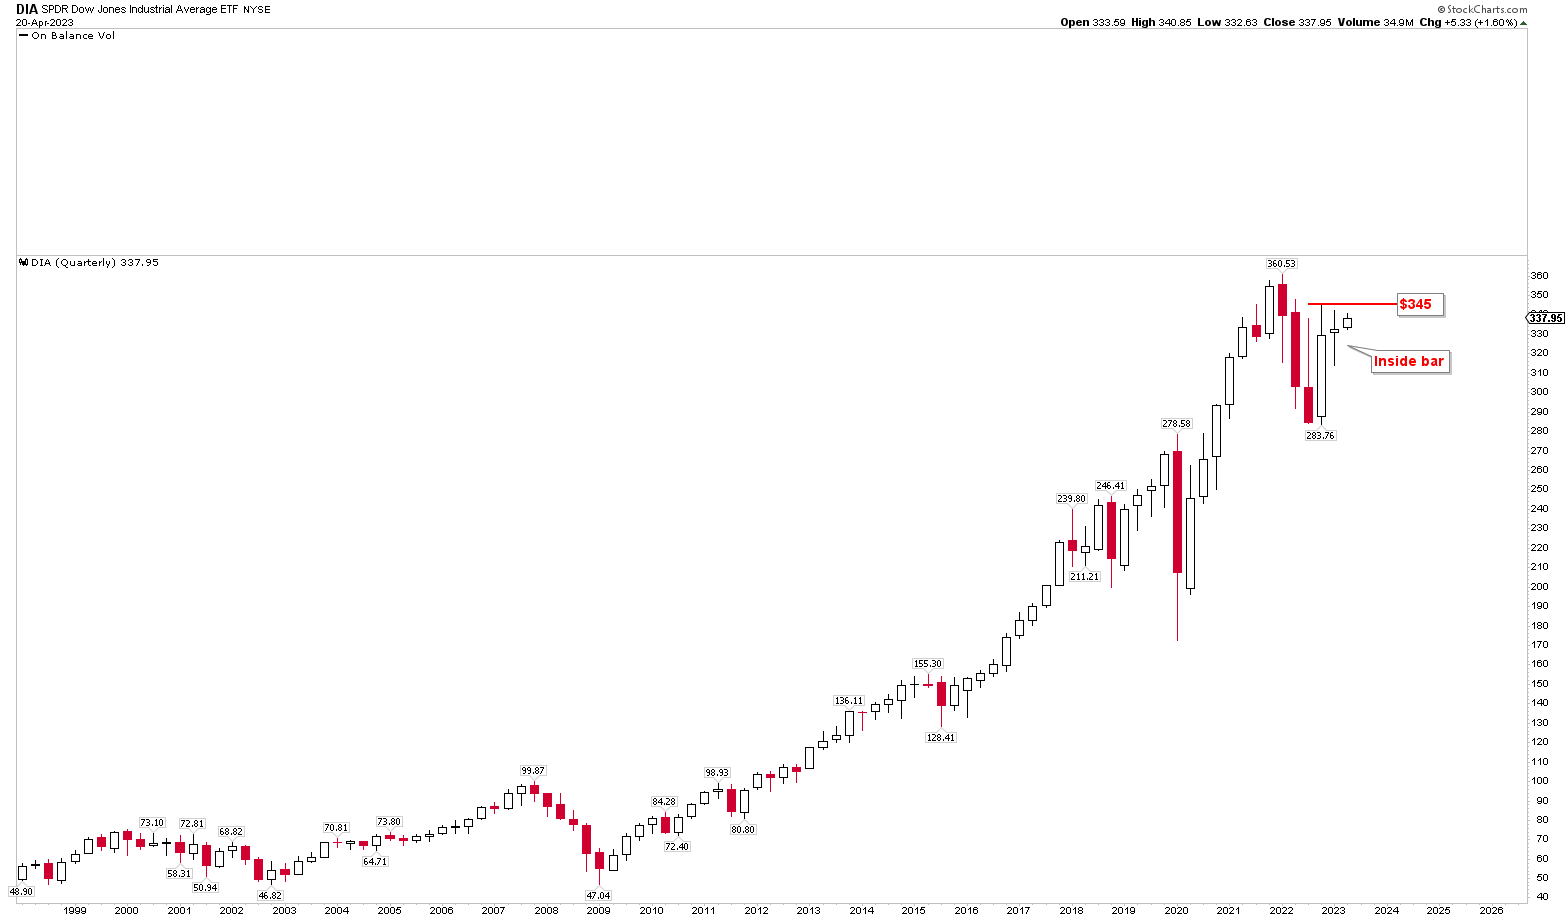
The DJI's robust prices follow a price surge in the DIA due to their direct relationship, as the DIA tracks the DJI's performance. The quarterly chart below demonstrates the emergence of a quarterly inside candle for the first quarter of 2023. This inside candle represents a consolidation period, with market participants uncertain about the next direction. A break above the inside candle's high suggests that buyers have gained the upper hand, pushing prices higher. This inside candle indicates a strongly bullish outlook, as it forms during a robust uptrend, with a break higher potentially initiating a new uptrend in the market. The chart below highlights a market level of $345, which could trigger the new uptrend.
DIA Quarterly Chart (stockcharts.com)
The importance of a strong bullish perspective for the DJI has been previously discussed , as the market exhibits solid price behavior within the ascending broadening pattern. A buy signal emerged at the baseline support, indicating the continuation of upward momentum in the DJIA ETF. Although the price is still consolidating within a wide range, it has not yet broken the key levels necessary to initiate the next market rally.
The analysis points to a bullish outlook for the DJIA, primarily driven by the historically positive price performance of both the DJI and the DIA. As these instruments experience a strong upward trajectory, they are expected to initiate a strong rally in the DJIA ETF.
Identifying Crucial Breakout Levels for Investors
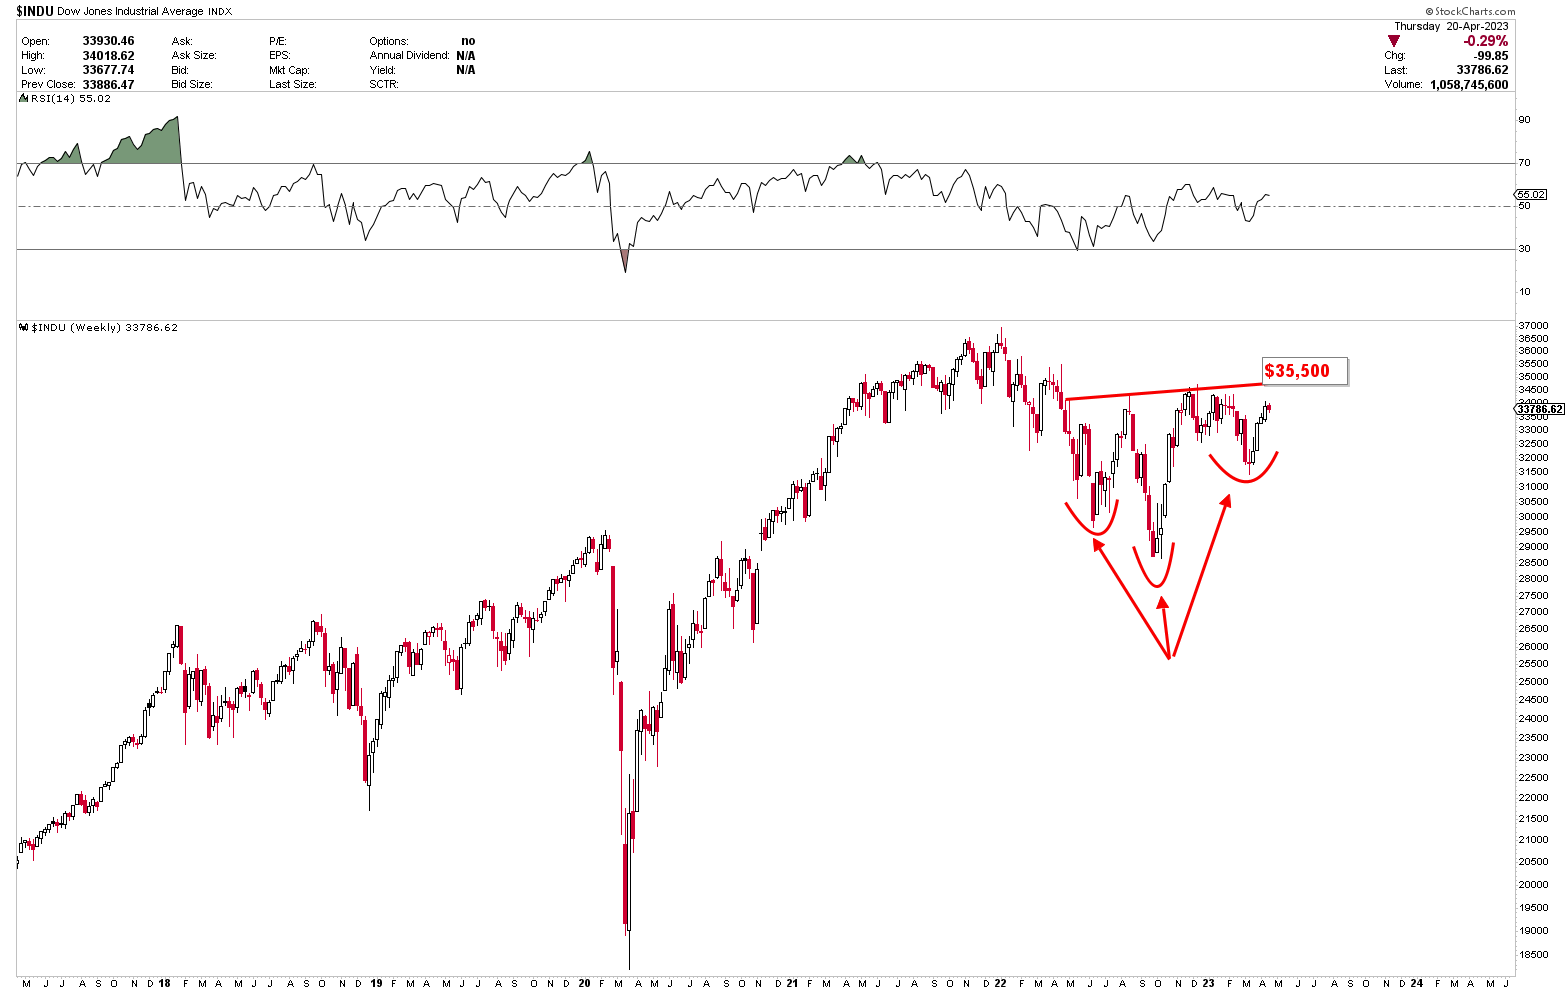
As previously discussed , the DJI continues to consolidate, forming the right shoulder of an inverted head and shoulder pattern. A break above $35,500 is necessary to initiate the next rally. Over the past few weeks, this consolidation has resulted in an inside bar in the quarterly chart, further reinforcing the bullish outlook for the DJIA.
DJI Weekly Chart (stockcharts.com)
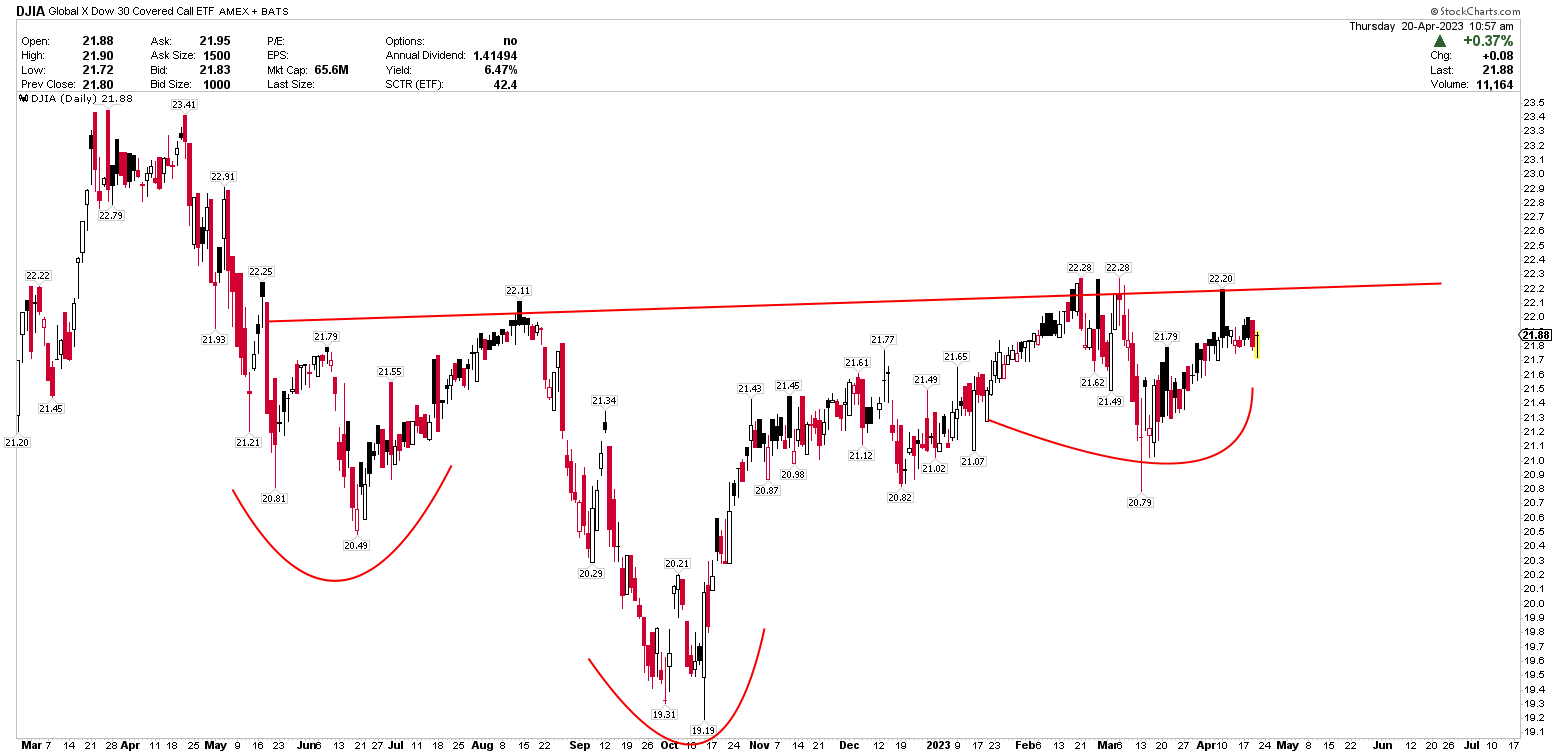
Investors should closely monitor the $35,500 level in the DJI and the $345 level in the DIA ETF to identify strong buying opportunities in the DJIA ETF. Notably, the DJIA ETF itself is also exhibiting a robust inverted head and shoulder pattern, as illustrated in the chart below.
DJIA Weekly Chart (stockcharts.com)
Examining the DIA and DJI through technical charts is beneficial when considering investments in the DJIA ETF due to their strong correlation. Since the DJIA ETF holds the same underlying stocks as the DIA and DJI, their performances are closely linked. Furthermore, technical analysis of the DIA and DJI can help investors pinpoint potential entry and exit points for the DJIA ETF, as changes in these indices' movements may signal shifts in market conditions that could affect the ETF's performance.
Investing in the DJIA ETF offers certain advantages over investing directly in the DJI and DIA, primarily due to its enhanced income generation capabilities. The main benefit of the DJIA ETF lies in its covered call strategy, which involves writing call options on the underlying stocks. This approach generates additional income through option premiums, which are distributed as dividends, potentially making the ETF more appealing to income-seeking investors than traditional equity investments in the DJI or DIA. Additionally, the income generated from the covered call strategy can help cushion potential declines in the underlying stock prices, possibly resulting in lower downside risk during periods of market volatility compared to investing in the DJI or DIA. The DJIA ETF may also reduce the overall volatility of its investment portfolio compared to a pure equity investment in the DJIA or DIA by writing call options, making the ETF more attractive for risk-averse investors.
Market Risk
Investors should carefully weigh the following risks before committing to the DJIA ETF. The covered call strategy can restrict the ETF's upside potential during periods of robust market growth. If the underlying stocks experience significant appreciation, the call options may be exercised, causing the ETF to miss out on some capital gains. The DJIA ETF's higher expense ratio of 0.60% compared to the DIA's 0.16% is attributed to the costs associated with managing the covered call strategy, potentially diminishing the strategy's effectiveness over time. The covered call strategy employed by the DJIA ETF is more complex than the simple buy-and-hold strategy utilized by the DIA.
While the market appears poised to climb higher, a break below $283.76 for the DIA or $28.7k for the DJI would negate the inside bar in the DIA and the inverted head and shoulders in the DJI. This development could exert pressure on the DJIA and lead to lower prices.
Bottom Line
In conclusion, the above analysis indicates a robustly bullish long-term outlook for the DJI. Following a breakout from the symmetrical broadening wedge pattern, the index is poised to endure heightened volatility. The recent dip in the DJI is attributed to an overbought scenario, yet the 2022 candle's wick suggests the market correction has run its course, and an upward trend is likely. Moreover, DIA is anticipated to break free from the inside bar within a potent bullish trajectory. A surge above the $345 mark in the DIA would set off a fresh rally to new heights. Concurrently, a DIA breakout would confirm the inverted head and shoulder formations in the DJIA ETF, revealing lucrative investment opportunities for investors. Investors can buy DJIA ETF at the current level in anticipation of the next rally.
For further details see:
DJIA: Likely To Continue Trading Higher (Technical Analysis)