PMT - Dropping A 12.6% Dividend Yielder
2023-12-04 17:47:23 ET
Summary
- One of our investments finally rallied into our neutral range. Shares were a strong buy frequently in the last several months.
- One position resulted in a 26.7% return. We’re highlighting an alternative share with a better risk/reward profile.
- I also closed out one of my preferred share positions, resulting in a 21% return for about six months.
We sold one of our mortgage REITs. We’ve been able to find so many great deals lately that we wanted to free up the capital.
Shares aren’t overpriced, but they entered our “fair value” range. We're now neutral on MFA common shares.
The position we closed was in MFA Financial ( MFA ). Both Scott and CWMF decided to close out positions.
Scott provided the following note:
Today, I sold my entire position in MFA at a weighted average sales price of $11.01 per share. MFA crossed into our appropriately valued recommendation range. As such, MFA is no longer considered undervalued. Along with understanding MFA continues to have a risk rating of 4.5, this stock should be considered a shorter-term "valuation" play. This was stated to subscribers when I originally purchased MFA a little over a month ago (cost basis of $8.687 per share). I believe it was a good time for me, personally, to close out my position. As such, I'm merely disclosing my personal trade here today (will not fit each and every investor's strategy). In the end, a very productive short-term trade. My weighted average total return on my MFA position was 26.7% . I have no definitive plans yet to redeploy this capital but will be on the lookout. I hope this helps with subscribers' assessments/strategies.
I think it’s fair to say Scott Kennedy nailed it out of the park. I caught this picture, which I consider a pretty accurate depiction.
The REIT Forum
Did I do as well? Not on that trade. I entered MFA a bit early and didn’t double down when the opportunity was present. To be fair, there were quite a few opportunities. So I’m not kicking myself for missing out on that great trade, though it would’ve been nice to catch.
An Alternative
Looking at common shares, Ready Capital ( RC ) comes to mind.
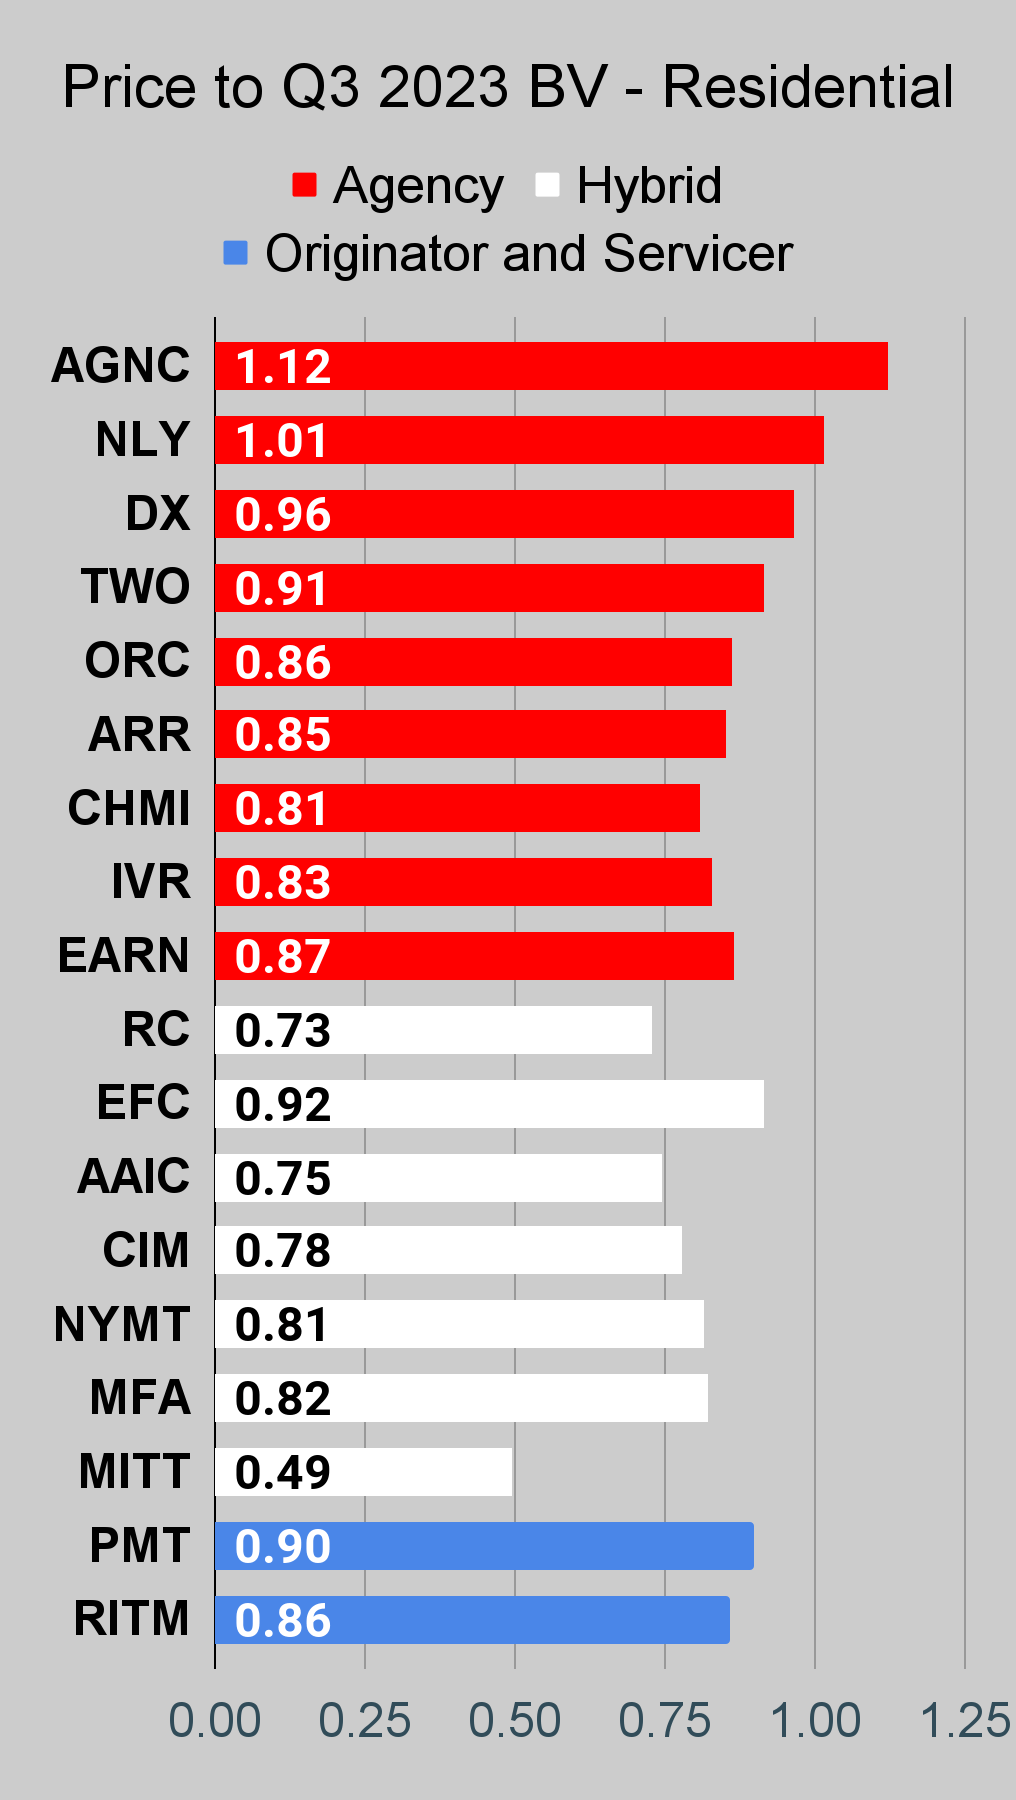
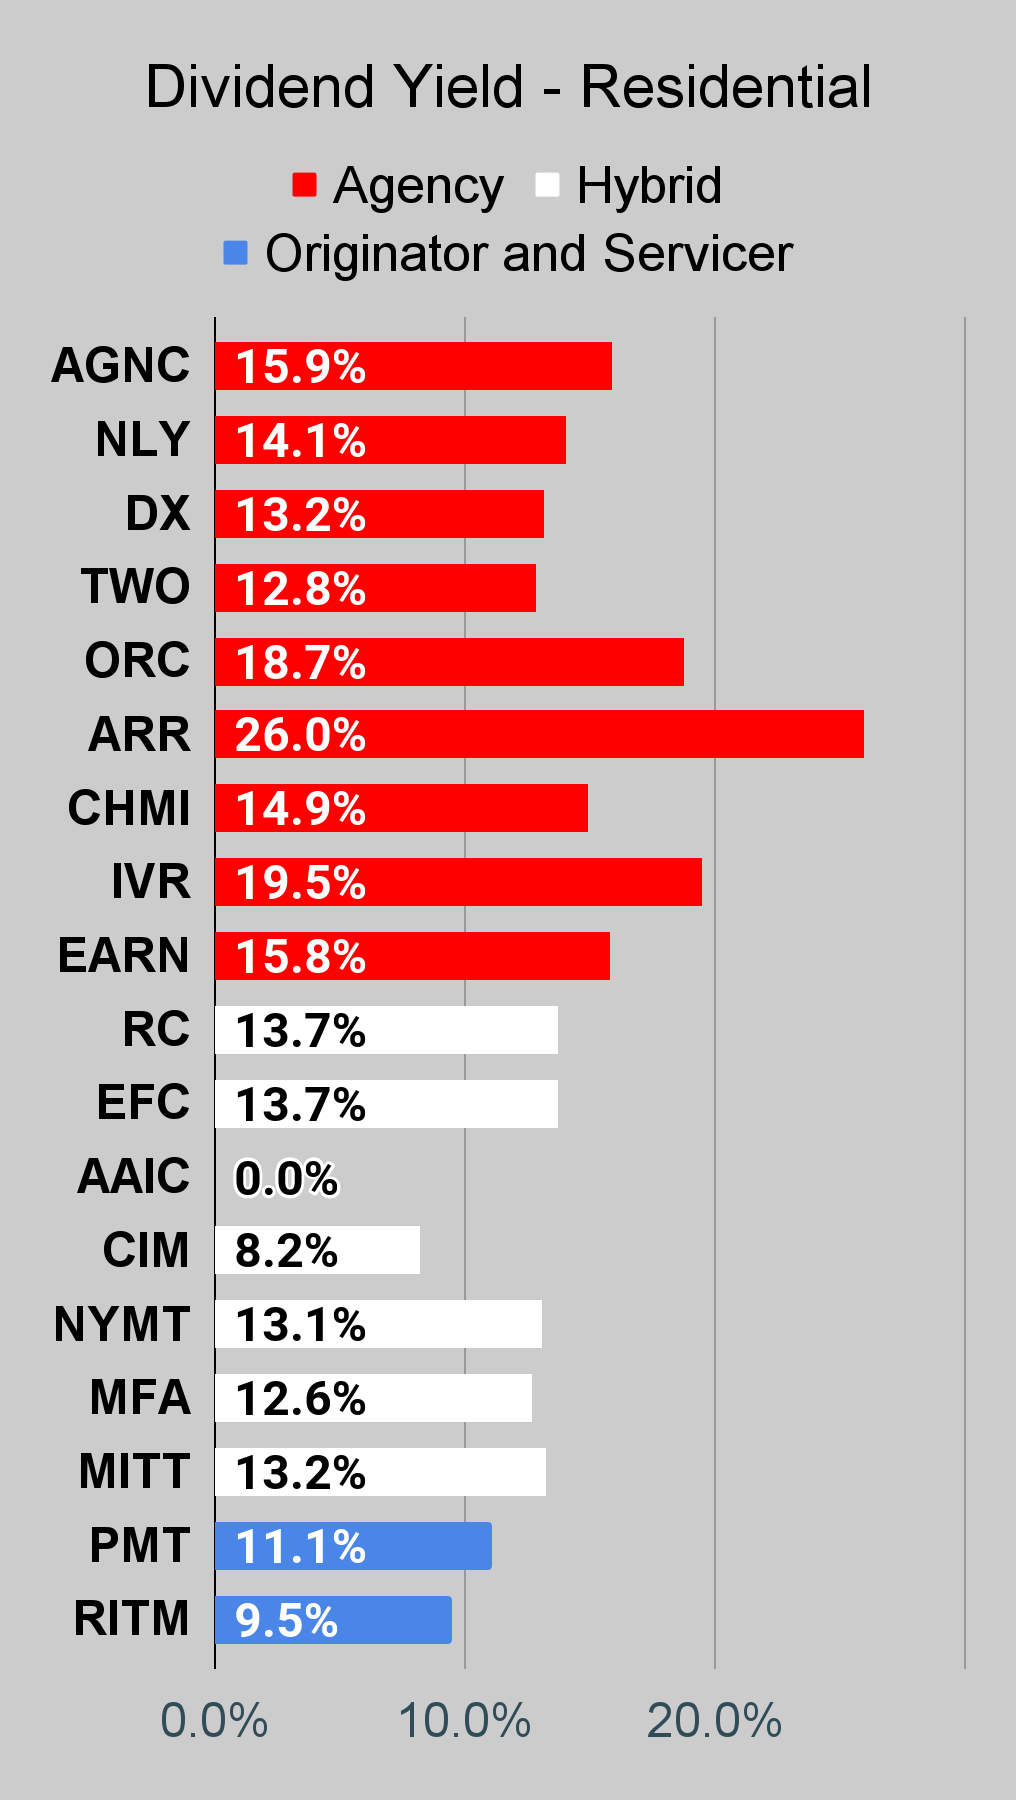
RC benefits from a lower price-to-book ratio. Using recent estimates (Friday’s prices, estimates from 11/24/2023), RC had a price-to-estimated-book of .73. For MFA, the ratio was .81. However, MFA has a higher risk rating (4.5 vs. 3.5 for RC). Looking at dividends, RC also wins.
- $10,000 in MFA: 903.34 shares at $1.40 per share = $1,264.68
- $10,000 in RC: 956.02 shares at $1.44 per share = $1376.67
However, I would encourage investors not to focus on the dividend as the sole factor in picking investments. Our emphasis on total returns is a major reason we've been able to deliver such strong returns in a sector where overall returns for the last eight years have been disappointing. There were some good stretches in there for the index, but overall it was a rough period for the ETF holders.
If you look at my returns over the years, a huge portion of our return comes from capital gains. While we're investing in shares with high dividend yields, the objective is to predict which shares will outperform. No one can predict where that dividend will be in 2026. Focusing only on the current income would ignore a huge part of the equation for the risk/reward profile.
While MFA trades very close to the price-to-buy target, RC trades at only 77% of the target and has a lower risk rating (3.5 for RC vs 4.5 for MFA).
Another Trade
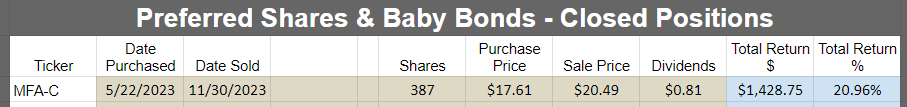
I also decided to close out my position in MFA-C (MFA.PC) ( MFA.PR.C ).
We did very well on this trade:
The REIT Forum
Total return was nearly 21% for about half of a year. That’s a great return, especially for investing in preferred shares. Of course, we can’t just use a “buy and hold” strategy and continue to earn that rate of return. The higher rate when shares float (assuming the Federal Reserve doesn’t cut rates dramatically) is favorable for the yield, but income alone can’t produce 21% in about six months.
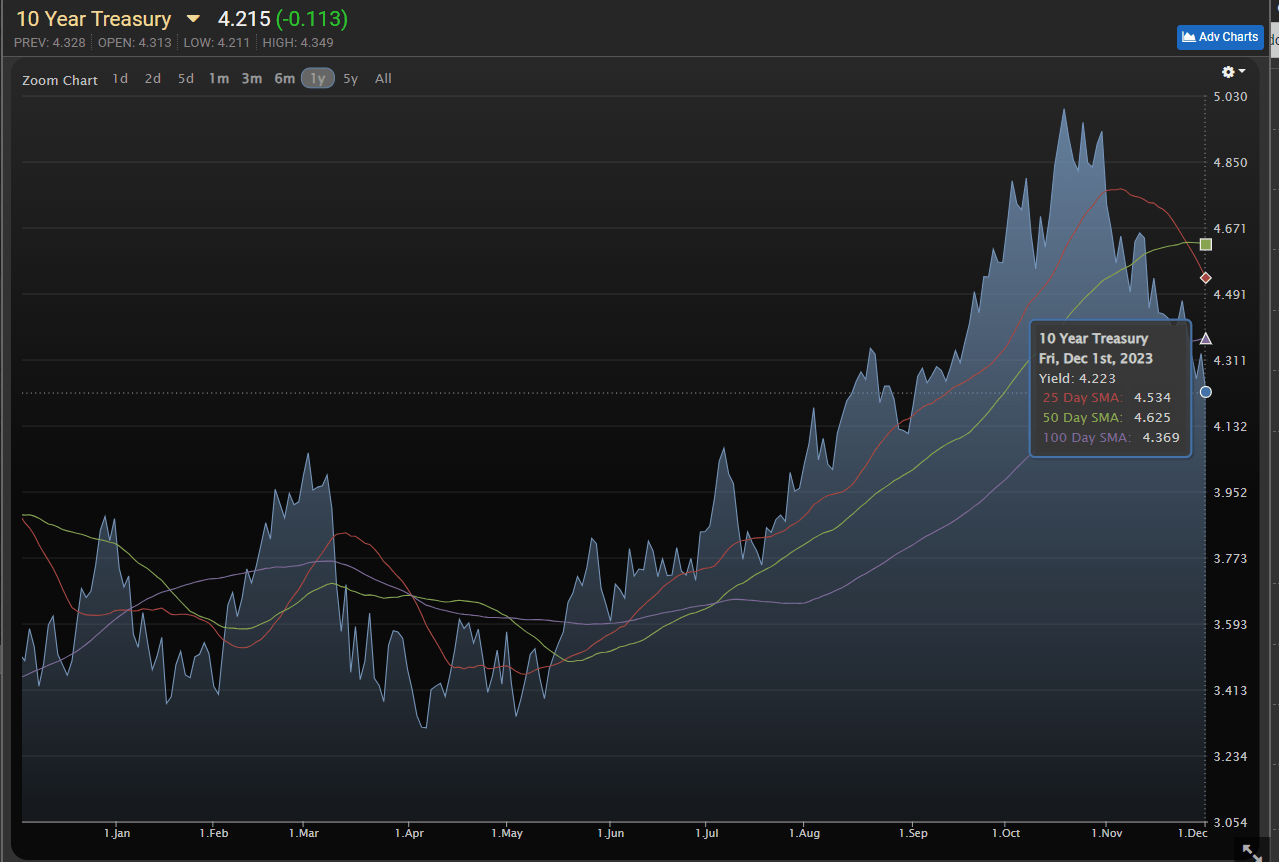
Rates Plunge
REITs have been ripping higher. Mortgage REITs, equity REITs, pretty much any kind of REIT.
What happened? Treasury yields fell hard.
MBSLive
The 10-year Treasury maxed out at about 5% on Oct. 19, 2023. Since then, we’ve seen it fall nearly 80 basis points. For the first time since May 2023, the 10-year Treasury is below the 25-day, 50-day, and 100-day moving averages.
Suddenly the market is starting to question the narrative of lasting inflation and higher rates.
Lower rates are good for REITs (fundamentals and share prices), good for the economy, and good for the American citizens who don’t want to see annual interest expense on the national deficit break over $1 trillion per year. We’re still pretty far from that level, but rapidly pushing toward it.
Lower Treasury yields reduce the opportunity cost for holding REITs and imply cheaper financing. This could be a bigger deal for equity REITs than mortgage REITs. However, the impact on mortgage REITs really depends on the assets and the hedging strategy. Lower rates do not have precisely the same impact on every mortgage REIT.
Stock Table
We will close out the rest of the article with the tables and charts we provide for readers to help them track the sector for both common shares and preferred shares.
We’re including a quick table for the common shares that will be shown in our tables:
| Type of REIT or BDC |
| Residential Agency |
| Residential Hybrid |
| Residential Originator and Servicer |
| Commercial |
| BDC |
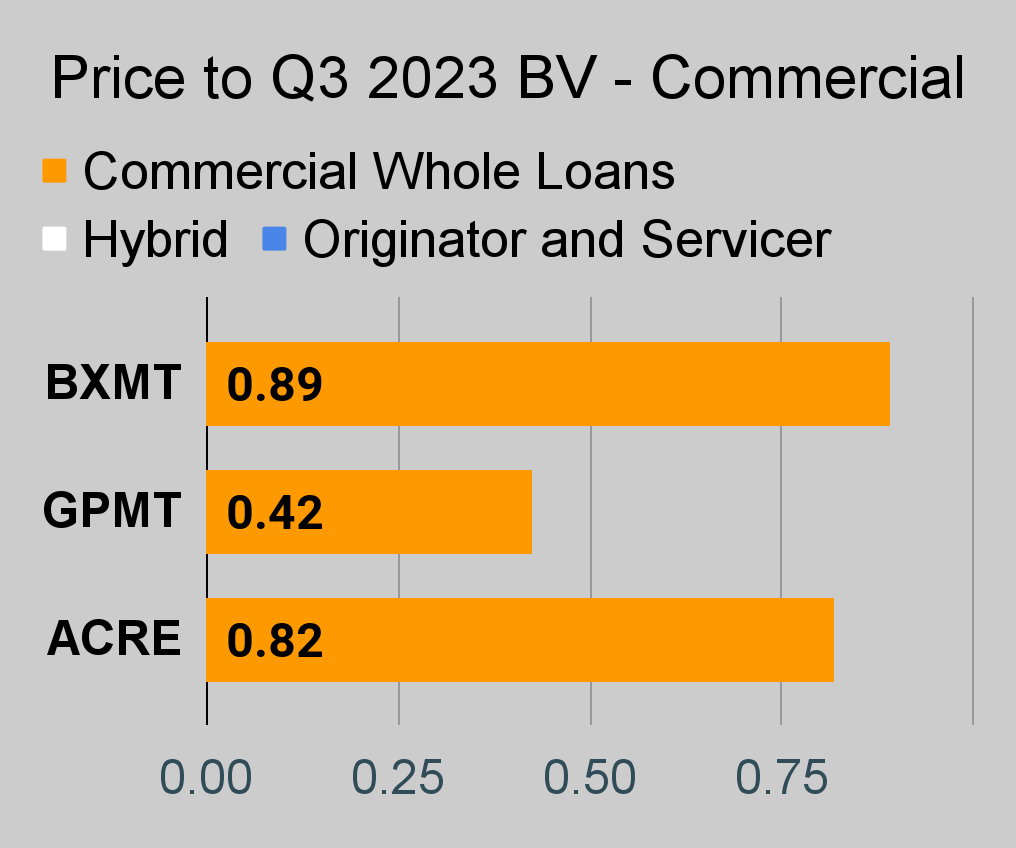
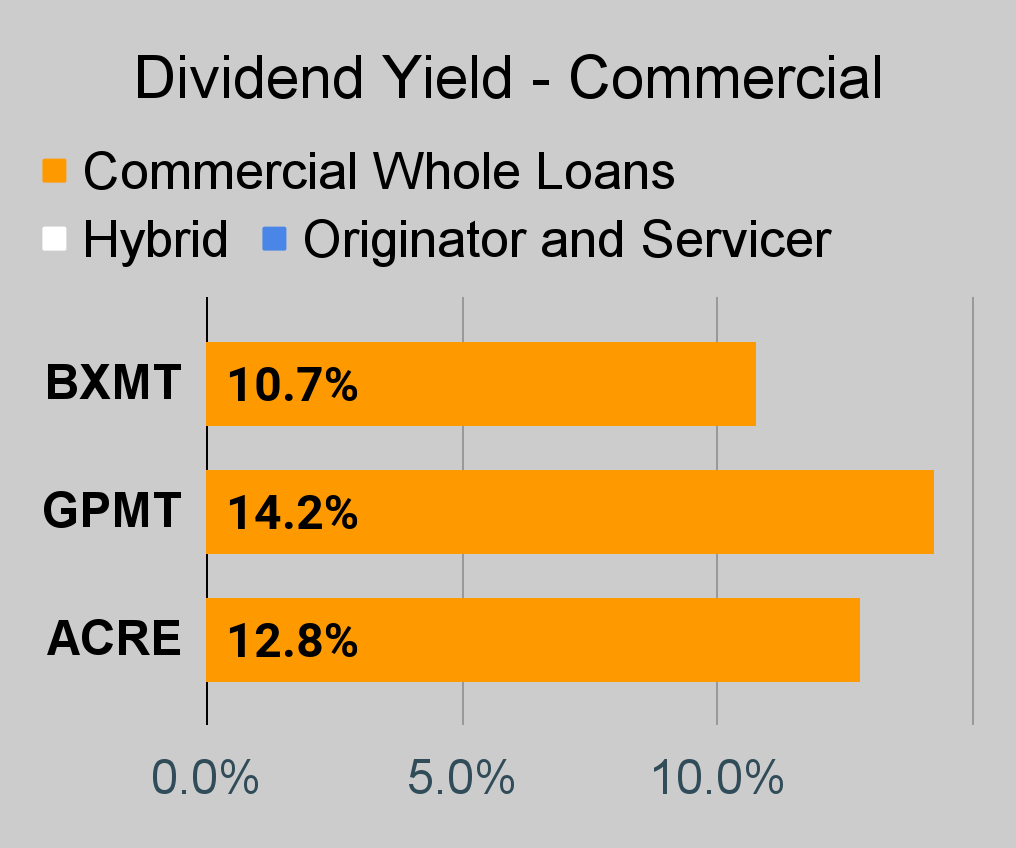
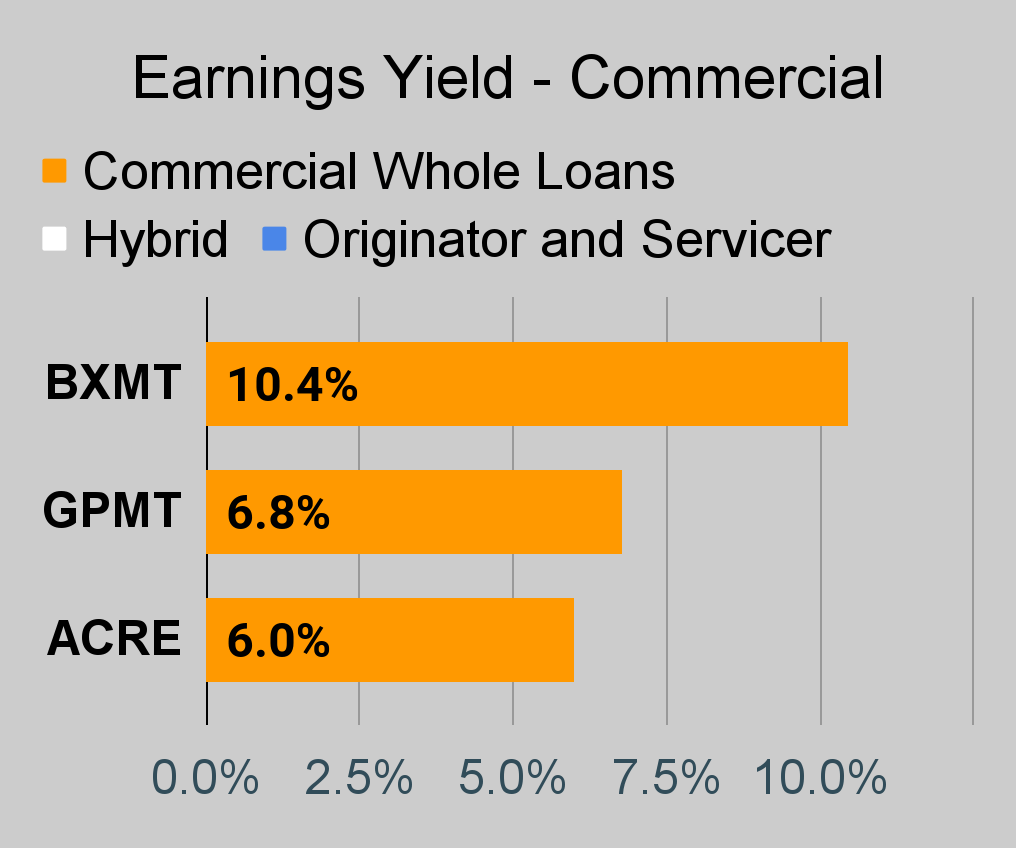
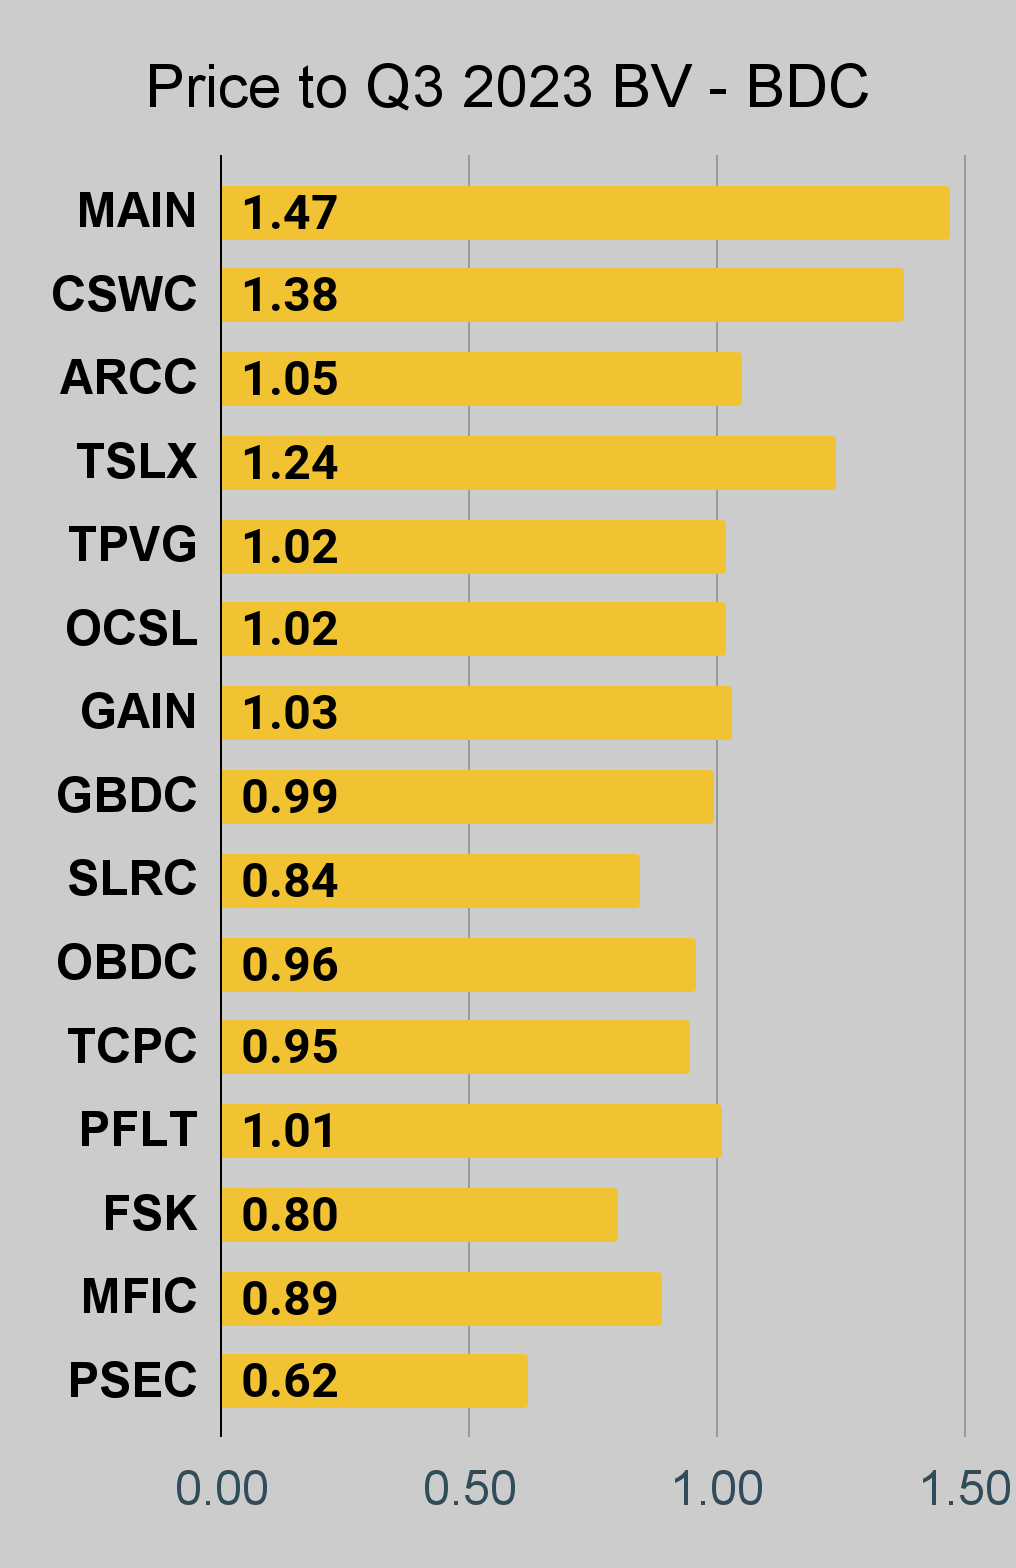
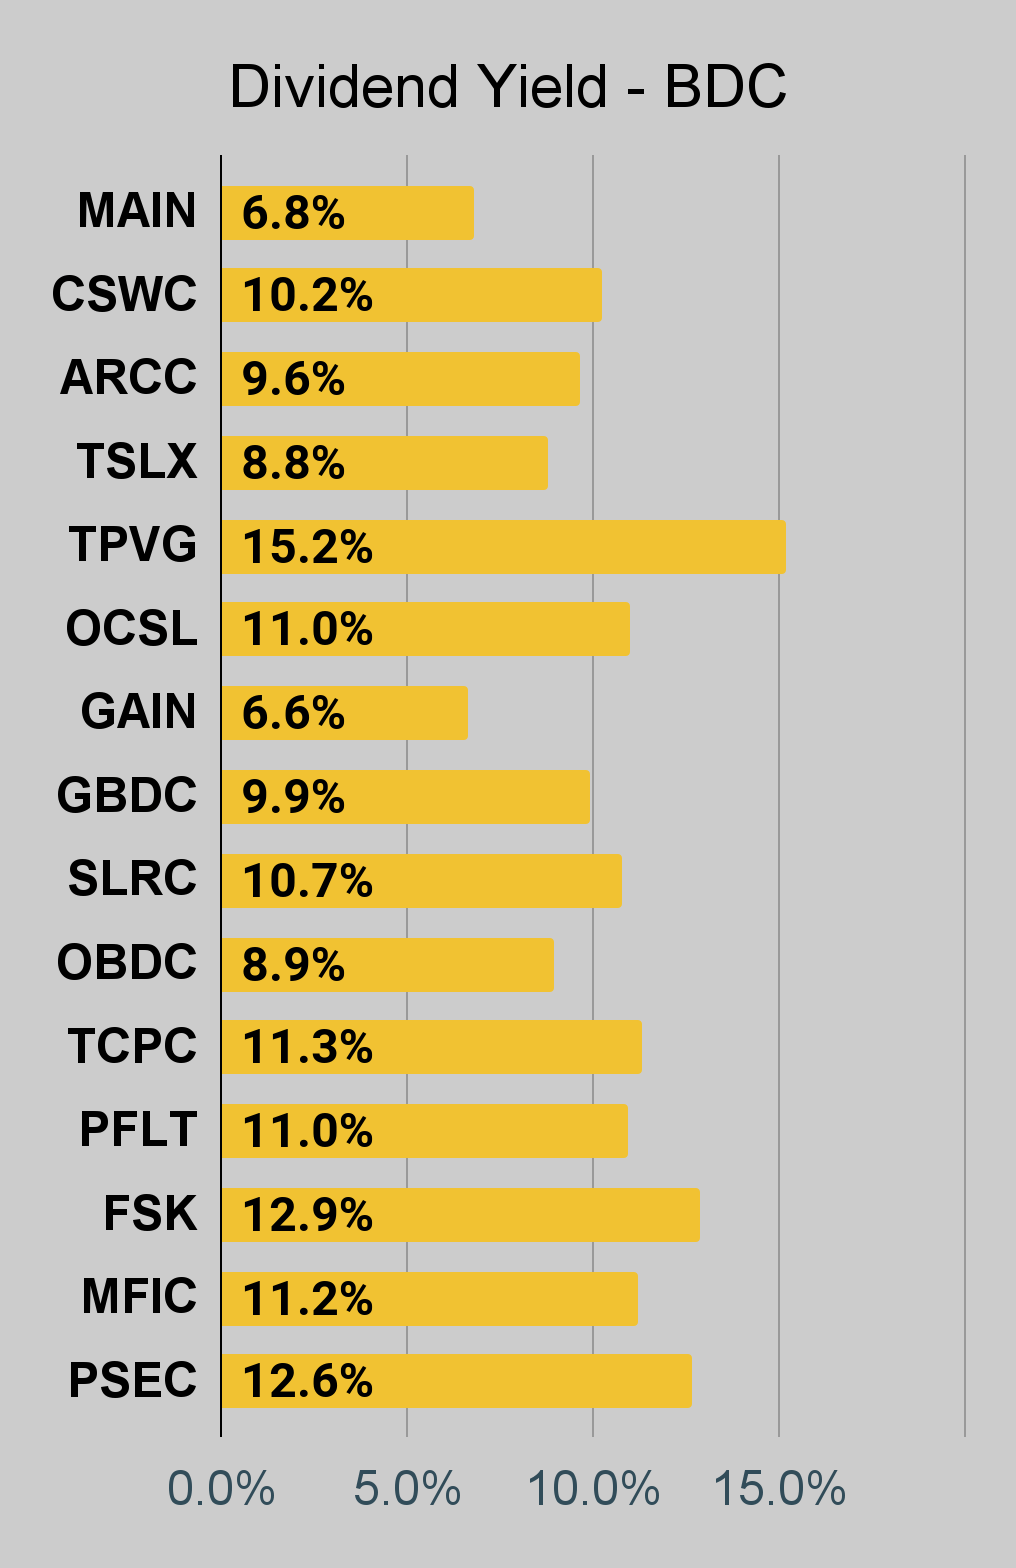
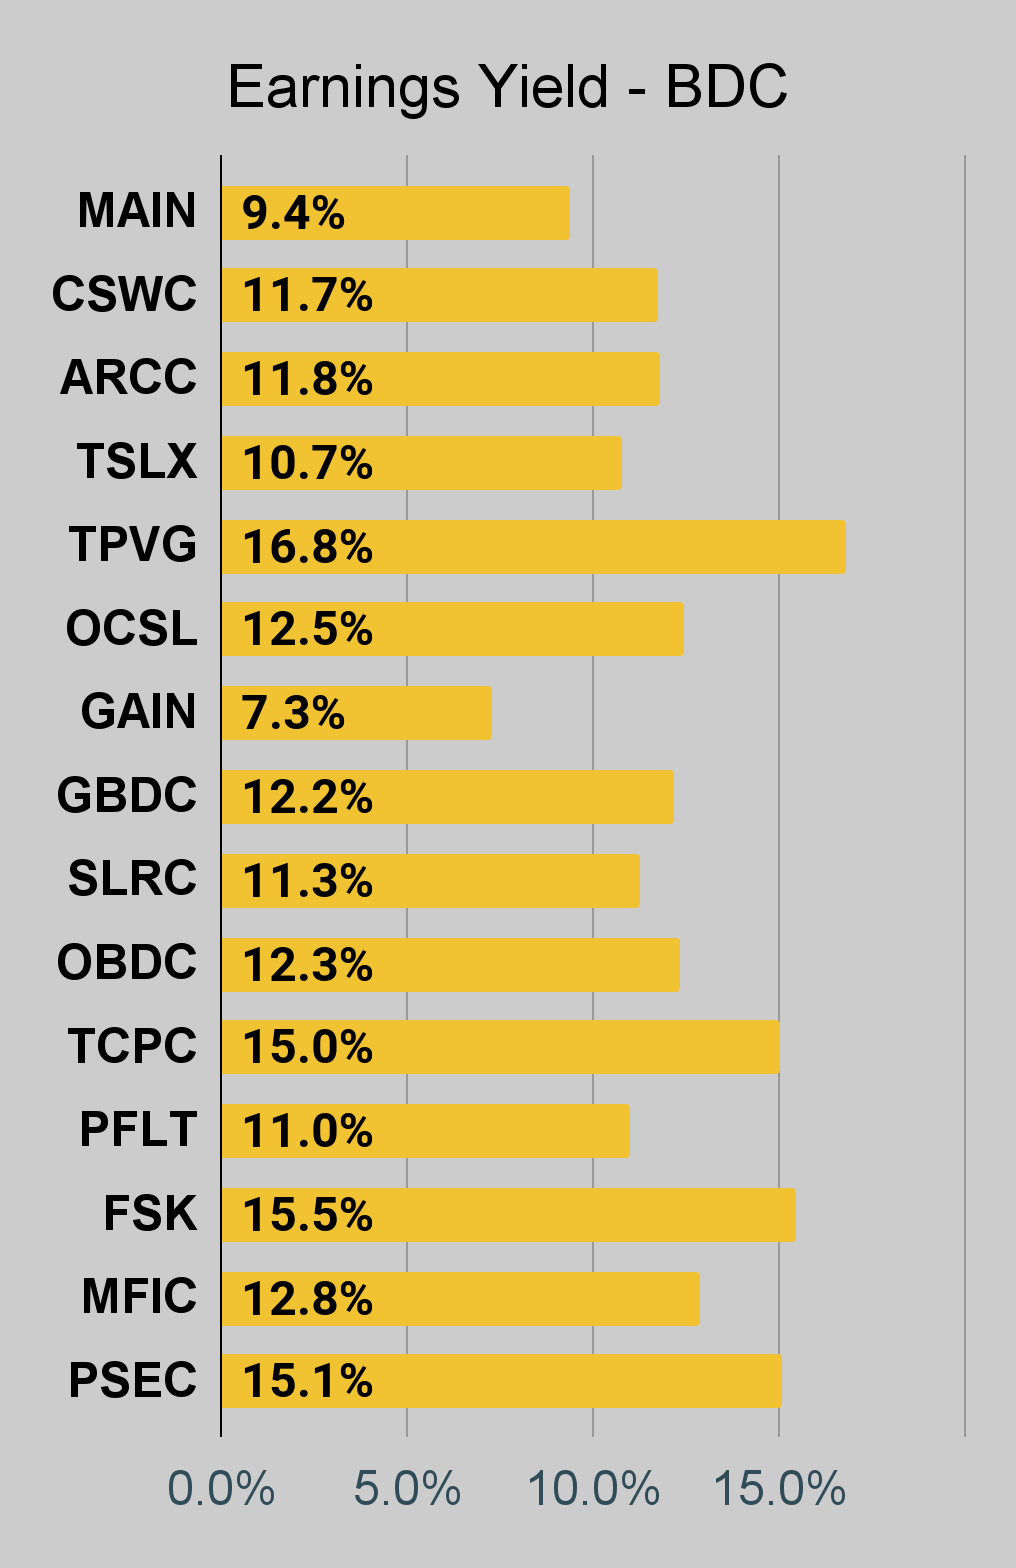
If you’re looking for a stock that I haven’t mentioned yet, you’ll still find it in the charts below. The charts contain comparisons based on price-to-book value, dividend yields, and earnings yield. You won’t find these tables anywhere else.
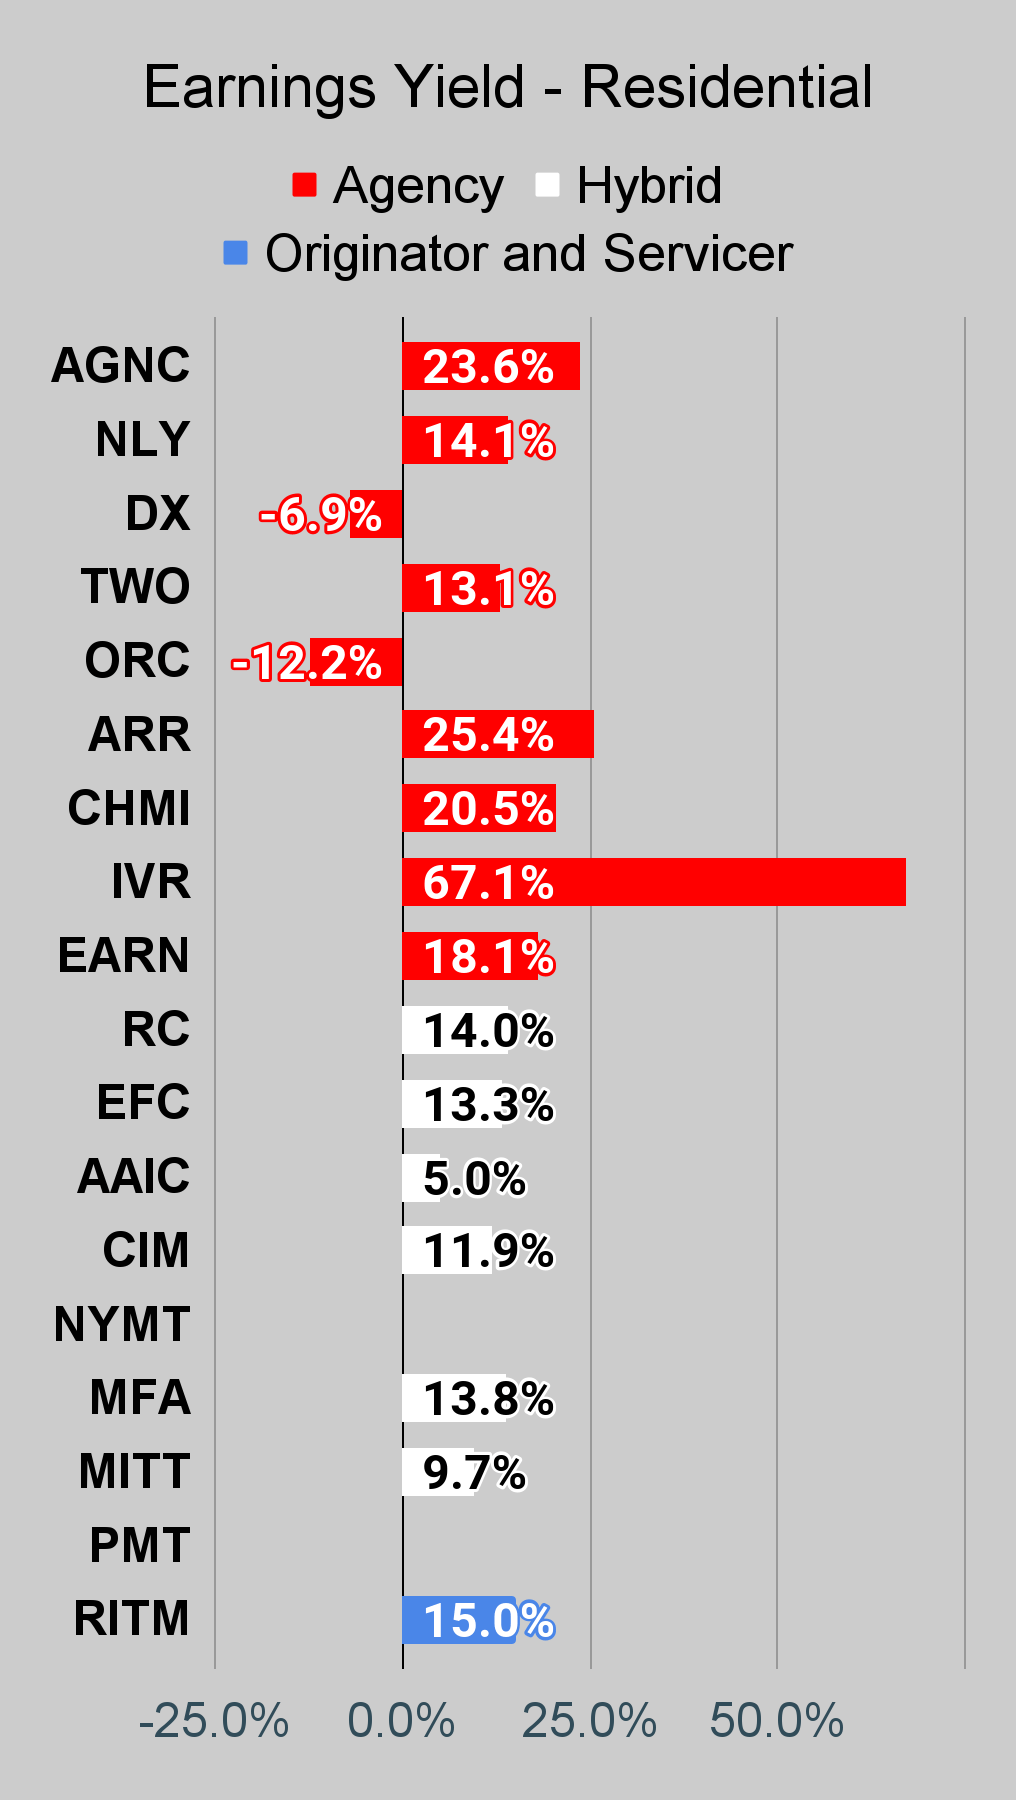
For mortgage REITs, please look at the charts for AGNC, NLY, DX, ORC, ARR, CHMI, TWO, IVR, EARN, CIM, EFC, NYMT, MFA, MITT, AAIC, PMT, RITM, BXMT, GPMT, WMC, and RC.
For BDCs, please look at the charts for MAIN, CSWC, ARCC, TSLX, TPVG, OCSL, GAIN, GBDC, SLRC, OBDC, PFLT, TCPC, FSK, PSEC, and MFIC.
This series is the easiest place to find charts providing up-to-date comparisons across the sector.
Note on Book Values
I’ve updated the charts to use Q3 2023 book values. These are much closer to current book values. Companies that have not reported values for Q3 2023 will be blank. We don’t want to put Q2 2023 and Q3 2023 BVs in the same charts due to the significant changes.
Residential Mortgage REIT Charts
Note: The chart for our public articles uses the book value per share from the quarter indicated in the chart. We use the current estimated (proprietary estimates) book value per share to determine our targets and trading decisions. It's available in our service, but those estimates are not included in the charts below. PMT and NYMT are not showing an earnings yield metric as neither REIT provides a quarterly “Core EPS” metric. Presently, a few other REITs also have no consensus estimate.
Second Note: Due to the way historical amortized cost and hedging is factored into the earnings metrics, it's possible for two mortgage REITs with similar portfolios to post materially different metrics for earnings. I would be very cautious about putting much emphasis on the consensus analyst estimate (which is used to determine the earnings yield). In particular, throughout late 2022 the earnings metric became less comparable for many REITs.
Third Note: The "earnings yield" on IVR is not even remotely representative of what the REIT should be able to effectively "earn." I'm considering making the line blank like the earnings yield for PMT and NYMT to avoid distorting the chart with bad data. Feedback requested on removing IVR's figure from the earnings yield table to normalize the data. Let me know what you think in the comments.
Commercial Mortgage REIT Charts
BDC Charts
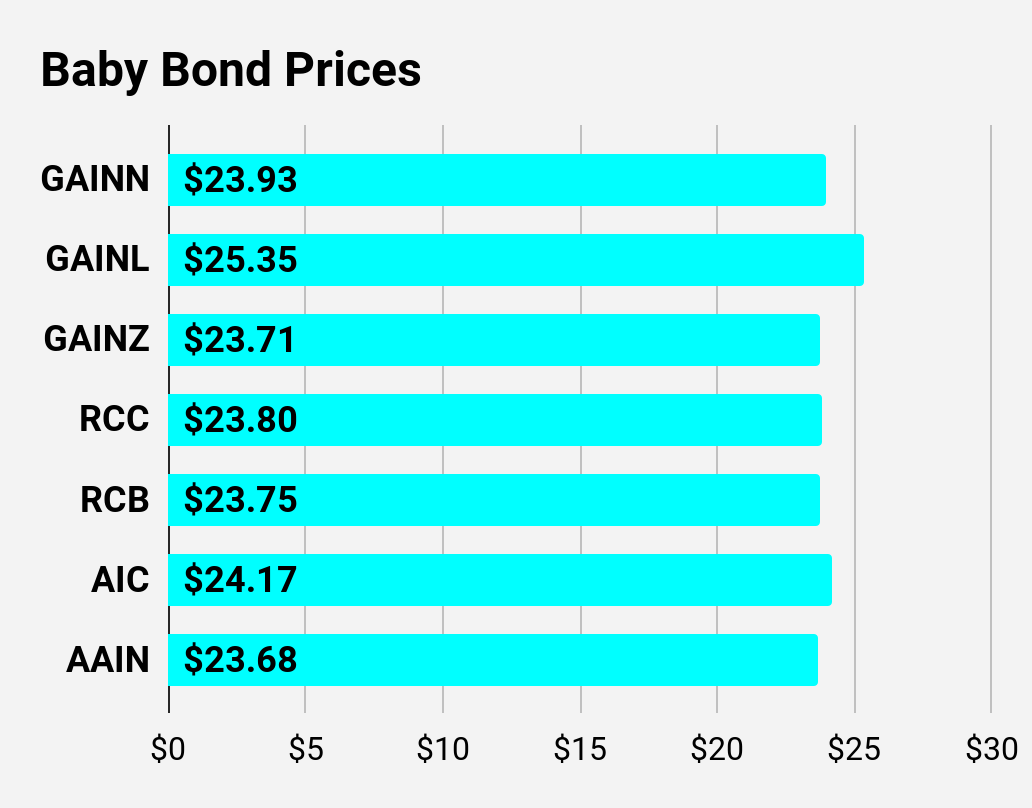
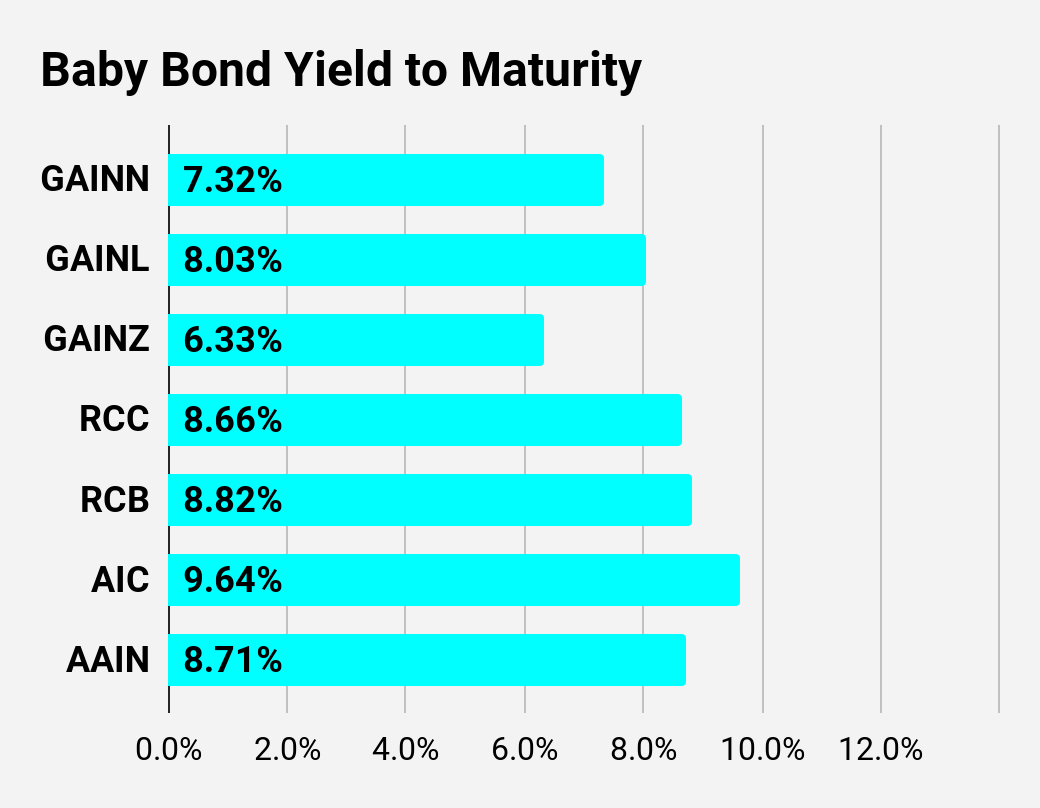
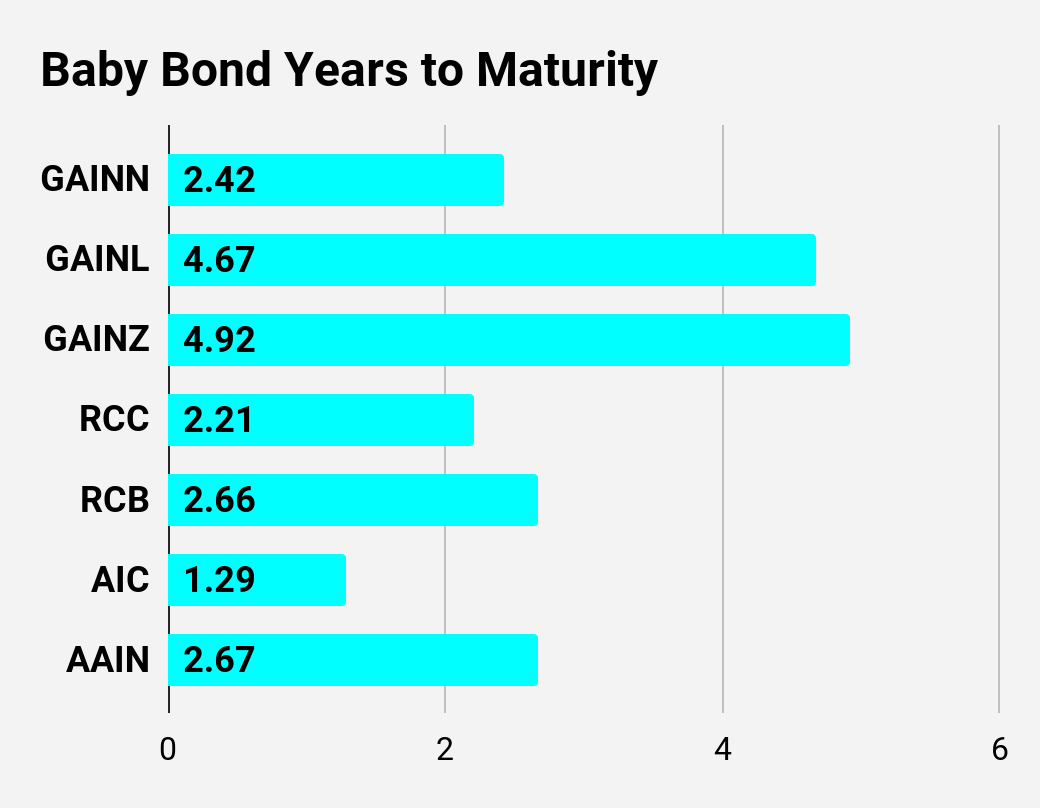
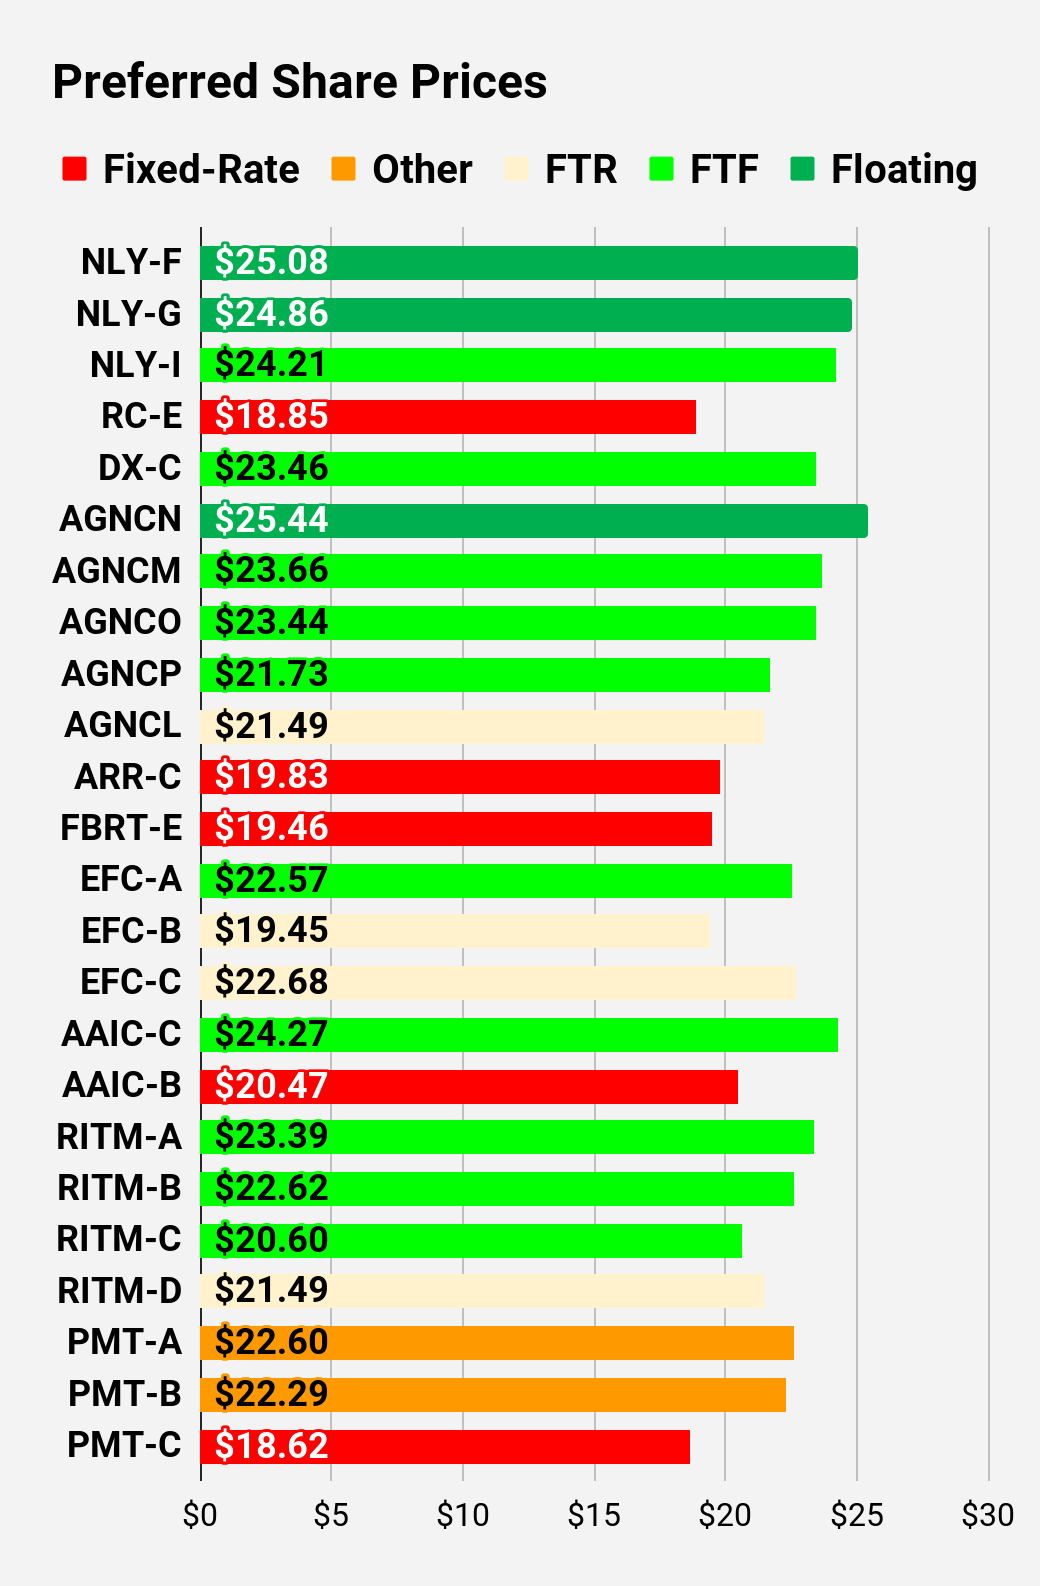
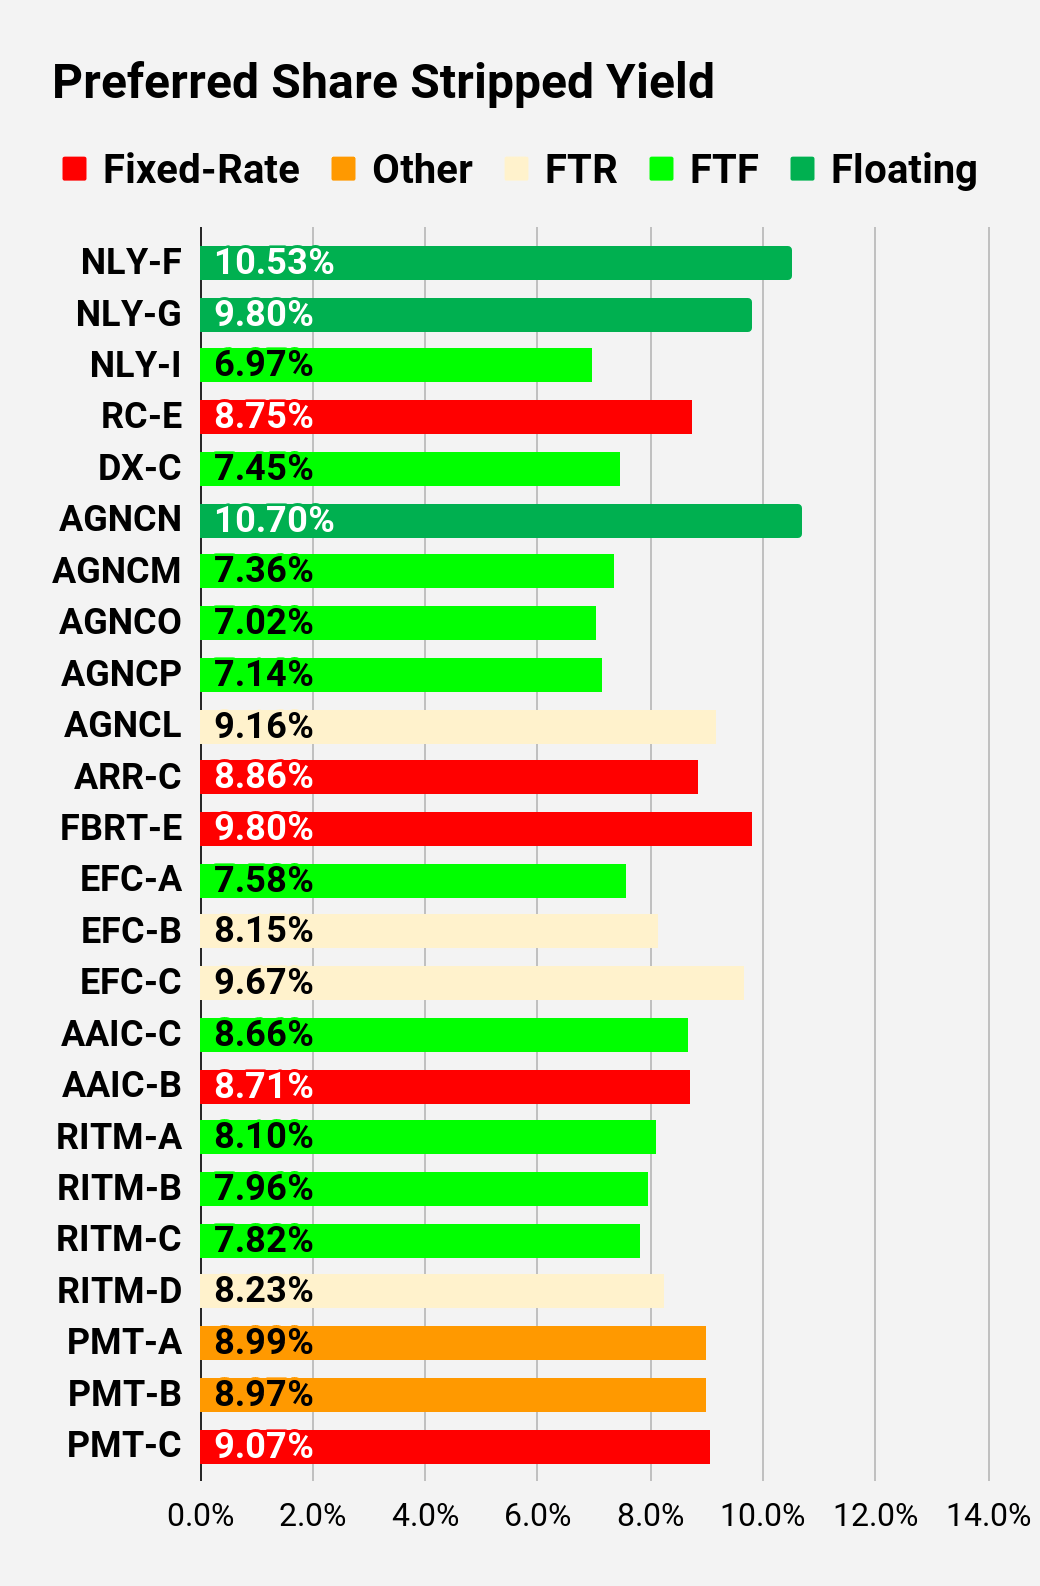
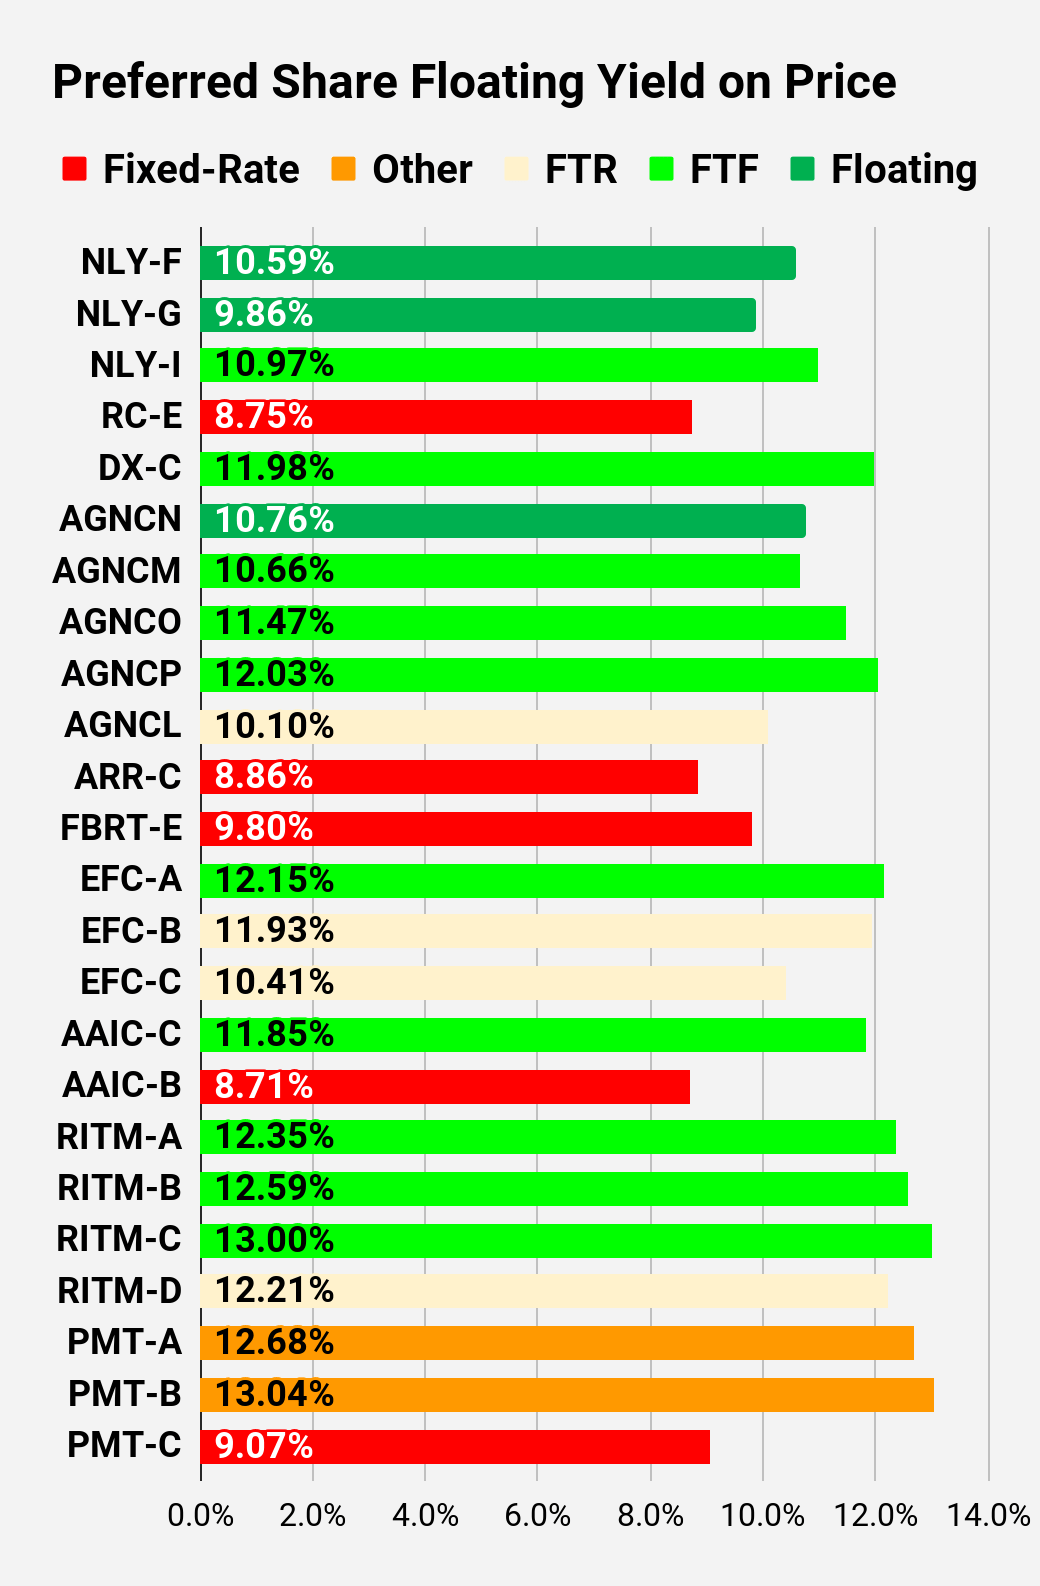
Preferred Share and Baby Bond Charts
I changed the coloring a bit. We needed to adjust to include that the first fixed-to-floating shares have transitioned over to floating rates. When a share is already floating, the stripped yield may be different from the “Floating Yield on Price” due to changes in interest rates. For instance, NLY-F already has a floating rate. However, the rate is only reset once per three months. The stripped yield is calculated using the upcoming projected dividend payment and the “Floating Yield on Price” is based on where the dividend would be if the rate reset today. In my opinion, for these shares the “Floating Yield on Price” is clearly the more important metric.
Note: Shares that are classified as “Other” are not necessarily the same. We provide further distinction. For the purpose of these charts, I lumped all of them together as “Other.” Now there are only two left, PMT-A and PMT-B. Those both have the same issue. Management claims the shares will be fixed rate, even though the prospectus says they should be fixed-to-floating.
Preferred Share Data
Beyond the charts, we’re also providing our readers with access to several other metrics for the preferred shares.
After testing out a series on preferred shares, we decided to try merging it into the series on common shares. After all, we're still talking about positions in mortgage REITs. We don’t have any desire to cover preferred shares without cumulative dividends, so any preferred shares you see in our column will have cumulative dividends. You can verify that by using Quantum Online. We’ve included the links in the table below.
To better organize the table, we needed to abbreviate column names as follows:
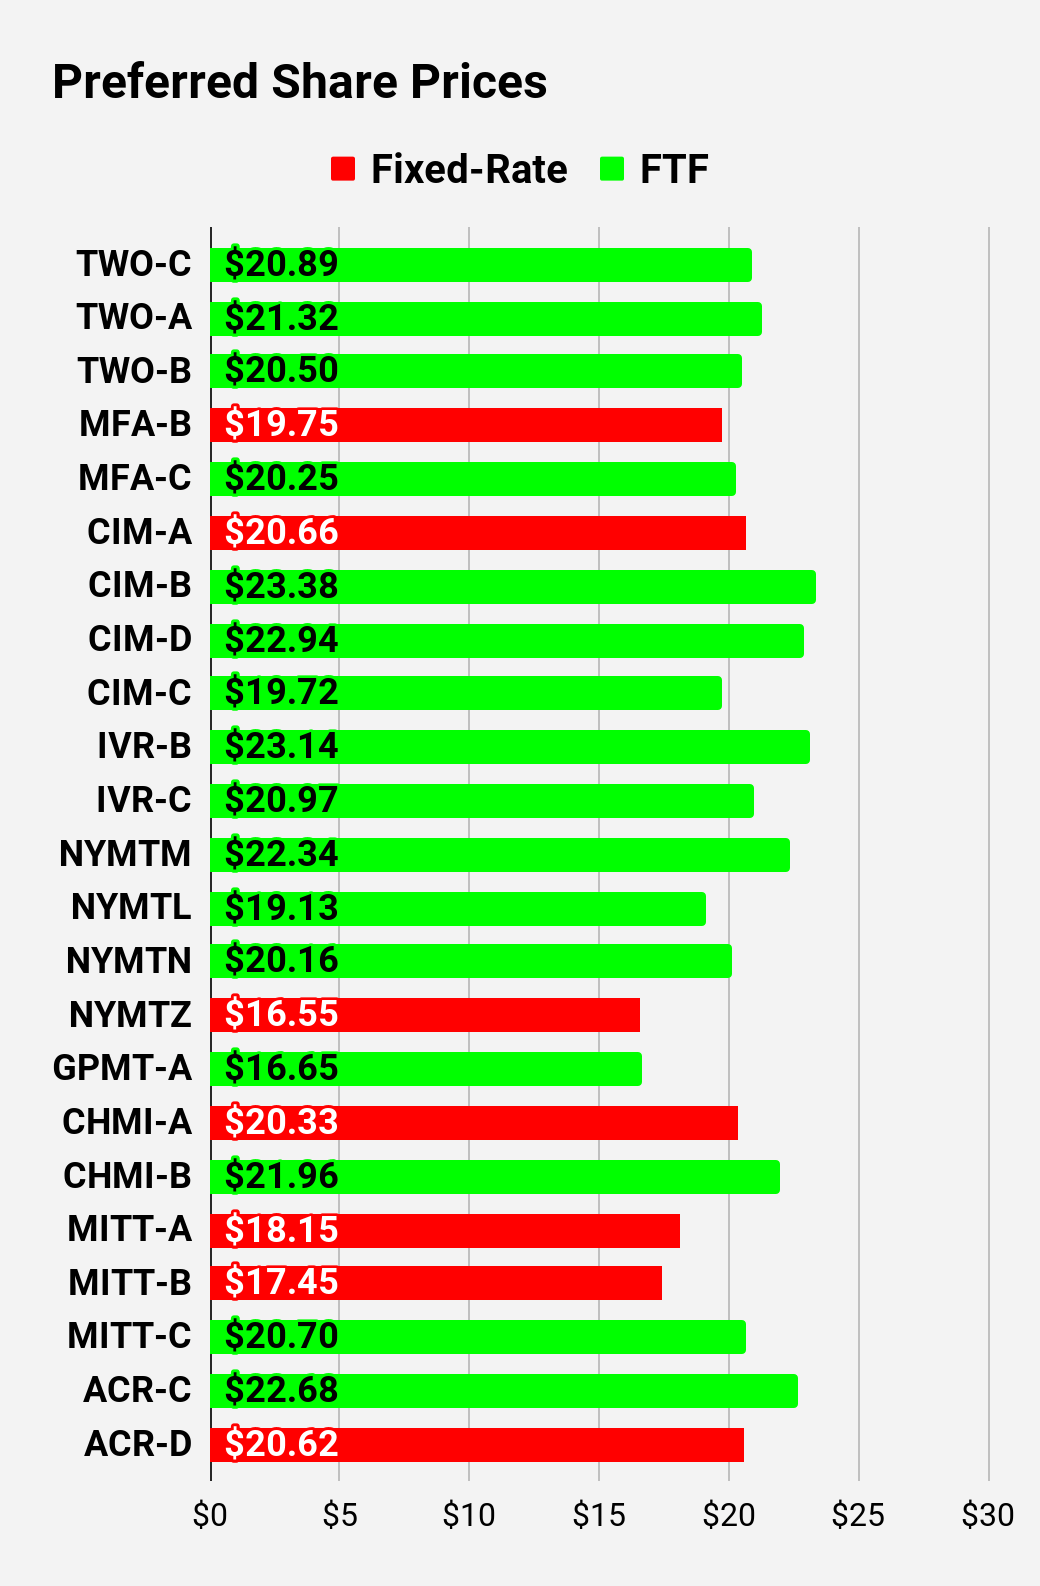
- Price = Recent Share Price - Shown in Charts
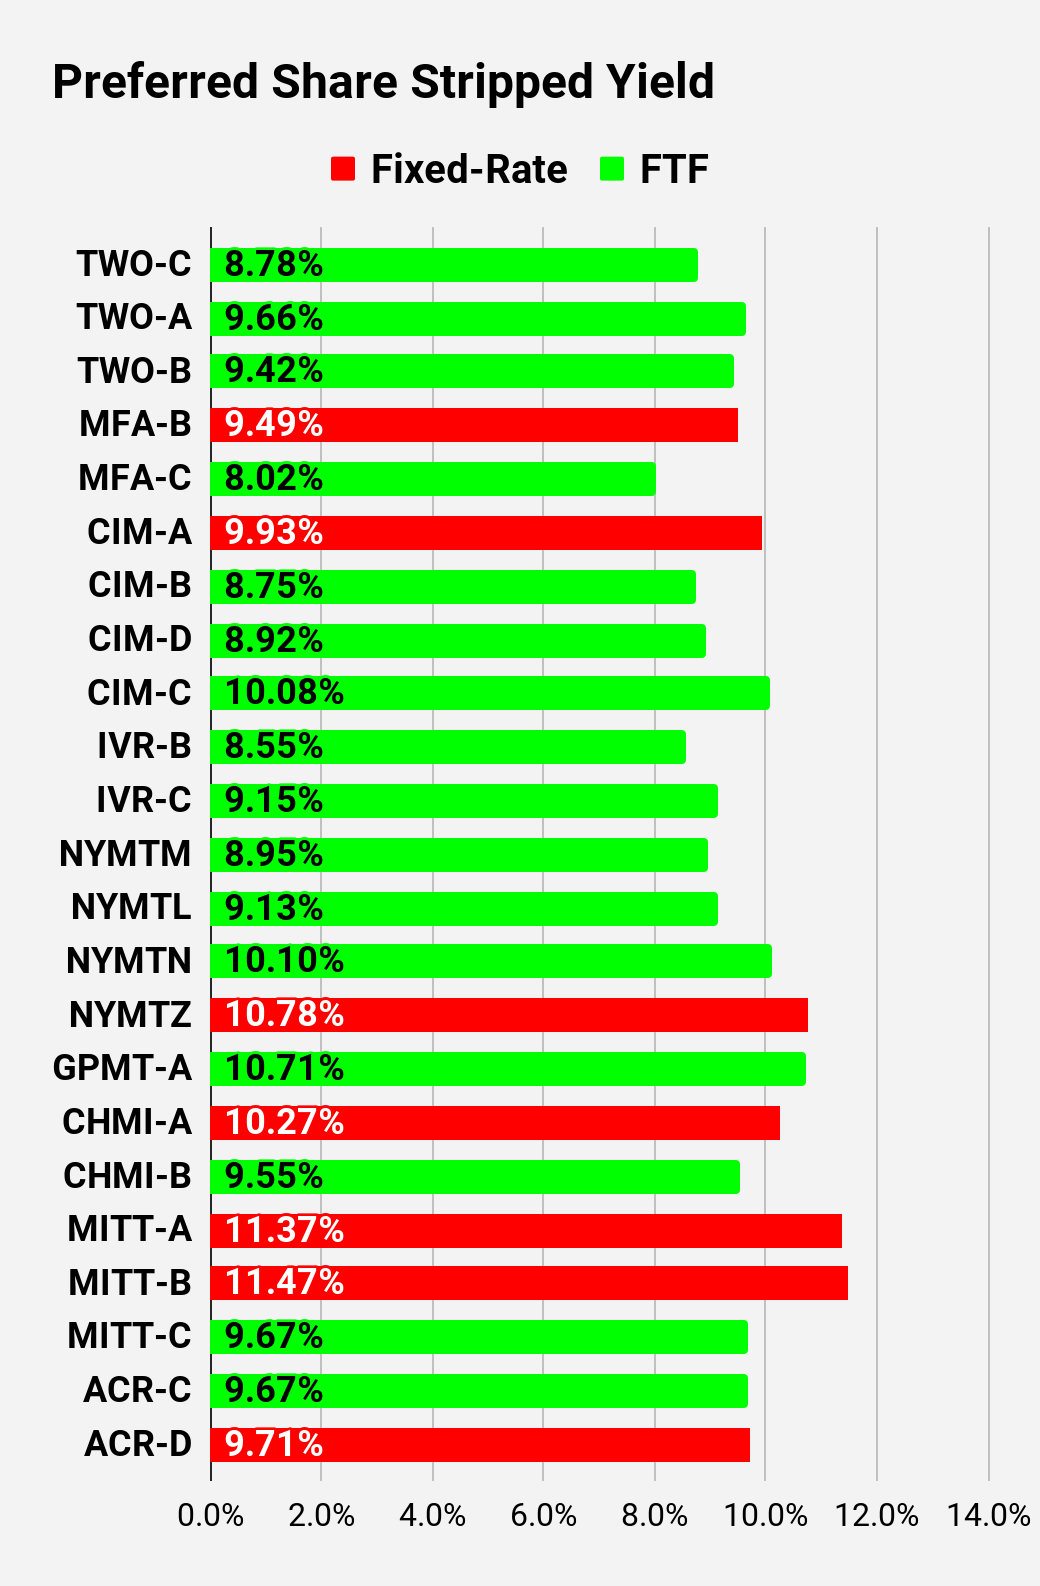
- S-Yield = Stripped Yield - Shown in Charts
- Coupon = Initial Fixed-Rate Coupon
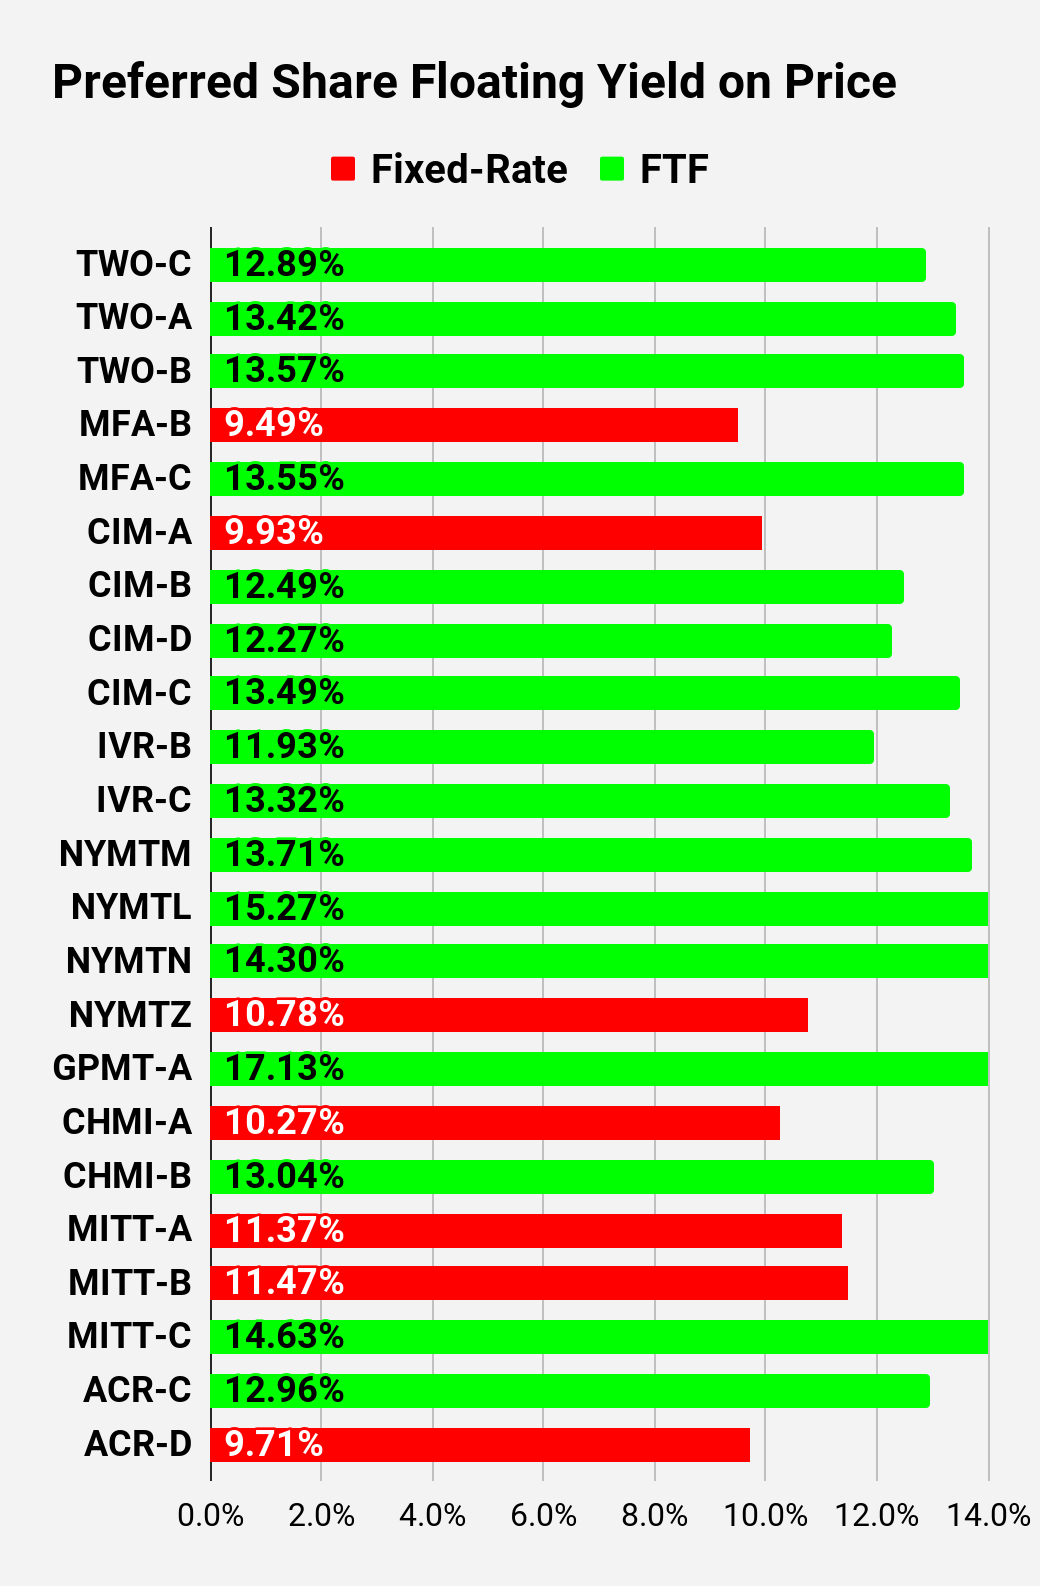
- FYoP = Floating Yield on Price - Shown in Charts
- NCD = Next Call Date (the soonest shares could be called)
- Note: For all FTF issues, the floating rate would start on NCD.
- WCC = Worst Cash to Call (lowest net cash return possible from a call)
- QO Link = Link to Quantum Online Page
| Ticker |
| Price |
| S-Yield |
| Coupon |
| FYoP |
| NCD |
| WCC |
| QO Link |
| P-Link |
| $23.93 |
| $0.07 |
| $0.05 |
| 7.32% |
| 12/31/2023 |
| $1.28 |
| $25.35 |
| $0.08 |
| $0.08 |
| 8.03% |
| 8/1/2025 |
| $3.16 |
| $23.71 |
| $0.06 |
| $0.05 |
| 6.33% |
| 12/31/2023 |
| $1.50 |
| $23.80 |
| $0.09 |
| $0.06 |
| 8.66% |
| 12/31/2023 |
| $1.45 |
| $23.75 |
| $0.09 |
| $0.06 |
| 8.82% |
| 12/31/2023 |
| $1.52 |
| $24.17 |
| $0.10 |
| $0.07 |
| 9.64% |
| 12/31/2023 |
| $0.89 |
| $23.68 |
| $0.09 |
| $0.06 |
| 8.71% |
| 12/31/2023 |
| $1.56 |
Second batch:
| Ticker |
| Price |
| S-Yield |
| Coupon |
| FYoP |
| NCD |
| WCC |
| QO Link |
| P-Link |
| $25.08 |
| $0.11 |
| $0.11 |
| 10.59% |
| 12/31/2023 |
| -$0.08 |
| $24.86 |
| $0.10 |
| $0.10 |
| 9.86% |
| 12/31/2023 |
| $0.14 |
| $24.21 |
| $0.07 |
| $0.07 |
| 10.97% |
| 6/30/2024 |
| $1.63 |
| $18.85 |
| $0.09 |
| $0.07 |
| 8.75% |
| 6/10/2026 |
| $10.41 |
| $23.46 |
| $0.07 |
| $0.07 |
| 11.98% |
| 4/15/2025 |
| $4.13 |
| $25.44 |
| $0.11 |
| $0.11 |
| 10.76% |
| 12/31/2023 |
| $0.14 |
| $23.66 |
| $0.07 |
| $0.07 |
| 10.66% |
| 4/15/2024 |
| $2.21 |
| $23.44 |
| $0.07 |
| $0.07 |
| 11.47% |
| 10/15/2024 |
| $3.20 |
| $21.73 |
| $0.07 |
| $0.06 |
| 12.03% |
| 4/15/2025 |
| $5.58 |
| $21.49 |
| $0.09 |
| $0.08 |
| 10.10% |
| 10/15/2027 |
| $11.28 |
| $19.83 |
| $0.09 |
| $0.07 |
| 8.86% |
| 1/28/2025 |
| $7.21 |
| $19.46 |
| $0.10 |
| $0.08 |
| 9.80% |
| 12/31/2023 |
| $5.94 |
| $22.57 |
| $0.08 |
| $0.07 |
| 12.15% |
| 10/30/2024 |
| $4.13 |
| $19.45 |
| $0.08 |
| $0.06 |
| 11.93% |
| 1/30/2027 |
| $10.65 |
| $22.68 |
| $0.10 |
| $0.09 |
| 10.41% |
| 4/30/2028 |
| $12.05 |
| $24.27 |
| $0.09 |
| $0.08 |
| 11.85% |
| 3/30/2024 |
| $1.68 |
| $20.47 |
| $0.09 |
| $0.07 |
| 8.71% |
| 12/31/2023 |
| $4.90 |
| $23.39 |
| $0.08 |
| $0.08 |
| 12.35% |
| 8/15/2024 |
| $3.03 |
| $22.62 |
| $0.08 |
| $0.07 |
| 12.59% |
| 08/15/2024 |
| $3.73 |
| $20.60 |
| $0.08 |
| $0.06 |
| 13.00% |
| 02/15/2025 |
| $6.41 |
| $21.49 |
| $0.08 |
| $0.07 |
| 12.21% |
| 11/15/2026 |
| $8.78 |
| $22.60 |
| $0.09 |
| $0.08 |
| 12.68% |
| 3/15/2024 |
| $2.91 |
| $22.29 |
| $0.09 |
| $0.08 |
| 13.04% |
| 6/15/2024 |
| $3.71 |
| $18.62 |
| $0.09 |
| $0.07 |
| 9.07% |
| 8/24/2026 |
| $10.92 |
Third batch:
| Ticker |
| Price |
| S-Yield |
| Coupon |
| FYoP |
| NCD |
| WCC |
| QO Link |
| P-Link |
| $20.89 |
| $0.09 |
| $0.07 |
| 12.89% |
| 1/27/2025 |
| $6.38 |
| $21.32 |
| $0.10 |
| $0.08 |
| 13.42% |
| 4/27/2027 |
| $10.79 |
| $20.50 |
| $0.09 |
| $0.08 |
| 13.57% |
| 7/27/2027 |
| $11.65 |
| $19.75 |
| $0.09 |
| $0.08 |
| 9.49% |
| 12/31/2023 |
| $5.26 |
| $20.25 |
| $0.08 |
| $0.07 |
| 13.55% |
| 3/31/2025 |
| $6.79 |
| $20.66 |
| $0.10 |
| $0.08 |
| 9.93% |
| 12/31/2023 |
| $4.93 |
| $23.38 |
| $0.09 |
| $0.08 |
| 12.49% |
| 3/30/2024 |
| $2.71 |
| $22.94 |
| $0.09 |
| $0.08 |
| 12.27% |
| 3/30/2024 |
| $3.15 |
| $19.72 |
| $0.10 |
| $0.08 |
| 13.49% |
| 9/30/2025 |
| $9.25 |
| $23.14 |
| $0.09 |
| $0.08 |
| 11.93% |
| 12/27/2024 |
| $4.31 |
| $20.97 |
| $0.09 |
| $0.08 |
| 13.32% |
| 9/27/2027 |
| $11.56 |
| $22.34 |
| $0.09 |
| $0.08 |
| 13.71% |
| 1/15/2025 |
| $5.13 |
| $19.13 |
| $0.09 |
| $0.07 |
| 15.27% |
| 10/15/2026 |
| $11.03 |
| $20.16 |
| $0.10 |
| $0.08 |
| 14.30% |
| 10/15/2027 |
| $12.85 |
| $16.55 |
| $0.11 |
| $0.07 |
| 10.78% |
| 1/15/2027 |
| $14.15 |
| $16.65 |
| $0.11 |
| $0.07 |
| 17.13% |
| 11/30/2026 |
| $13.81 |
| $20.33 |
| $0.10 |
| $0.08 |
| 10.27% |
| 12/31/2023 |
| $5.03 |
| $21.96 |
| $0.10 |
| $0.08 |
| 13.04% |
| 4/15/2024 |
| $4.00 |
| $18.15 |
| $0.11 |
| $0.08 |
| 11.37% |
| 12/31/2023 |
| $6.89 |
| $17.45 |
| $0.11 |
| $0.08 |
| 11.47% |
| 12/31/2023 |
| $7.59 |
| $20.70 |
| $0.10 |
| $0.08 |
| 14.63% |
| 9/17/2024 |
| $5.77 |
| $22.68 |
| $0.10 |
| $0.09 |
| 12.96% |
| 7/30/2024 |
| $3.95 |
| $20.62 |
| $0.10 |
| $0.08 |
| 9.71% |
| 5/21/2026 |
| $9.43 |
Strategy
Our goal is to maximize total returns . We achieve those most effectively by including “trading” strategies. We regularly trade positions in the mortgage REIT common shares and BDCs because:
- Prices are inefficient.
- Long term, share prices generally revolve around book value.
- Short term, price-to-book ratios can deviate materially.
- Book value isn’t the only step in analysis, but it's the cornerstone.
We also allocate to preferred shares and equity REITs. We encourage buy-and-hold investors to consider using more preferred shares and equity REITs. I will often trade some of our preferred share positions actively because of swings in relative valuation. It isn't necessary to do so, but I believe it has enhanced our performance.
For further details see:
Dropping A 12.6% Dividend Yielder