TTE - DTH: Valuation Return And Distribution Metrics Are Unattractive
2023-06-26 11:37:57 ET
Summary
- WisdomTree International High Dividend Fund holds over 500 high-yield stocks from developed countries.
- 63% of assets is in 5 countries and 40% is in 2 sectors.
- Valuation is unattractive relative to one of its main competitors.
- The fund has lost over 40% in share price since 2008.
- Moreover, distribution growth couldn’t keep pace with inflation.
This article series aims at evaluating ETFs (exchange-traded funds) regarding past performance and portfolio metrics. Reviews with updated data are posted when necessary.
DTH strategy and portfolio
WisdomTree International High Dividend Fund ( DTH ) started investing operations on 06/16/2006 and tracks the WisdomTree International High Dividend Index. It has 538 holdings, a distribution yield of 5.7% and a total expense ratio of 0.58%. It pays quarterly distributions.
As described by WisdomTree , to be eligible in the index companies must:
- pay regular cash dividends,
- be incorporated in Japan, 15 European countries, Australia, Israel, Hong Kong or Singapore,
- have a market capitalization of at least $200 million and an average daily dollar volume of at least $200,000.
The top 5% ranked by dividend yield and the bottom half of a risk ranking based on momentum and quality metrics are excluded. Then, companies ranking in the top 30% by highest dividend yield are selected for inclusion. They are excluded when they fall out of the top 35% by dividend yield. Their weights are adjusted based on dividends. The index is reconstituted once a year.
Components are mostly large and mega-cap companies (about 75% of asset value). Australia and the U.K. are the heaviest countries in the portfolio, almost tie (15.2% and 15.1%, respectively). They are followed by Japan (12.2%), France (10.4%) and Germany (10.1%). Other countries weigh less than 8% individually and 37% in aggregate. The next chart includes all countries with a weight over 1%, which represent 96% of the portfolio.
DTH country allocation (chart: author with WisdomTree data.)
The fund is heavy in financials (24.9% of assets), and to a lesser extent in materials (15.1%). Other sectors are below 10%. Technology is almost ignored.
DTH sectors ( chart: author with WisdomTree data.)
I will use as a benchmark one of the fund’s largest competitors among non-hedged ex-US dividend funds: iShares International Select Dividend ETF ( IDV ). IDV expense ratio is a bit lower (0.49%) and it has a much higher trading volume (770k vs. 50k shares/day on average). DTH is significantly more expensive regarding the usual valuation ratios, as reported in the next table.
| DTH |
| IDV |
| P/E TTM |
| 7.73 |
| 5.24 |
| Price/book |
| 1.08 |
| 0.82 |
| Price/sales |
| 0.81 |
| 0.72 |
| Price/cash flow |
| 4.8 |
| 4.1 |
Data: Fidelity
The top 10 holdings, listed in the next table, represent 24.3% of asset value. Exposure to BHP Group is over 5%. Risks related to other companies are moderate. IDV also holds BHP Group, but other top holdings are different. Concentration is similar: about 5% in the top name and 28% in the top 10.
For convenience, U.S. tickers are listed below, whereas the fund holds stocks in primary exchanges.
| US Ticker |
| Name |
| Primary Ticker |
| Weight |
| EPS growth %TTM |
| P/E TTM |
| P/E fwd |
| Yield% |
| BHP Group Ltd. |
| BHP AU |
| 5.67% |
| 19.47 |
| 7.55 |
| 10.37 |
| 8.94 |
| Novartis AG |
| NOVN SW |
| 3.83% |
| -69.76 |
| 30.79 |
| 14.87 |
| 3.47 |
| TotalEnergies SE |
| TTE FP |
| 2.86% |
| 24.93 |
| 6.73 |
| 5.48 |
| 5.22 |
| HSBC Holdings plc |
| HSBA LN |
| 2.36% |
| 97.86 |
| 6.78 |
| 6.23 |
| 5.49 |
| Rio Tinto |
| RIO LN |
| 2.30% |
| -40.58 |
| 8.17 |
| 8.70 |
| 7.75 |
| Mercedes-Benz Group AG |
| MBG GR |
| 1.86% |
| -39.30 |
| 5.39 |
| N/A |
| 7.33 |
| Sanofi |
| SAN FP |
| 1.39% |
| 18.88 |
| 15.28 |
| 11.84 |
| 3.56 |
| British American Tobacco |
| BATS LN |
| 1.37% |
| -13.14 |
| 9.35 |
| 6.91 |
| 8.16 |
| Bayerische Motoren Werke AG |
| BMW GR |
| 1.33% |
| -47.58 |
| 6.56 |
| 6.58 |
| 7.81 |
| BP p.l.c. |
| BP/ LN |
| 1.31% |
| 257.44 |
| 4.10 |
| 5.85 |
| 4.35 |
Fundamental data: Portfolio123
Past performance
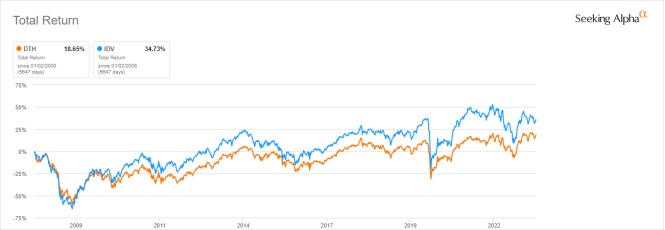
The next chart compares total returns of DTH and IDV since 1/1/2008. DTH has lagged its competitor by about 16% in 15 years. The difference in annualized return is less impressive: less than one percentage point.
DTH vs. IDV since 1/1/2008 (Seeking Alpha)
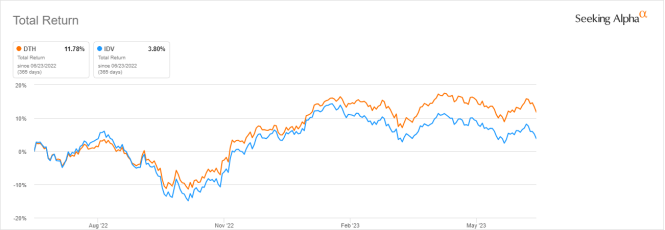
However, DTH has outperformed in the last 12 months:
DTH vs. IDV, trailing 12 months ( Seeking Alpha)
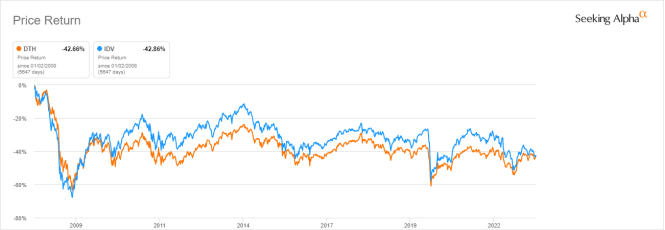
Both funds have suffered a decay in share price of almost 43% since 2008:
DTH vs. IDV, share price return (Seeking Alpha)
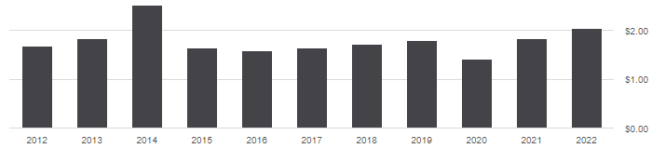
The annual sum of distribution has increased from $1.69 to $2.04 per share between 2012 and 2022. This dividend growth of 20.7% is below the cumulative inflation in the same time: about 29%, based on CPI. Our benchmark IDV has not done much better: 22.1%.
DTH distribution history (Seeking Alpha)
Takeaway
WisdomTree International High Dividend Fund holds over 500 high-yield stocks from developed countries. About 63% of asset value is in five markets (U.K., Australia, Japan, France, Germany) and 40% is in two sectors (financials and materials). Valuation ratios are unattractive compared to its larger competitor iShares International Select Dividend ETF. DTH has suffered a share price decay over 40% since 2008 and distributions couldn’t keep pace with inflation since 2012. However, our benchmark IDV has not performed significantly better. This issue is not specific to these two funds: many high-yield ETFs have suffered significant capital decay over the years.
For further details see:
DTH: Valuation, Return And Distribution Metrics Are Unattractive